The 20-second orientation CPET is a constellation, not a cutoff. First confirm whether the test can answer the question; then grade capacity, inspect ventilatory efficiency, and localize the limiting physiology. Use the laboratory's protocol-specific predicted values or lower limit of normal (LLN) whenever available.
1

The cockpit — four numbers first

validity · capacity · efficiency · ceiling
Effort check · RER
>1.05 + AT
Acceptable support for HF-candidate interpretation; ≥1.10 is stronger. Pair with symptoms, workload, HR, and the VO₂ response.
Capacity · peak VO₂
LLN / % pred
Headline severity + prognosis. Prefer the lab's reference equation; absolute mL/kg/min matters in advanced HF.
Efficiency · VE/VCO₂
<30 expected
The ventilatory tax of clearing CO₂. A slope >35 is adverse in HF and abnormal in the right pattern.
Ventilatory ceiling · BR
>15–20%
Ventilation left in the tank. >15–20% is usually preserved; a low value matters most when mechanics agree.
O₂ pulse · VO₂/HRShould rise with work. A low, early plateau or fall suggests impaired O₂ delivery, stroke-volume response, or extraction—not a diagnosis by itself.
AT · the metabolic kneeIdentify with V-slope, then confirm using ventilatory equivalents. An early AT strengthens evidence of physiologic limitation.
SpO₂ + PETCO₂Desaturation with low or falling PETCO₂ and a steep VE/VCO₂ response points toward gas-exchange or pulmonary-vascular disease.
2

The Fick frame — where can VO₂ fail?

rate · pump · extraction
VO₂ = HR × SV × C(a-v)O₂
oxygen use = delivery × extraction
HR
Rate
Low chronotropic response—or an excessive HR for the work.
SV
Pump
Low/flat O₂ pulse, flattened VO₂/work, or exercise hypotension.
C(a-v)O₂
Extraction
Peripheral, muscular, hematologic, or mitochondrial limitation.
3

Read in order — then name the dominant limiter

never jump straight to peak VO₂
  1. 01Confirm the testIndication · protocol · calibration · stop reason · effort
  2. 02Grade capacityPeak VO₂ · % predicted/LLN · AT · VO₂/work
  3. 03Triangulate mechanismO₂ pulse + VE/VCO₂ + BR + PETCO₂ + SpO₂ + HR
Cardiac
Flat/low O₂ pulse · low AT · normal BR · ± chronotropic failure
Pulmonary mechanical
Low BR · flow limitation · dynamic hyperinflation · ± desaturation
Pulmonary vascular
Steep VE/VCO₂ · low/falling PETCO₂ · desaturation · low O₂ pulse
Peripheral / conditioning
Low capacity without a clear central ceiling; a diagnosis of exclusion
4

Who to test — and when to stop before starting

safety first

High-value indications

  • Unexplained dyspnea / exercise intolerance and mechanism localization.
  • HF prognosis and advanced-therapy evaluation; PH, pre-operative risk, exercise prescription, serial response.

Defer / contraindicated

  • Acute MI/ACS, decompensated HF, acute PE, active myocarditis/pericarditis.
  • Severe symptomatic AS, uncontrolled arrhythmia, severe uncontrolled asthma, or another unstable condition.
6MWT trends function. CPET explains physiology and prognosis. Screen and follow with the walk; answer the hard mechanism or candidacy question with CPET.
Pattern before label A low peak VO₂ tells you how much capacity is lost. The combination of O₂ pulse, VE/VCO₂, breathing reserve, PETCO₂, SpO₂, HR, and the stop reason suggests why. Mixed limitation is common; report the dominant physiology and the competing signals.
1

Four curves worth recognizing at a glance

conceptual shapes · interpret in context

O₂ pulse vs work

expectedflat
Expected rise and late plateau. Low or early flattening supports impaired O₂ delivery/SV response.

VE/VCO₂ relationship

efficientsteep
A steep slope >35 is adverse in HF and supports ventilatory inefficiency in context.

V-slope · finding AT

A candidate ventilatory thresholdVCO₂VO₂Candidate AT
The slope break suggests AT. Confirm with ventilatory equivalents and end-tidal gases. Original schematic, not patient data.

PETCO₂ vs work

rise/plateaufall
Low or falling PETCO₂ plus steep VE/VCO₂ and desaturation suggests pulmonary-vascular disease.
2

Limitation signatures — match the cluster

clues, not standalone diagnoses

Cardiac / circulatory

↓ peak VO₂flat O₂ pulsenormal BR± chronotropy

Think limited cardiac output or O₂ delivery when VO₂/work also flattens and the ventilatory ceiling remains unused.

Pulmonary mechanical

low BRflow limithyperinflation± desat

Confirm valid spirometry/MVV and inspect exercise flow-volume loops; VE/VCO₂ may be variable.

Pulmonary vascular / PH

↑ VE/VCO₂↓ PETCO₂desatlow O₂ pulse

The convergent gas-exchange pattern matters more than any one feature; consider hemodynamic confirmation.

Peripheral / conditioning

↓ capacitypreserved BRnormal efficiencyhigh HR/work

This nonspecific pattern may fit conditioning or peripheral limitation only after competing cardiac, ventilatory, gas-exchange, hematologic, and muscular causes are considered.

Obesity / indexing effect

absolute VO₂ preservedper-kg VO₂ low↑ work O₂ cost

Compare absolute, total-body-mass indexed, and—when relevant in HF—lean-body-mass adjusted peak VO₂.

Submaximal / nonphysiologic stop

RER <1.05early stopno ceilingerratic VE

Do not overcall a low peak. Re-anchor the read to VE/VCO₂, OUES, AT, % predicted, and the stop reason.

3

Translate the terms into physiology

mental model · normal orientation · traps
Mechanical headroom

Breathing reserve · BR

Think: “How much ventilation was left in the tank at peak?” It compares exercise demand (VEpeak) with estimated ventilatory capacity (MVV).

BR% = 100 × (1 − VEpeak/MVV)
Orientation: >15–20% remaining is usually preserved. <15% or <11 L/min remaining supports ventilatory constraint; practical guides also use <15–20% or <11–15 L/min. MVV may be measured or estimated as FEV₁ × 40.
Pearl · Low BR is compelling when dyspnea and mechanics agree: expiratory flow limitation, falling inspiratory capacity/dynamic hyperinflation, or a tidal-volume plateau.
Pitfall · Software may show remaining BR or used capacity (VE/MVV)—opposite directions. Estimated MVV is imprecise; athletes may exhaust reserve, and preserved BR does not exclude lung disease.
Ventilatory efficiency

VE/VCO₂ slope

Think: the ventilatory tax for CO₂ clearance—roughly how many liters of air must move for each liter of CO₂ produced. The tax rises with more dead-space ventilation, less effective pulmonary perfusion, or a lower PaCO₂ set-point / greater ventilatory drive.

slope ≈ ΔVE / ΔVCO₂
Orientation: about 25–30 is often efficient; ≥35 is elevated in many HF and pulmonary-vascular contexts. Prefer the lab's age-specific upper limit and confirm the fitted interval through respiratory compensation.
Pearl · A steep slope plus low/falling PETCO₂ and preserved BR supports a pulmonary-vascular/HF pattern more than the slope alone.
Pitfall · It is not a pure V/Q measure. Anxiety, hyperventilation, lung disease, HF, acidosis, and calculation method move it; slope, ratio, and nadir are related—not interchangeable.
Reference boundary

LLN · lower limit of normal

Think: the “unusually low” boundary in a matched healthy reference population—usually the 5th percentile (z ≈ −1.645). Below LLN is statistically unusual, not a diagnosis; fixed 80–85% predicted is orientation, not the LLN. Use a population-, mode-, protocol-, and analysis-appropriate equation.

O₂ per heartbeat

O₂ pulse · VO₂/HR

Think: oxygen used per beat = stroke volume × peripheral extraction. Watch the trajectory: an early plateau or fall matters more when VO₂/work, BP, ECG, or symptoms agree. It is not direct stroke volume; hemoglobin, extraction, rhythm, body size, and drugs alter it.

Exhaled CO₂ clue

PETCO₂

Think: CO₂ at the end of exhalation—a clue to perfusion and the ventilatory set-point, not arterial PaCO₂. Low/falling PETCO₂ with a steep VE/VCO₂ response supports excess dead-space / PH-HF physiology; leaks and abnormal breathing patterns can distort it.

Metabolic gear change

AT / VT1

Think: the first sustainable transition where buffering adds CO₂ and VCO₂ begins to outpace VO₂. Triangulate the V-slope break with a VE/VO₂ and PETO₂ rise while VE/VCO₂ and PETCO₂ remain stable. If the signals disagree, do not force a threshold.

Start with the axes—not the panel number Vendor layouts and the original versus updated Wasserman arrangement use different numbers for the same plots. This page follows the updated Glaab–Taube teaching order: match the variables and axes, then read rest → ramp → peak → recovery.
1 → 2 → 3O₂ transport · capacity, rate, pulse, and threshold
4 → 6 → 7Gas exchange · efficiency, V/Q behavior, and end-tidal gases
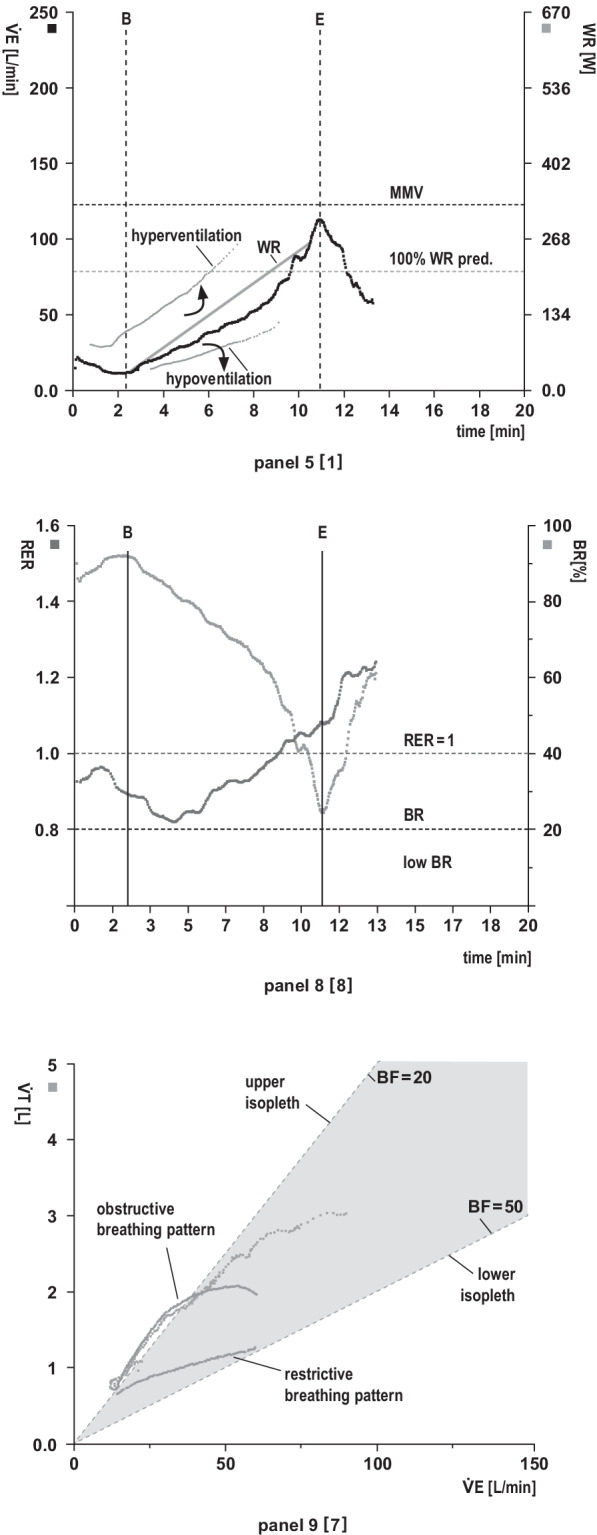
5 → 8 → 9Ventilatory response · demand, reserve, and breathing pattern
1

Nine panels — four questions for each

why · look · pearl · pitfall
1O₂ transport · capacity

VO₂ + VCO₂ / time · VO₂ / work

Why it matters: Frames total aerobic capacity and whether O₂ uptake rises appropriately for each watt.

LookPeak VO₂ versus the right reference; ΔVO₂/ΔWR shape; early flattening, oscillations, and delayed recovery.

PearlFlattening plus concordant O₂-pulse, BP, ECG, or symptom change strengthens a circulatory signal.

PitfallLow peak VO₂ is nonspecific; effort, body size, mode, ramp, and averaging all move the result.

2O₂ transport · rate / pulse

HR + O₂ pulse / time

Why it matters: HR shows chronotropy; O₂ pulse (VO₂/HR) reflects stroke volume × peripheral extraction.

LookHR rise, recovery, rhythm, and reserve; a generally rising O₂ pulse rather than an early plateau or late fall.

PearlTrajectory plus concordant physiology is more useful than one peak value.

PitfallO₂ pulse is not direct SV; Hb, extraction, body size, rhythm, β-blockade, and pacing alter it.

3O₂ transport · threshold

VCO₂ vs VO₂ · HR vs VO₂

Why it matters: The V-slope locates AT/VT1; HR versus VO₂ shows the rate cost of rising metabolic demand.

LookA sustained VCO₂ slope break—not one noisy breath—and a linear versus steep, flat, or irregular HR response.

PearlConfirm AT against panels 4 and 7; agreement among all three increases confidence.

PitfallNever force AT: short ramps, early stopping, leaks, and erratic breathing can hide or imitate it.

4Gas exchange · equivalents

VE/VO₂ + VE/VCO₂ / time

Why it matters: Shows litres ventilated per litre of O₂ consumed or CO₂ cleared and helps triangulate AT.

LookBoth fall early; AT is supported when VE/VO₂ turns upward while VE/VCO₂ stays stable.

PearlUse the trend and nadir with panels 3 and 7—not a single point.

PitfallHigh equivalents are nonspecific; dead space, drive, anxiety, and acidosis can all elevate them.

5Ventilation · demand

VE + work / time

Why it matters: Shows whether minute ventilation tracks the ramp and its physiologic phase transitions.

LookProportional rise, abrupt early hyperventilation, inadequate rise, oscillation, erratic breathing, and recovery.

PearlThe work trace separates physiology from unloading, ramp transitions, coasting, and recovery.

PitfallHigh VE is not proof of a mechanical limit; unexpectedly low VE may simply be mask or mouthpiece leak.

6Gas exchange · efficiency

VE vs VCO₂

Why it matters: The submaximal slope shows how much ventilation is required to clear generated CO₂.

LookSlope and shape together with PETCO₂, saturation, breathing reserve, EOV, and the cardiac panels.

PearlA steep slope plus low/falling PETCO₂ and preserved reserve strengthens a PH/HF phenotype.

PitfallIt is not a pure V/Q measure; calculation interval, whole-test slope, nadir, and post-RCP slope are not interchangeable.

7Gas exchange · end-tidal

PETO₂ + PETCO₂ / time

Why it matters: End-tidal trends indirectly track ventilatory drive, V/Q behavior, and threshold timing.

LookPETO₂ nadir then rise with stable PETCO₂ at AT; persistent low/falling PETCO₂ with high PETO₂ signals overventilation/inefficiency.

PearlConcordance with panels 4 and 6 plus SpO₂ is more useful than either gas alone.

PitfallPETCO₂ is not PaCO₂; dead space and leak widen the gap—use blood gases when the distinction changes care.

8Ventilation · effort / reserve

RER + breathing reserve

Why it matters: RER supports achieved metabolic intensity; reserve estimates unused ventilatory capacity.

LookBoth trajectories, peak RER, and whether VE truly approaches capacity with matching symptoms and mechanics.

PearlLow reserve is persuasive when flow limitation, dynamic hyperinflation, or tidal-volume constraint agrees.

PitfallNo universal RER pass/fail; verify whether software shows remaining BR or VE/MVV—the directions are opposite.

9Ventilation · breathing pattern

VT / VE + breathing frequency

Why it matters: Decomposes ventilation into breath depth and rate to reveal the breathing strategy.

LookVT should rise then plateau as frequency takes over; flag an early low plateau, tachypnea, falling VT, or irregularity.

PearlPair with serial inspiratory capacity and exercise flow-volume loops when mechanics matter.

PitfallRapid shallow breathing is nonspecific; anxiety, mask discomfort, body size, and protocol can mimic disease.
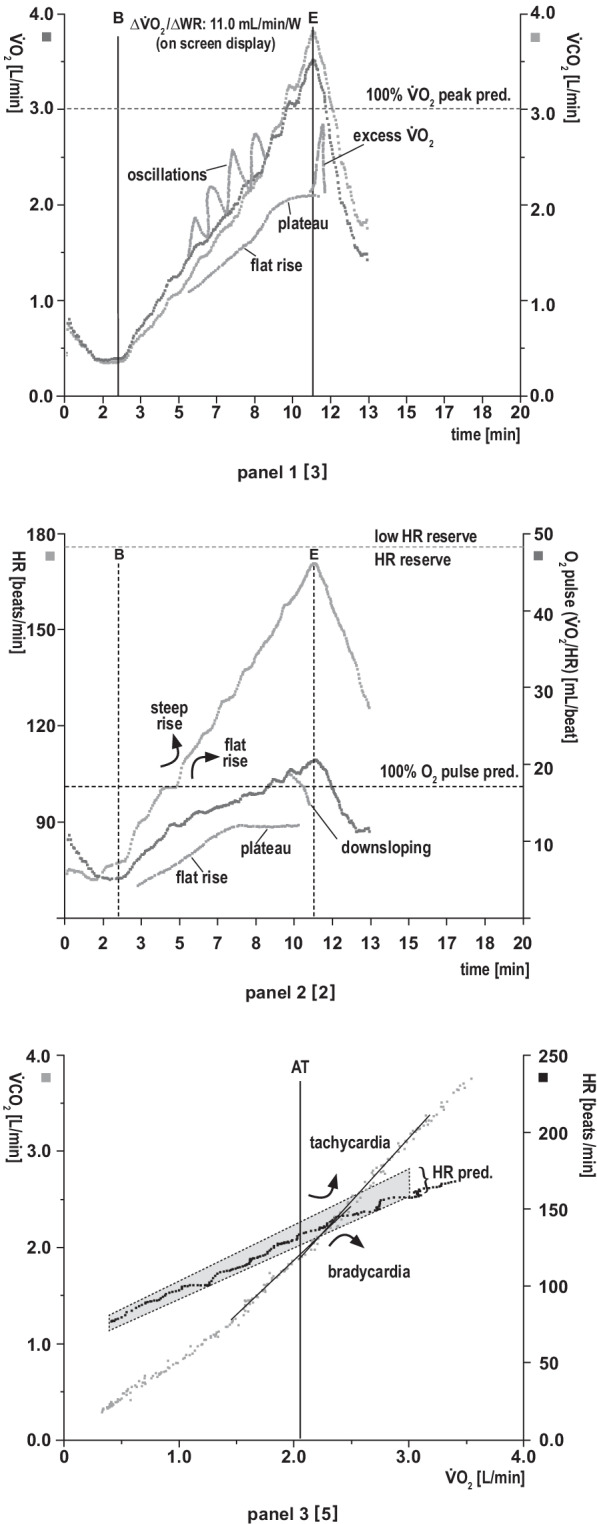
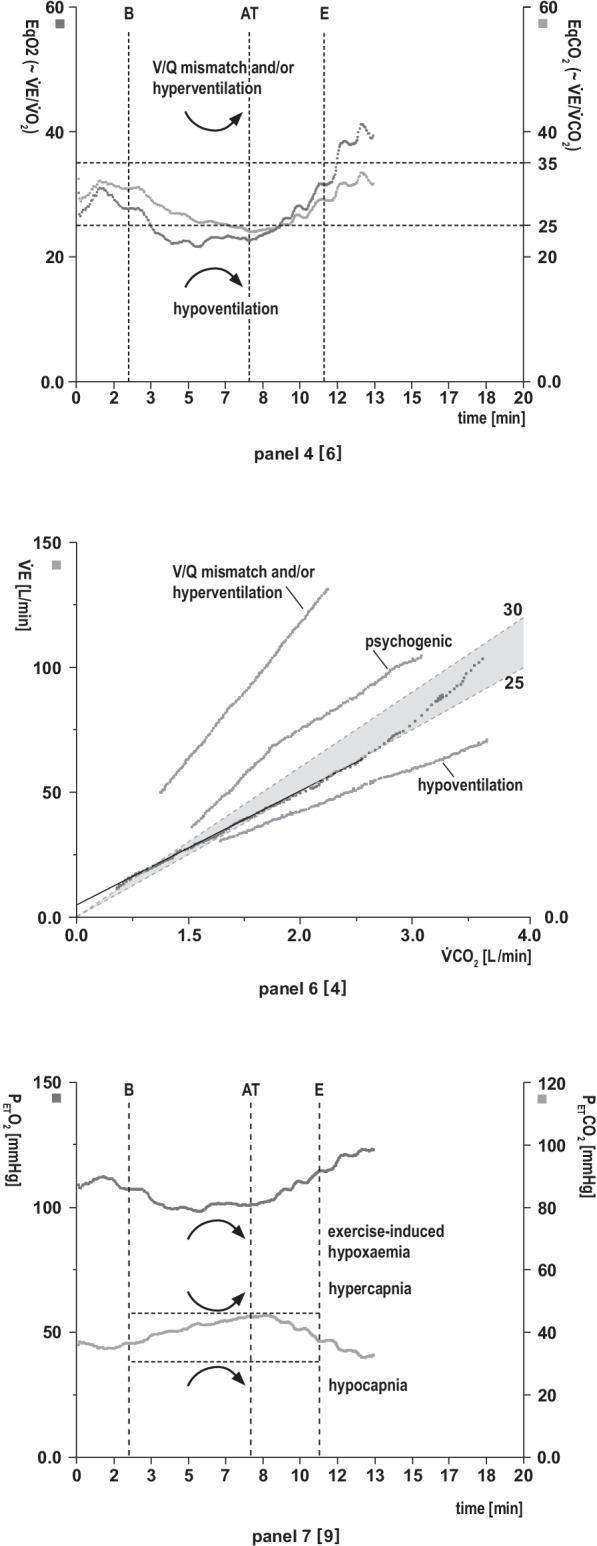
AT triangulation · panels 3 + 4 + 7. Seek a concordant V-slope break, VE/VO₂ rise with stable VE/VCO₂, and PETO₂ rise with stable PETCO₂. If they disagree, report AT as uncertain rather than forcing it.
Pattern rule · one panel rarely diagnoses. Integrate protocol, workload, effort, stop reason, symptoms, ECG/BP, SpO₂, spirometry, medications, hemoglobin, and the other eight plots.
Licensed teaching figures Use the real annotated curves after the page-3 decoder. Read the axes and variables first, then compare shape, timing, and concordance across the oxygen-transport, gas-exchange, and ventilatory domains. The bracketed numbers in these published figures refer to the original nine-panel arrangement.
1

Published 9-panel teaching atlas

three domains · nine linked plots
O₂ transportUPDATED 1 → 2 → 3
Published CPET cardiovascular panels showing oxygen uptake and carbon dioxide output, heart rate and oxygen pulse, and V-slope patterns
Figure 2 · Cardiovascular route (panels 1–3). VO₂/VCO₂, HR/O₂ pulse, and V-slope/HR relationships.
Gas exchangeUPDATED 4 → 6 → 7
Published CPET gas exchange panels showing ventilatory equivalents, ventilation versus carbon dioxide production, and end-tidal gas patterns
Figure 3 · Gas-exchange route (panels 4, 6, 7). Ventilatory equivalents, VE/VCO₂, and end-tidal gases.
Ventilatory responseUPDATED 5 → 8 → 9
Published CPET ventilatory panels showing ventilation and work rate, respiratory exchange ratio and breathing reserve, and breathing pattern
Figure 4 · Ventilatory route (panels 5, 8, 9). VE/work, RER/breathing reserve, and breathing pattern.
CC BY 4.0 attribution. Figures 2–4 reproduced from Glaab T, Taube C. Practical guide to cardiopulmonary exercise testing in adults. Respiratory Research. 2022;23:9. Source: doi.org/10.1186/s12931-021-01895-6. Licensed under CC BY 4.0. Changes: resized and arranged in three columns; figure content unchanged.
Supportive signals—not automatic eligibility In advanced HF, CPET grades functional severity and informs timing of transplant evaluation. The 2024 ISHLT guideline retains familiar peak VO₂ and VE/VCO₂ signals while emphasizing integration with the whole candidacy picture.
1

Advanced-therapy referral / candidacy signals

2024 ISHLT · interpret in context
≤12
mL/kg/min
Peak VO₂
on β-blocker
≤14
mL/kg/min
Peak VO₂
off β-blocker
≤50%
predicted peak VO₂
Women or age
≤50 or ≥70 yr
>35
VE/VCO₂ slope
All—especially a
submaximal CPET
≤19
mL/kg/min lean mass
Consider when
BMI ≥30 kg/m²
2

Weber severity — the functional spectrum

peak VO₂ · mL/kg/min
A
>20
Mild / none
B
16–20
Mild–moderate
C
10–<16
Moderate–severe
D
<10
Severe
Weber & Janicki functional classification.12 and 14 both sit inside Weber C—they answer a candidacy question, not the same question as the class.
3

Choose the right gate based on test validity

maximal vs submaximal
✓Maximal / interpretable effort
  • For the ISHLT threshold table: RER >1.05 and AT reached.
  • Apply peak VO₂ cutoffs with β-blocker status; add % predicted, VE/VCO₂, BP/HR response, EOV, symptoms, and trajectory.
↺Submaximal / uncertain effort
  • Do not let one low peak VO₂ drive a listing decision.
  • Lean on VE/VCO₂ >35, % predicted, OUES, AT, VO₂/work, and repeat testing when useful.
4

Never one number alone

the candidacy picture
CPET tells you risk. The team decides what that risk means.
trajectory / serial CPETGDMT + CRT responsehemodynamicsend-organ functionfrailty + nutritionRV / PHadherence + supportcompeting comorbidity
5

Beyond candidacy — the same physiology, new question

four high-value uses
Pre-operative riskLow AT and peak VO₂ identify reduced reserve; interpret using procedure- and pathway-specific thresholds.
Dyspnea / PHSteep VE/VCO₂ + low PETCO₂ + desaturation supports a pulmonary-vascular or gas-exchange mechanism.
Exercise prescriptionUse AT and peak response to set individualized intensity and monitor safety.
Serial trajectoryTrack disease, rehabilitation, GDMT, CRT, and advanced-HF progression with comparable protocols.
The one-liner: verify effort; grade peak VO₂ against the right reference; use ≤12 on β-blocker, ≤14 off β-blocker, ≤50% predicted in relevant groups, or VE/VCO₂ >35 as supportive advanced-HF signals; then make the decision in full clinical context.