Timing
P waves and their relation to QRS complexes describe atrial activity and conduction. QRS duration describes ventricular activation time. QT contains depolarization and repolarization.
The surface ECG records projected voltage over time. Different anatomy, activation sequences and recording conditions can produce similar shapes; pattern recognition needs clinical context and targeted confirmation.
P waves and their relation to QRS complexes describe atrial activity and conduction. QRS duration describes ventricular activation time. QT contains depolarization and repolarization.
The same source is viewed through different lead axes. Opposite deflections need not mean different beats. The limb leads describe the frontal plane; chest leads sample different spatial fields.
Voltage depends on the source, geometry, body tissues, electrodes and gain. High voltage is not a direct measurement of wall thickness; low voltage does not identify an infiltrative protein.
ST–T shape must be interpreted relative to QRS direction, symptoms and prior recordings. Secondary repolarization changes can mimic primary ischemia.
QT includes QRS depolarization time. A wide QRS may prolong QT even without the same increase in repolarization time; report QRS duration and choose an appropriate interpretation method.
At 25 mm/s, one small square is 40 ms; at 10 mm/mV, one small square is 0.1 mV. A displayed image may be resized: measure from its printed grid and calibration pulse, not a ruler held against a screen. Place chest electrodes against the chest wall at the anatomical landmarks; breast tissue is not a replacement landmark.
In the same horizontal plane as V4, at the anterior axillary and midaxillary positions; not progressively lower intercostal spaces.
Chest-lead reference is unchanged; usual R-wave progression can persist.
Negative I and positive aVR can overlap with arm reversal.
Conventional left-chest R progression is commonly poor or reversed.
Check examination/imaging and label an adapted repeat ECG.
An unexpectedly negative P–QRS–T complex in I and positive aVR should trigger a cable check, especially when the prior ECG had a different orientation. An axis label from the computer cannot distinguish a biological change from a change in the measurement system.
No. Check the P wave, all limb leads, chest progression, actual cable placement and the clinical anatomy.
Removes slow baseline components.
Tradeoff: phase distortion can alter the ST level.
Removes rapid signal components.
Tradeoff: QRS notches and pacing spikes can fade.
Baseline wander, muscle activity, loose electrodes and electrical interference can imitate rhythm or repolarization abnormalities. Look across simultaneous leads for native QRS complexes continuing through noise, and relate the pattern to movement and the observed patient. Do not use apparent clinical stability alone to dismiss a dangerous rhythm.
A primary 45-patient experiment demonstrated artifactual ST shifts with a 0.5-Hz high-pass filter in real-time mode. This is a phase-response issue: modern validated digital filtering cannot be judged by the cutoff number alone. A 40-Hz low-pass filter can improve noise but attenuate rapid QRS detail and pacing spikes.
An excessively low low-pass cutoff removes high-frequency detail. High-pass phase distortion is a different mechanism that may alter ST level.
Original teaching schematics, not patient recordings. CC BY 4.0 or MIT. Timing and voltage are illustrative unless explicitly labeled.
Use a long strip and actual RR measurements. Look beyond one short sample.
Inspect several leads for consistent P waves, flutter activity, premature atrial beats or a rhythm marching through artifact.
A fixed relationship, variable conduction, nonconducted premature P wave or independent rhythms can explain the same pause.
Disorganized atrial activity, no consistent P-wave pattern and irregular ventricular intervals when AV conduction is present. Confirm visually; a machine label is insufficient.
AF can have a regular ventricular rhythm with complete AV block or pacing. Flutter with variable AV conduction can look irregular. Artifact can mimic fibrillation.
Characterize the organized atrial rhythm and conduction ratio. Do not equate an irregular ventricular response with AF.
No. Complete AV block or ventricular pacing can regularize the response despite atrial fibrillation. Inspect the atrial activity and AV relationship.
Original teaching schematics, not patient recordings. CC BY 4.0 or MIT. Timing and voltage are illustrative unless explicitly labeled.
Progressive PR lengthening before a nonconducted P wave, followed by a shorter PR. Real Wenckebach sequences can be atypical; inspect an entire cycle.
Stable conducted PR intervals around a nonconducted P, with stable sinus timing. Exclude concealed ectopy and vagal slowing before assigning the pattern.
Every other P conducts. The short surface sequence does not distinguish Mobitz I from Mobitz II; do not label it “2:1 Mobitz II.”
Independent atrial and ventricular rhythms may reflect complete block or a ventricular rhythm faster than the atria. Determine both rates and whether any atrial impulses conduct.
The surface 2:1 sequence lacks enough conducted PR intervals to establish the Mobitz pattern. The ratio alone cannot classify the block; examine longer recordings and the clinical context.
Usually 0° to +90°. Report the angle when available; border values deserve explicit wording.
Check lead II. II positive: approximately −30° to 0°, still normal adult axis. II negative: left-axis deviation beyond −30°.
Right-axis deviation. Assess right-heart disease, conduction, body habitus and electrode placement; axis alone does not diagnose PE.
Extreme superior axis. Consider ventricular origin, conduction, pacing, pre-excitation and technical causes.
Zero net projection does not mean a flat or electrically silent QRS: opposing portions of real ventricular activation may cancel in the net value.
Adenosine may be considered only in stable, regular, monomorphic WCT when the mechanism is uncertain. It is not a routine challenge for every wide rhythm. IV antiarrhythmic therapy or cardioversion depends on the clinical pathway and contraindications.
Irregular wide rhythms may be pre-excited AF; sustained polymorphic VT requires immediate shock. Neither belongs in a regular-WCT Brugada decision tree.
Record response without overinterpreting it: some idiopathic VTs terminate with adenosine, so termination alone does not prove SVT. Failure to terminate is also not a stand-alone VT test. A slower VT can occur below the familiar 150/min treatment-algorithm heuristic.
The patient must be stable and the rhythm regular and monomorphic, with monitoring and resuscitation capability. Exclude the irregular/pre-excited and polymorphic pathways; response alone does not determine the mechanism.
For a regular monomorphic wide-complex tachycardia after the immediate-treatment assessment. Practice the sequence using the criteria you can actually identify; this is not a patient diagnosis or a statement of clinical stability.
Step 1 of 4
An RS requires an R followed by an S. QS and qR do not qualify. If an RS exists in at least one precordial lead, answer No and continue.
Interactive controls require JavaScript. The complete source algorithm below remains available.
A technically uncertain finding is not a negative criterion. Any uncertain answer stops this walkthrough as indeterminate. An algorithm’s SVT classification does not exclude VT or authorize SVT treatment. The source definitions and limitations remain visible below.
Original schematics; not patient tracings. Time and voltage are illustrative unless a measurement is labeled.
The original 554-tachycardia study reported excellent performance; independent validation was less favorable. “Algorithm favors SVT” does not authorize unsafe SVT treatment when the clinical prior remains strongly ventricular.
The longest measurable precordial RS, 115 ms. That satisfies step 2; averaging the intervals would incorrectly erase a positive criterion.
Original schematics; not patient tracings. Time and voltage are illustrative unless a measurement is labeled.
In V1, a monophasic R, qR/QR, RS, or a double peak with the first peak taller favors ventricular origin. Typical aberrant RBBB more often has a small initial r, an S, then a larger terminal R′. In V6, a predominantly negative rS/QS and R:S <1 oppose the usual R-dominant lateral pattern.
Kindwall’s original clues: initial r >30 ms in V1/V2; QRS onset → S nadir >60 ms in V1/V2; a notch on the descending S limb; or any Q in V6. Typical aberrancy begins with brisk septal activation and a smooth, rapidly inscribed S.
Compare the right-precordial and lateral leads together. Measure R and S amplitudes from the same baseline; “R:S <1” means positive peak height smaller than negative depth, not a duration ratio. A deep q followed by R is a qR, not an rS.
Marriott/Sandler studied RBBB-type ectopic morphology; Wellens tested tachycardias against His-bundle recordings; Kindwall developed the LBBB criteria. These are morphology observations, not interchangeable point systems. QRS width and axis add context, but do not replace the lead-specific analysis or establish a mechanism alone.
Some idiopathic and conduction-system-related VTs can reproduce a typical-looking bundle pattern. Check other leads, A–V relationships and the clinical context; morphology overlap is documented.
For a regular monomorphic wide-complex tachycardia after the immediate-treatment assessment. Practice the sequence using the criteria you can actually identify; this is not a patient diagnosis or a statement of clinical stability.
Step 1 of 4
An initial dominant R, including R or Rs, is positive. A small r in rS or a terminal R after an initial q is not this criterion. If polarity is unclear, choose Uncertain.
Interactive controls require JavaScript. The complete source algorithm below remains available.
A technically uncertain finding is not a negative criterion. Any uncertain answer stops this walkthrough as indeterminate. An algorithm’s SVT classification does not exclude VT or authorize SVT treatment. The source definitions and limitations remain visible below.
Original schematics; not patient tracings. Time and voltage are illustrative unless a measurement is labeled.
Each step is evaluated only if preceding steps are negative. Initial positive forces and slow early activation favor a ventricular origin because ordinary supraventricular conduction usually activates ventricles rapidly through the specialized conduction system.
Small-amplitude aVR, noisy onset/offset, prior scar and pre-excitation limit interpretation. The original aVR study included 483 WCTs from 313 patients; subsequent independent testing did not reproduce uniformly high diagnostic performance. One lead simplifies acquisition, not uncertainty.
No. Step 1 concerns an initial R. An initial q followed by a tall R requires inspection of subsequent criteria; do not substitute net positivity or the terminal wave.
Original schematics; not patient tracings. Time and voltage are illustrative unless a measurement is labeled.
Early Purkinje recruitment can make VT’s initial forces rapid. Conversely, scar or drug-related slowing can make SVT’s initial forces slow. A mathematically clean ratio does not remove those biological exceptions.
No. A near-zero denominator amplifies measurement error. Record the ratio as unreliable and use the full tracing, other findings and clinical context.
Original schematics; not patient tracings. Time and voltage are illustrative unless a measurement is labeled.
Measure from QRS onset to the first change in direction of the initial deflection: an R peak, S nadir, or genuine early notch. It is not necessarily the tallest R, and it is not total QRS duration. At 25 mm/s, 50 ms is 1.25 small squares. The original 218-ECG EPS-confirmed study reported LR+ 34.8; the independent 2012 comparison found much weaker performance (sensitivity 60%, specificity 82.7%). A negative result cannot safely rule out VT.
| Finding | Points |
|---|---|
| Initial R in V1 | 1 |
| Initial r >40 ms in V1 or V2 | 1 |
| Notched S in V1 | 1 |
| Initial R in aVR | 1 |
| Lead II RWPT ≥50 ms | 1 |
| No RS in any V1–V6 lead | 1 |
| A–V dissociation, including true capture/fusion | 2 |
The range is 0–8. In the original 786-WCT study, ≥3 points had 99.6% specificity. A threshold ≥4 had 100% observed specificity, but only about one third of VTs reached it. Those are cohort findings, not guaranteed certainty. High specificity does not imply high sensitivity. Low scores do not exclude VT.
No. Absence of the scored findings is not absence of ventricular origin. Higher scores concentrate evidence for VT; low scores leave diagnostic uncertainty.
Accept an SVT-pattern classification only with typical BBB: RBBB requires rSR′ in V1 and RS in V6 with R taller than S; LBBB requires rS/QS in V1–V2, onset-to-S-nadir <70 ms, and R without Q in V6. Otherwise classify VT. Search independently for dissociated P waves even when BBB looks typical.
Lau and colleagues, including Griffith, selected ECG features by likelihood-ratio evidence and tested their Bayesian classifier on 244 EPS-adjudicated tracings. Its published feature definitions and weights are a specific method; the arithmetic example below is not its implementation.
Prior odds = 0.90 / 0.10 = 9
9 × 0.186 ≈ 1.67 posterior odds
1.67 / (1 + 1.67) ≈ 63% probability of VT
Original educational arithmetic pathway. An assumed prior and one external whole-algorithm LR are used, not a validated patient calculator.
For one diagnostic test: prior odds = p/(1−p); posterior odds = prior odds × LR; posterior probability = odds/(1+odds). The external 2012 Brugada sensitivity 0.890 and specificity 0.592 imply LR− = (1−0.890)/0.592 ≈0.186. At an assumed 90% prior, a negative classification still leaves about 63% probability; at 50% prior, about 16%.
Name provenance: Swanick/LaCamera/Marriott (1972) concerns right-ventricular ectopic morphology, not a Bayesian WCT classifier.
Post-test probability depends on the starting probability and the test’s likelihood ratio. With high prior odds and imperfect sensitivity, one negative algorithm may reduce concern without removing it.
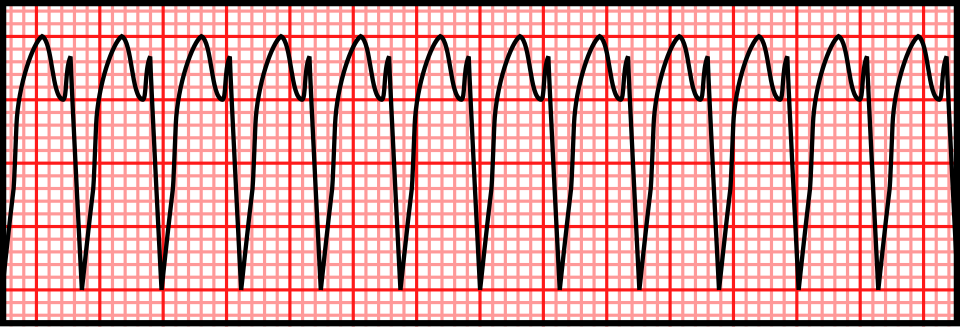
Left: original conceptual timing diagram, CC BY 4.0 or MIT. Right: Rocuronium Bromide, Wikimedia Commons · CC0 1.0. Unchanged PNG rendering of the source vector. Teaching illustration, not a patient recording.
Stable regular WCT; clear RS in V3; longest onset-to-S-nadir 120 ms. Brugada stops at step 2 and favors VT. A normal-looking V1 does not veto that result. Recheck the measurement, compare baseline ECG, and follow the appropriate WCT treatment pathway.
Young adult, regular RBBB-like WCT with a superior axis and brisk initial forces. Typical rsR′ or an aVR ratio >1 does not exclude fascicular VT. Document the discordant clues and obtain expert review rather than selecting whichever algorithm says SVT.
Very rapid irregular WCT with changing QRS width and shape: suspect pre-excited AF among the differential. Stop regular-WCT scoring. Avoid A–V nodal blockade; manage the rhythm and hemodynamics urgently. A regular pre-excited tachycardia can also mimic slow ventricular activation and produce false-positive VT criteria.
In the 260-WCT head-to-head study, reference diagnoses came from EPS (216), device electrograms (38) and serial ECGs (6). Brugada accuracy was 77.5%; RWPT-II accuracy 68.8%. These data argue against treating derivation accuracy as universal or averaging algorithm outputs into a new diagnosis.
Report example: “Regular monomorphic WCT. VT favored by prolonged precordial RS interval; atrial activity indeterminate. Baseline tracing unavailable. Manage as uncertain/likely ventricular WCT pending expert assessment.” Separate what was measured from what was inferred.
State the observed measurements, the algorithm classifications and the remaining uncertainty. Do not manufacture consensus probabilities; use a management pathway safe for possible VT and seek expert assessment.
For stable sinus rhythm, use several representative beats. In AF, do not cherry-pick a single short or long cycle: a multiple-beat average better matched subsequent sinus-rhythm measurements in a comparative study. No universal AF measurement/correction method is established; document the averaging approach and residual uncertainty.
Report the measured QT, the lead and endpoint method, and any unresolved T–U ambiguity. QU is not interchangeable with QT.
QTcB = QT / √RR
Usually inflates QTc during tachycardia and can undercorrect at slow rates.
QTcF = QT / ∛RR
Often has less rate dependence; it is still a population correction, not an individual truth.
Use RR in seconds. QT may remain in milliseconds, giving QTc in milliseconds. State the method; a machine’s “QTc” without its formula is incomplete information.
| Arithmetic exercise, not a patient | QTcB | QTcF |
|---|---|---|
| QT 400 ms; RR 0.60 s (100/min) | 516 ms | 474 ms |
| QT 480 ms; RR 1.50 s (40/min) | 392 ms | 419 ms |
| QT 440 ms; RR 1.00 s (60/min) | 440 ms | 440 ms |
In a large observational study, Fridericia reduced rate dependence relative to Bazett in recordings without conduction defects or ventricular pacing. This supports deliberate formula choice, not switching formulas until a desired threshold is crossed.
The square-root and cube-root corrections diverge at fast rates. Recheck the measurement and clinical context; neither number alone proves or excludes a dangerous repolarization disorder.
A bundle-branch block lengthens ventricular activation and therefore QT. A conventional narrow-QRS QTc cutoff cannot simply identify how much of that increase is abnormal recovery. Report rhythm, QRS width, raw QT, rate and the chosen adjustment.
QT 520 ms; QRS 160 ms → JT 360 ms; QTm 440 ms. At RR 1.00 s, Bazett and Fridericia leave QTm at 440 ms. This illustrates decomposition; it is not an assurance of drug safety.
No universal JTc threshold is supplied here. A borderline estimate with syncope, T–U distortion or ventricular ectopy needs expert interpretation rather than a second decimal place.
80 ms, half of the full QRS duration, before rate correction. Its limited validation does not make the result a universal torsades-risk cutoff.
Magnesium is used even when its serum value is normal. Prevent recurrent bradycardia/pauses; address the cause.
Do not automatically call it torsades. Acute ischemia and other mechanisms require a different evaluation.
Drug decisions also depend on the agent and clinical benefit: follow its specific monitoring protocol. Rate acceleration with drugs is not a generic maneuver for congenital LQTS; obtain expert help. A prior “normal” ECG does not eliminate an acquired multi-hit risk.
It is a warning pattern for pause-dependent torsades in the appropriate long-QT setting, prompting urgent cause reversal and monitored escalation before sustained arrhythmia.
| Finding | Points |
|---|---|
| Resting QTc ≥480 / 460–479 / male 450–459 ms | 3.5 / 2 / 1 |
| QTc ≥480 ms at fourth minute of recovery | 1 |
| Torsades / T-wave alternans / notches in 3 leads | 2 / 1 / 1 |
| Low heart rate for age | 0.5 |
| Syncope with stress / without stress | 2 / 1 |
| Definite family LQTS / unexplained first-degree SCD <30 | 1 / 0.5 |
| Pathogenic mutation | 3.5 |
A low or borderline resting QTc does not exclude concealed familial LQTS. Conversely, a borderline machine value without corroborating evidence is not sufficient to attach a lifelong inherited diagnosis.
No. Reduced penetrance can conceal the resting ECG phenotype; targeted family/genetic assessment is needed.
Original schematics; not patient tracings or calibrated waveforms · CC BY 4.0.
Broad-based, prolonged T waves can accompany KCNQ1-related disease.
Low-amplitude or bifid/notched T waves can accompany KCNH2-related disease.
A long relatively isoelectric ST interval followed by a late T can accompany SCN5A-related disease.
These are group associations from genotype–phenotype studies. There is substantial overlap and variation across leads, rate and serial ECGs. Morphology can direct scrutiny and family evaluation; it cannot establish a genotype or choose a genotype-specific treatment on its own. Normal-looking T waves do not exclude a pathogenic variant.
No. It is an associated morphology with overlap; diagnosis and genotype require the complete clinical and genetic evaluation.
Original schematics; not patient tracings or calibrated waveforms · CC BY 4.0.
J-point/ST elevation ≥2 mm (0.2 mV at standard gain) with a coved descending ST segment followed by a negative T wave in at least one of V1 or V2, recorded in the second, third or fourth intercostal space. Confirm the J point at QRS end; the 2025 provocation criteria require the pattern in at least two beats.
A saddleback right-precordial ST configuration is suggestive but not diagnostic of Brugada syndrome. Benign rSr′ variants and lead-position effects can resemble it.
Risk assessment depends on documented ventricular arrhythmia, probable arrhythmic syncope, spontaneous versus induced pattern and the broader evaluation. The drawing is a contour lesson, not a calibrated diagnostic tracing.
No. Type 2 is nondiagnostic; verify lead placement, alternatives and clinical context, then obtain specialist assessment when indicated.
V1: fourth intercostal space, right sternal border.
V2: fourth intercostal space, left sternal border.
Record V1/V2 additionally at the third and/or second intercostal spaces to sample the right ventricular outflow tract region. Label every position.
Review possible Brugada-provoking drugs with a reliable, current specialist resource; do not use this chapter as a drug list. A fever- or drug-associated pattern should be reported with its trigger and expert interpretation. “It disappeared” describes a dynamic phenotype; it does not by itself prove a harmless phenocopy or establish an inherited syndrome.
Second/third-space placement intentionally changes the sampled region. Without labeling, it can be mistaken for a standard recording or an acquisition error and mislead serial interpretation.
This published case pairs an initial ECG during fever with a repeat after fever resolved. The authors described a type 1-like pattern in V1 on the first recording. These are original clinical images, not generated or redrawn signals.
Overview only: open each unchanged image to inspect the right-precordial contour and calibration at full resolution.
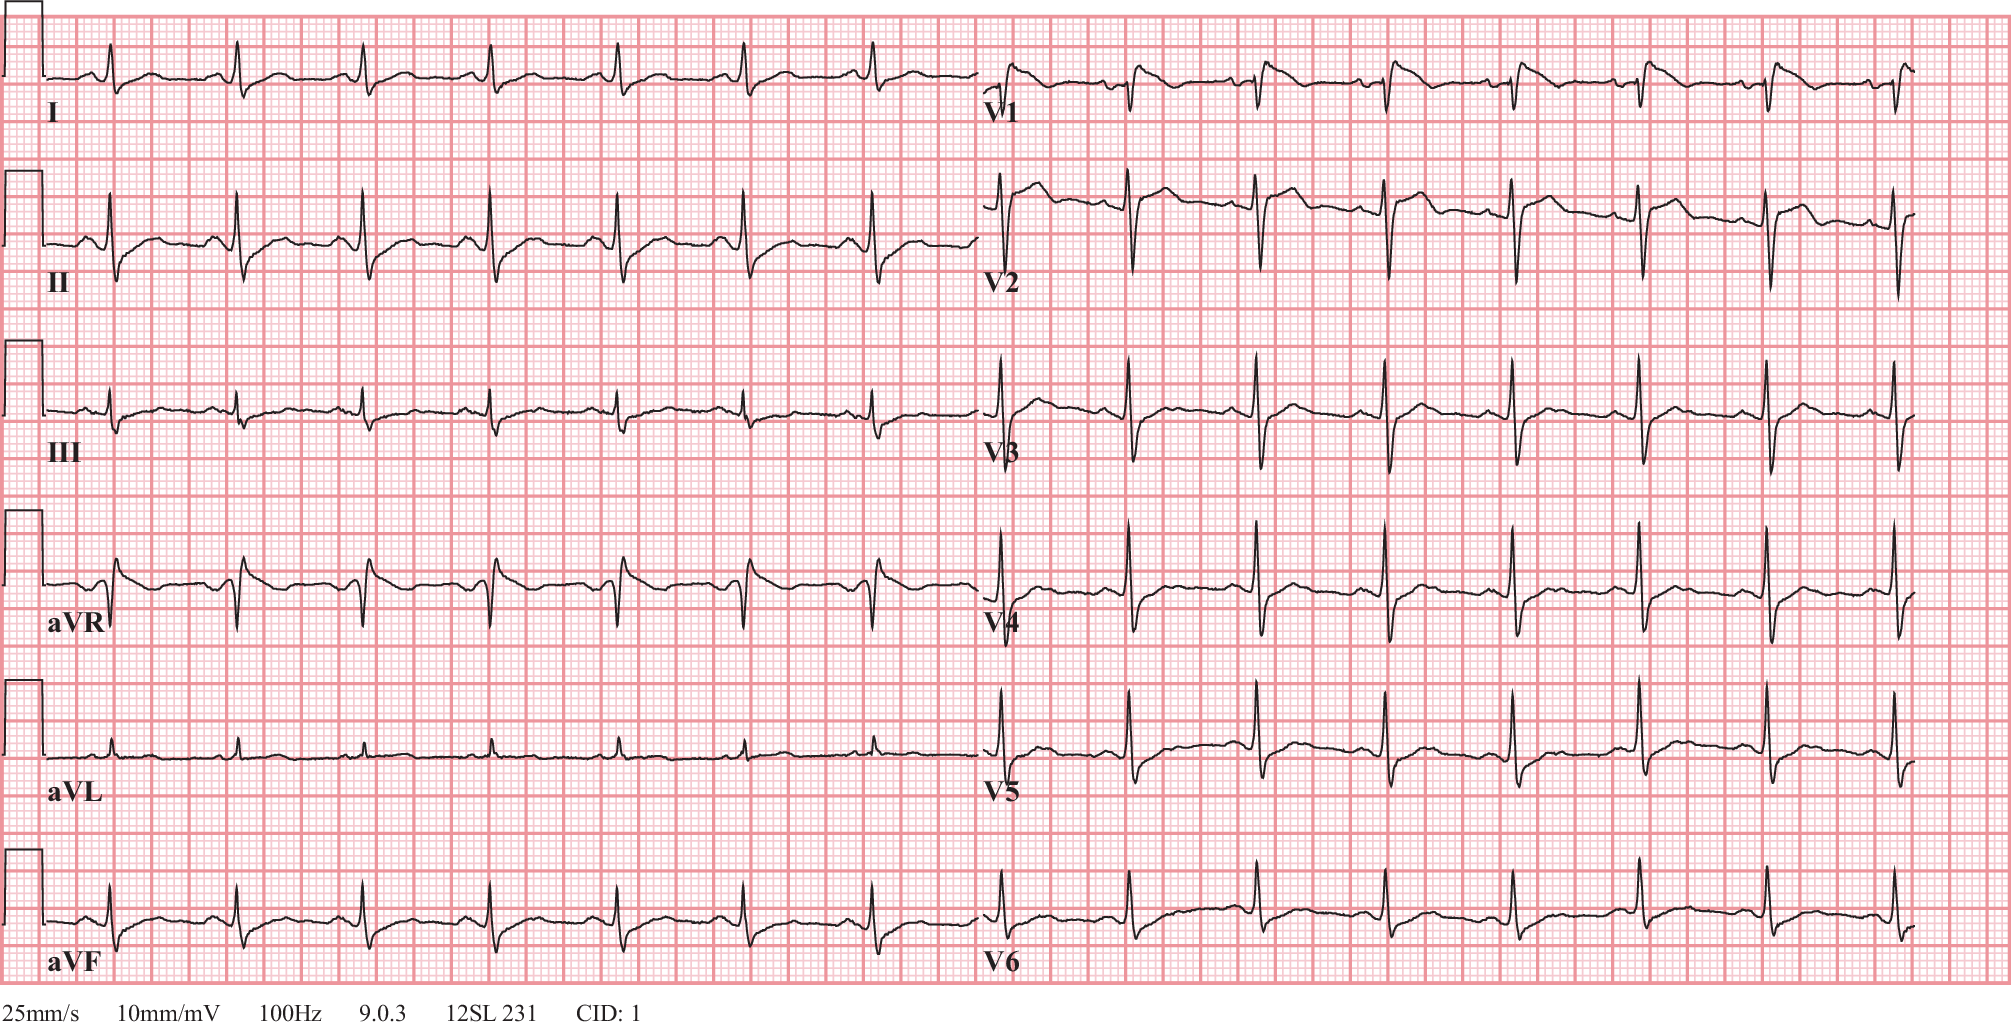
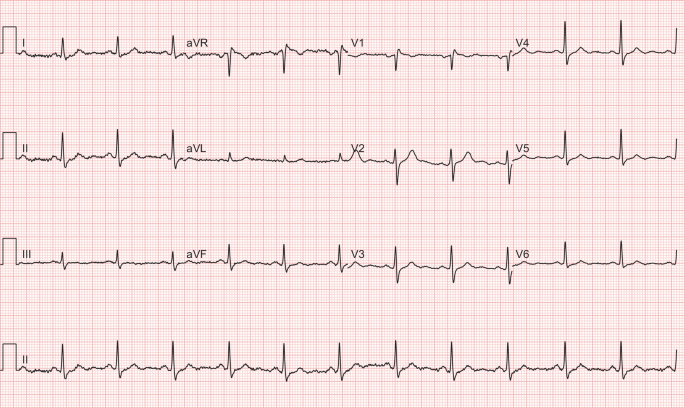
It demonstrates the reported fever-associated ECG change and subsequent resolution. It cannot establish an unpublished genotype, long-term outcome or universal risk rule.
S in V1 + larger R in V5 or V6 ≥35 mm at 10 mm/mV.
R in aVL + S in V3 >28 mm in men or >20 mm in women at 10 mm/mV.
Voltage criteria are insensitive and depend on age, body habitus, sex, ancestry and lead placement. Thin or athletic people can have large voltages; obesity or emphysema can attenuate them. Bundle block, pacing and scar complicate standard criteria. “Strain” is a conventional ECG description, not a measurement of myocardial deformation. A broad/notched P in II or prominent terminal negative P component in V1 suggests left atrial abnormality; tall inferior P waves suggest right atrial abnormality. Confirm chamber size by imaging rather than equating electrical criteria with enlargement.
40 mm at 10 mm/mV, equivalent to 4 mV. This exceeds the Sokolow–Lyon threshold but is not an anatomical diagnosis by itself.
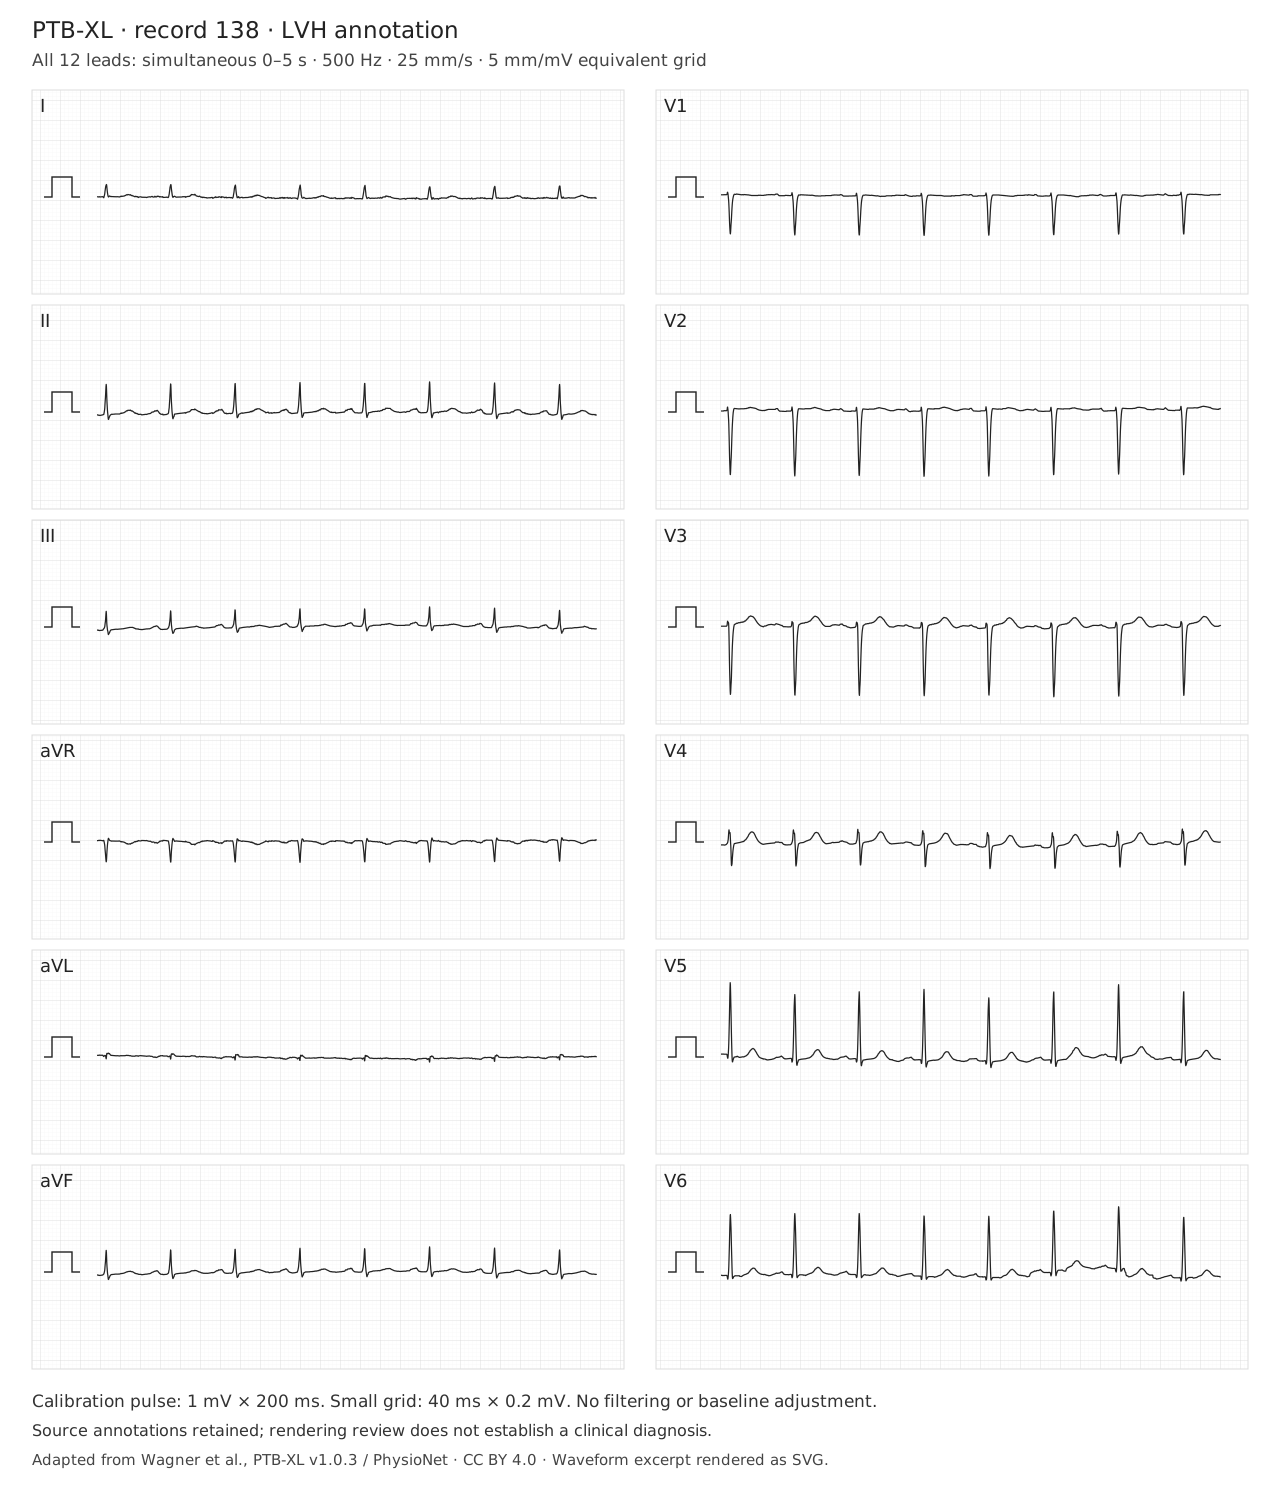
This record is shown at half standard gain. Double measured millimeters before comparing with thresholds stated at 10 mm/mV, or work directly in mV. Inspect lateral ST–T morphology and the atrial waveform separately. The dataset annotation does not establish the anatomical cause, exclude ischemia, or require every voltage criterion to be positive.
The displayed gain is 5 mm/mV. A measured sum of 17.5 mm corresponds to 3.5 mV, or 35 mm at standard 10 mm/mV gain. Apply the threshold only after checking calibration and measuring the correct deflections.
Right axis, a dominant R in V1 and persistent lateral S waves may support RVH in context. Dominant R in V1 also has other causes.
New right-precordial T inversion, RBBB or S1Q3T3 can accompany acute PE, but are neither required nor diagnostic.
In a community population without clinical cardiovascular disease, the MESA-RV study found ECG criteria unsuitable for screening mild RVH. Performance in selected congenital or pulmonary-hypertension populations cannot be transplanted to an incidental ECG. The source-annotated RVH record in the next case is a comparison exercise, not proof that every voltage criterion must be present.
No. Clinical probability and the recommended diagnostic pathway govern PE assessment; ECG is complementary.
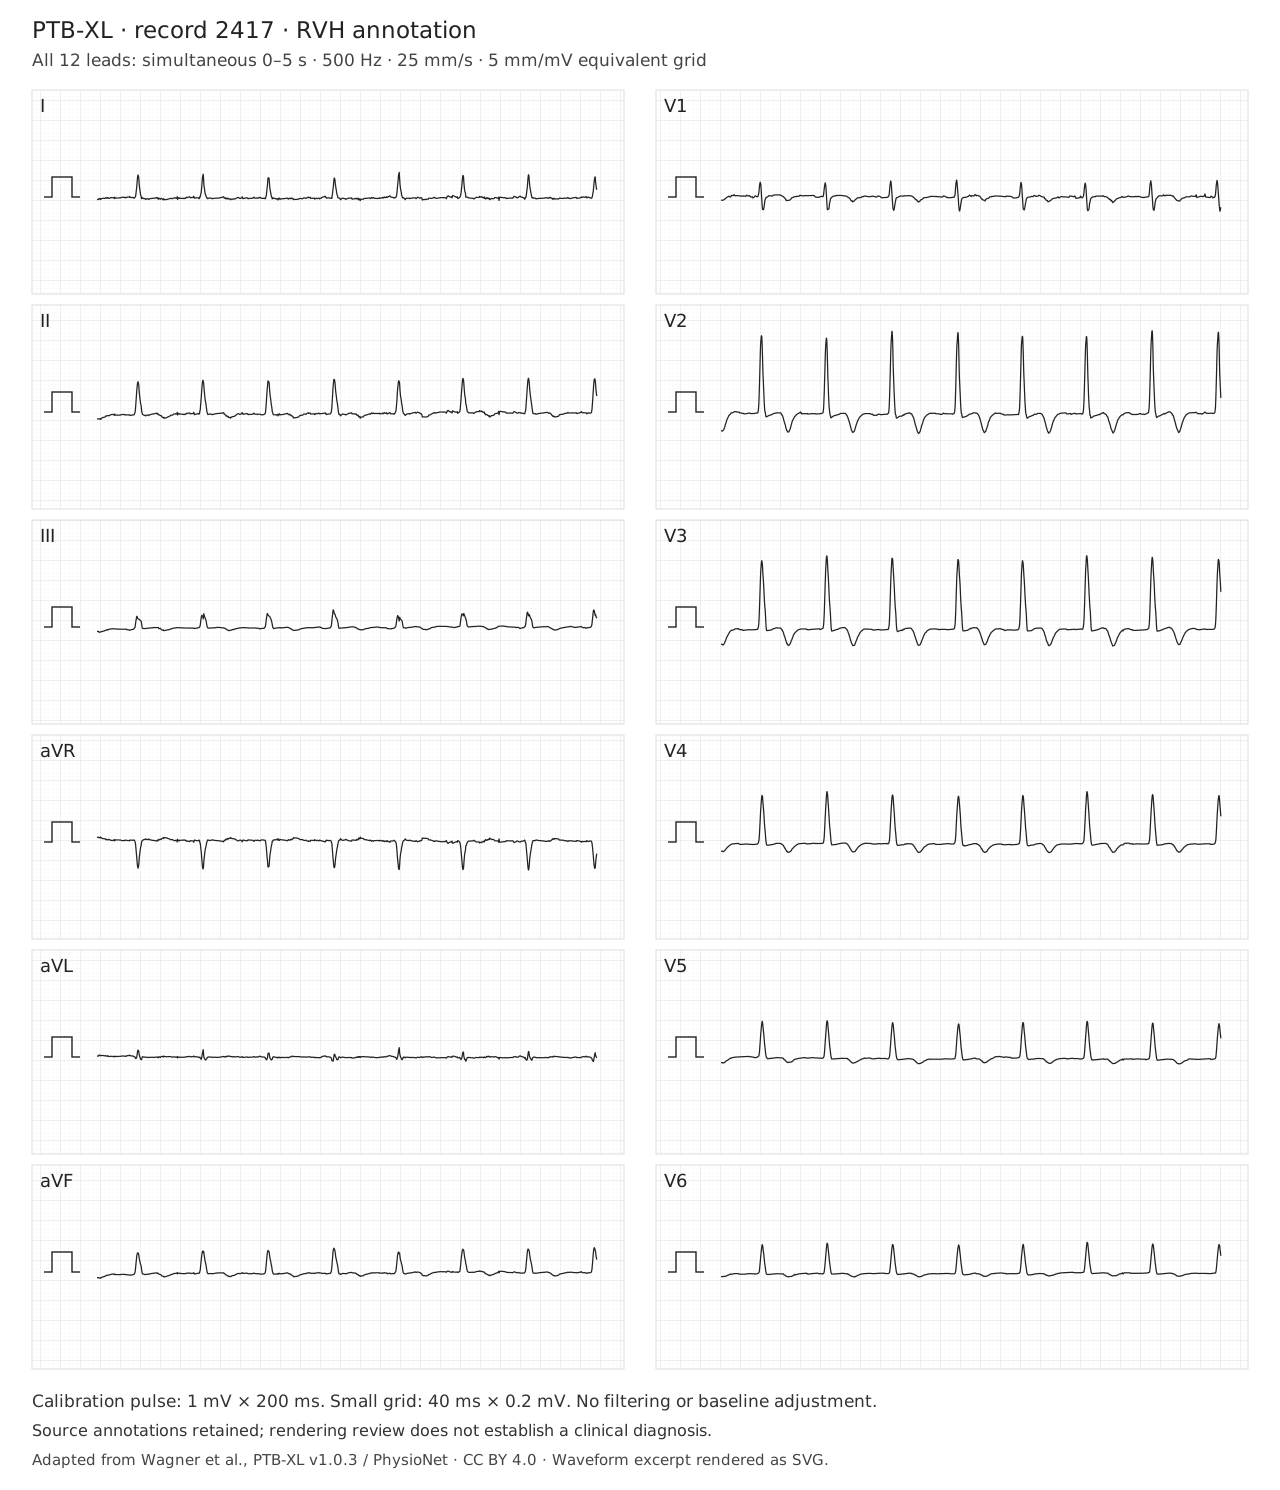
The displayed gain is 5 mm/mV; use the calibration pulse for amplitude measurements. The RVH label is a dataset annotation, not independent confirmation of RV size or pressure. A dominant R in V1 has competing explanations. Compare a prior ECG and correlate clinical context and imaging. This tracing cannot establish acute pulmonary embolism or safely exclude it.
No. The source annotation describes a dataset label. Describe the ECG findings, assess time course and clinical probability, and use indicated testing. Neither RVH voltage criteria nor their absence diagnose or exclude acute PE.
Crochetage describes notching near the ascent or apex of the R wave in inferior leads II, III and aVF. Its classic association is secundum atrial septal defect. Do not use the term interchangeably with terminal R′ in V1 or with every fragmented QRS pattern.
Heller and colleagues compared 1,560 people across several structural diagnoses and controls. Crochetage occurred in 73.1% of the secundum-ASD group, but also in other groups. Presence in all three inferior leads was more specific in that study. These selected-population results are not a universal screening probability.
Secundum ASD. It is not a specific generic marker of acute RV strain, and imaging is needed to establish anatomy.
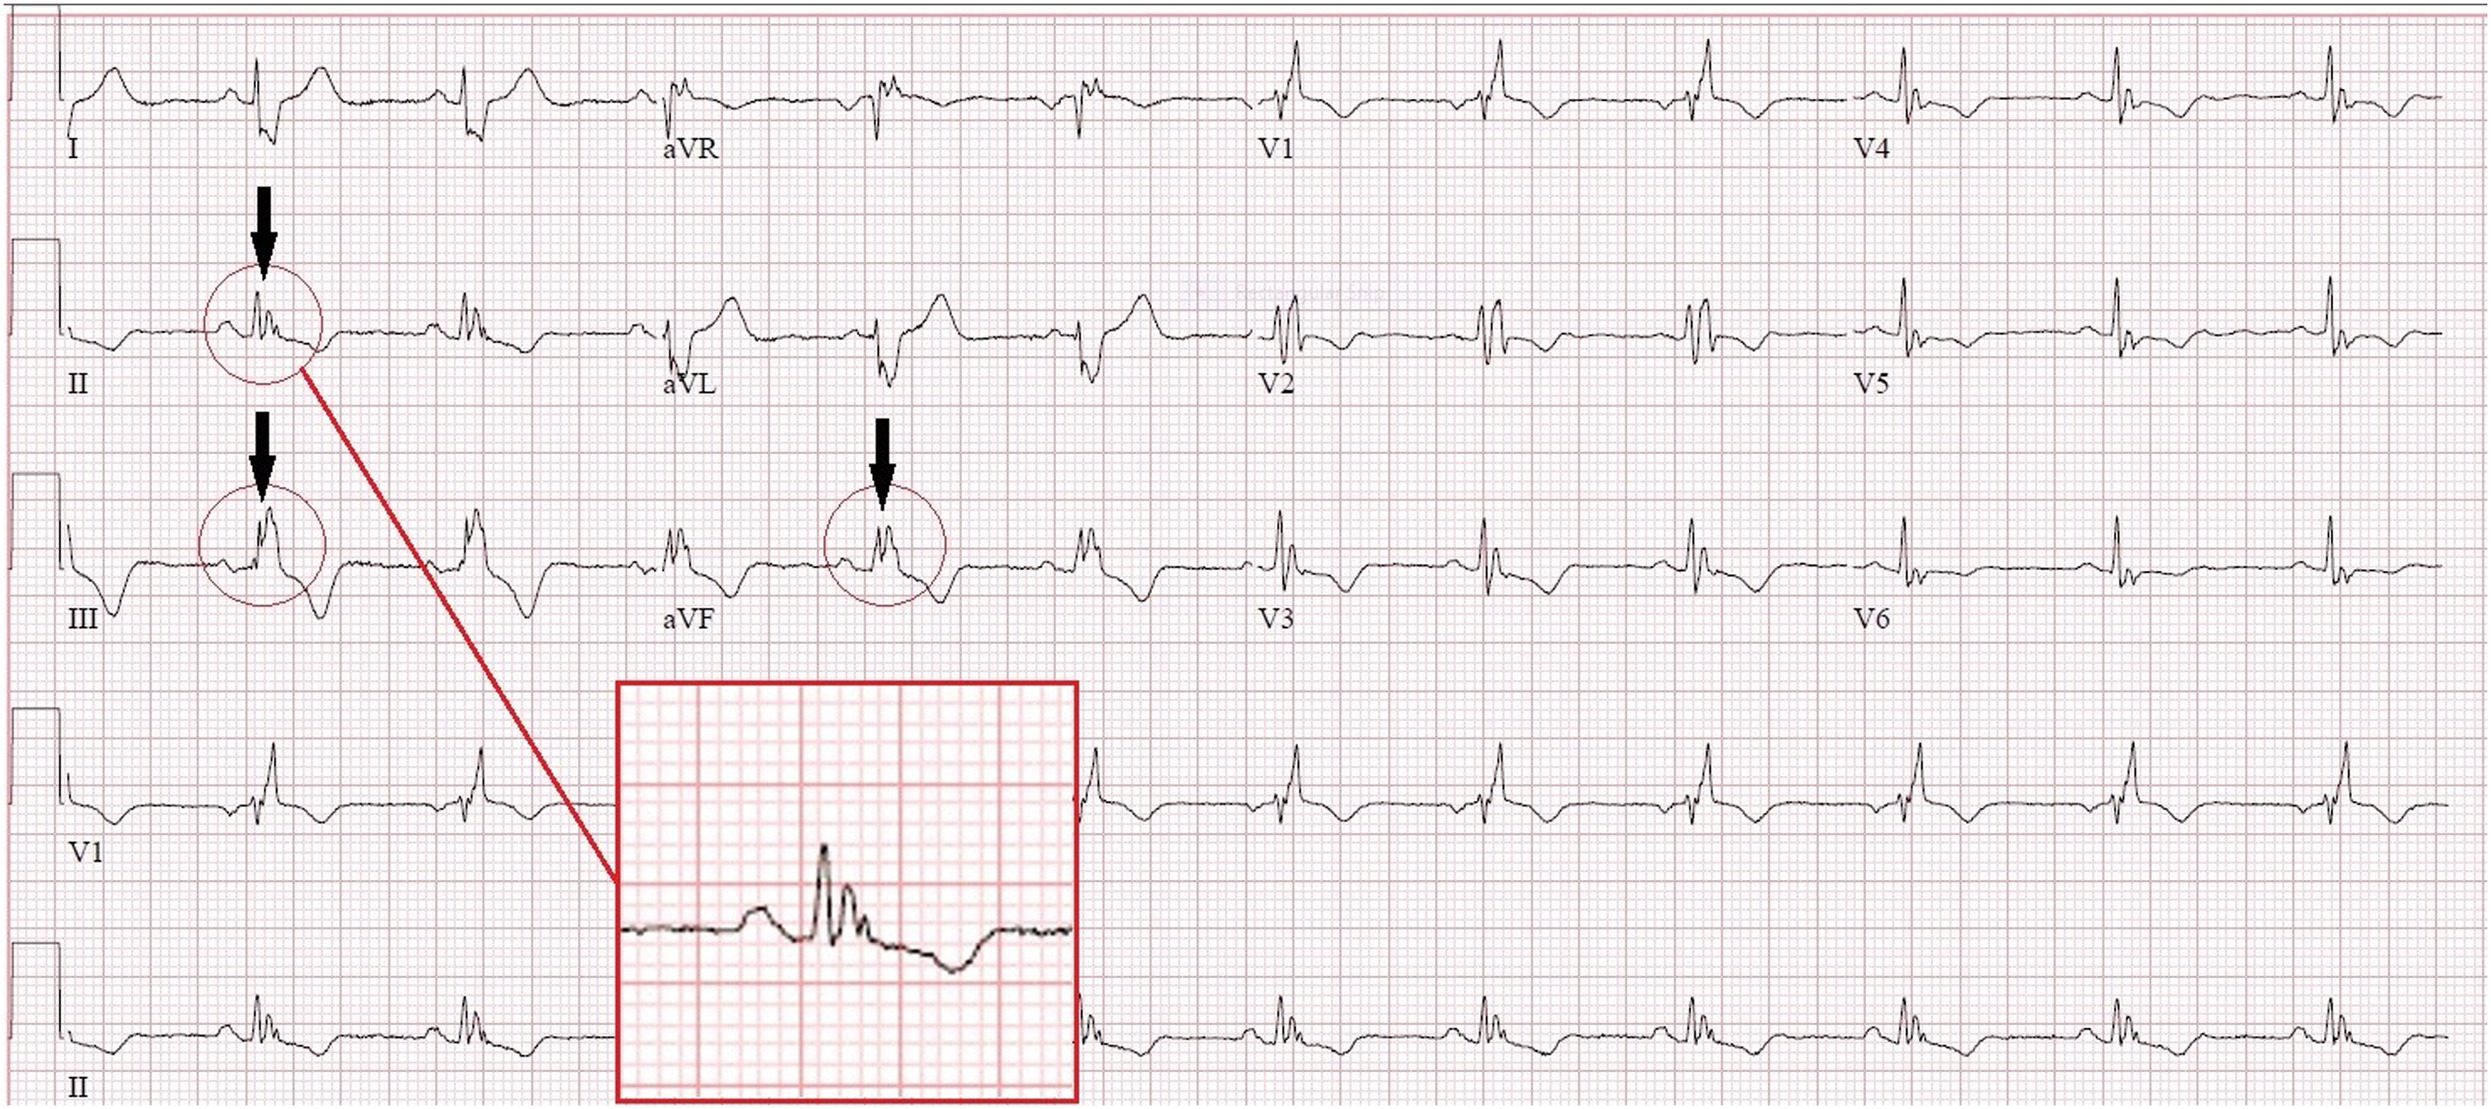
Use the authors’ magnified inset and compare the inferior leads. The sign is a notch near the R-wave summit, not simply any terminal R′.
Crochetage is associated with secundum atrial septal defect. It is not a generic marker of RV strain or a diagnostic criterion for PE.
This published case shows the morphology. The diagnostic-performance evidence comes from the separate Heller cohort cited in the preceding chapter.
It illustrates the characteristic morphology in one source case. It does not establish sensitivity, specificity, shunt size or an anatomical diagnosis in a different patient.
Investigate an infiltrative process when the combined findings warrant it.
Conventional low-voltage thresholds are QRS peak-to-peak amplitudes ≤5 mm in every limb lead or ≤10 mm in every precordial lead at 10 mm/mV. State which distribution is involved; one small lead does not meet a global criterion. First exclude reduced gain, poor contact and acquisition differences.
Normal or high QRS voltage does not exclude cardiac amyloidosis; the classic voltage–thickness mismatch is absent in many affected patients. Low voltage also cannot distinguish AL from ATTR. A positive bone-tracer scan should not be interpreted as ATTR without the required monoclonal-protein assessment.
No. Relative voltage–wall-thickness discordance and the broader phenotype matter; normal voltage does not exclude disease.
Conventional RV pacing often resembles LBBB, but pacing site, conduction-system capture, biventricular pacing and fusion can produce other morphologies. A relatively narrow QRS does not exclude pacing. Bipolar pacing spikes may be very small or filtered out; absence of a printed spike is not proof of absent output.
CRT may deliberately exploit fusion with intrinsic conduction. Therefore an intermediate QRS shape is not automatically malfunction. Conversely, a pacing spike that falls in refractory tissue does not demonstrate successful capture simply because a QRS is nearby. Verify the interval and morphology.
No. Conduction-system pacing, fusion and some resynchronization configurations can produce relatively narrow complexes.
The observed interference frequency reflects rotation, not ventricular rate.
A 40-Hz low-pass view retains less bandwidth and may clarify rhythm while removing important QRS detail.
LVAD electromagnetic interference can obscure P waves, QRS boundaries and the baseline. Evaluate the patient and circulation immediately if unstable; neither apparent artifact nor a weak/absent palpable pulse establishes the rhythm in continuous-flow support.
In a nine-patient study, HeartMate 3 at 5700 rpm produced a dominant 95-Hz artifact; model-specific spectra included additional peaks. Legacy HeartWare examples showed a dominant component near twice the rotational frequency. These observations explain interference; they are not validated noninvasive pump diagnostics.
A 2024 electrode-placement study abstract found no alternative configuration that consistently reduced noise. Do not promise that a particular limb site, side of the body or manufacturer-specific arrangement will solve interference. If nonstandard placement is necessary, label it and avoid direct voltage/axis comparison with standard ECGs.
No. Optimize acquisition and documented ECG filtering, retain diagnostic bandwidth and involve the VAD team. Pump therapy is not an ECG acquisition control.
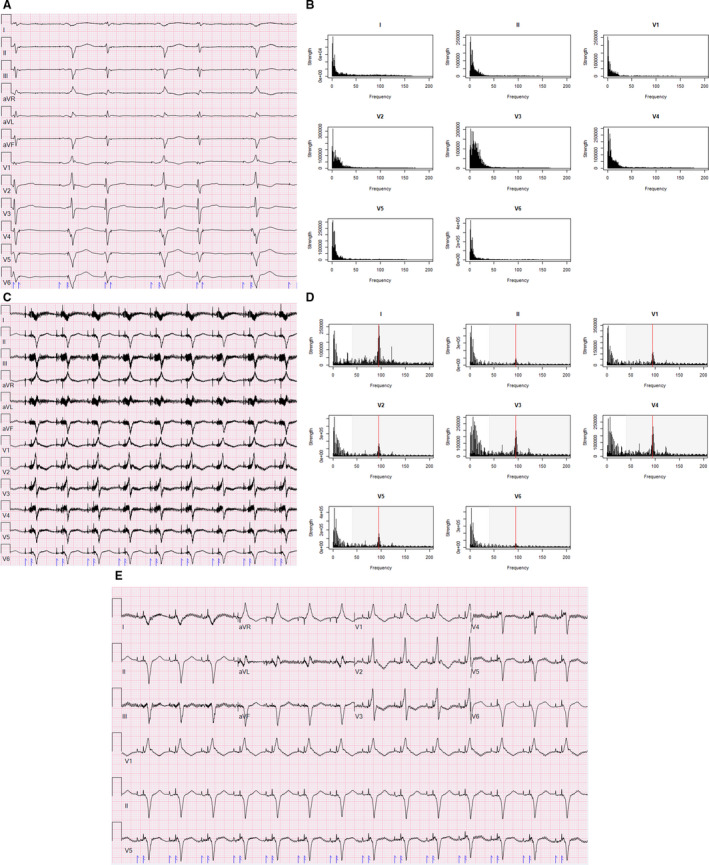
No. Preserve the standard-bandwidth recording and document filtering. The source figure demonstrates a tradeoff in one case; it does not validate every interval or morphology measurement after filtering.
II, III, aVF
Look for reciprocal change in I/aVL. If RV involvement is suspected, add right-sided leads.
V1–V4
Check the distribution, evolution and R-wave progression; repeat misplaced V1/V2 before inferring a fixed scar.
I, aVL, V5–V6
Interpret alongside inferior and precordial reciprocal findings.
V1–V3 depression + upright T / dominant R
Obtain V7–V9 when posterior occlusion is suspected.
Check gain and QRS morphology, then inspect contiguous leads. New ST elevation in two contiguous leads supports a STEMI pattern when appropriate clinical context and exclusions are met.
Usually ≥1 mm; in V2–V3, ≥2 mm in men ≥40 years, ≥2.5 mm in younger men, and ≥1.5 mm in women. These standard thresholds assume no confounding LVH or bundle-branch block.
Persistent ischemic symptoms, shock, dynamic changes or an occlusion-equivalent pattern warrant urgent expert assessment even without classic thresholds.
Additional posterior leads and prompt clinical reassessment for coronary occlusion, rather than treating every ST-depression pattern as the same risk category.
Original teaching schematics, not patient recordings. CC BY 4.0 or MIT. Timing and voltage are illustrative unless explicitly labeled.
ST elevation ≥1 mm in a lead whose QRS is predominantly positive.
ST depression ≥1 mm in V1, V2 or V3.
In a negative-QRS lead: J-point elevation ≥1 mm and at least 25% of the preceding S-wave depth.
The original Sgarbossa rule scores concordant elevation 5 points, concordant V1–V3 depression 3, and discordant elevation ≥5 mm 2; a total ≥3 is positive. Do not mix the original score with the modified proportional rule.
Yes: 3/8 = 0.375, above 0.25, and ST elevation is at least 1 mm. This is a positive modified criterion in a negative-QRS lead, interpreted within the clinical presentation.
Original teaching schematics, not patient recordings. CC BY 4.0 or MIT. Timing and voltage are illustrative unless explicitly labeled.
Precordial upsloping J-point ST depression with tall, symmetric T waves in a patient with ischemic symptoms. The original series linked this to proximal LAD occlusion; do not treat the artery location as guaranteed in every case. With an acute ischemic presentation, obtain emergency coronary/reperfusion evaluation for immediate angiography.
Recent angina with biphasic or deep symmetric anterior T-wave inversion, often when pain has resolved, without the expected Q-wave evolution. This is a high-risk presentation needing urgent cardiology assessment; avoid provoking ischemia with routine stress testing.
Broad, regional T waves with reciprocal/evolving changes favor ischemia; narrow peaked T waves may suggest potassium effects. Neither visual shortcut replaces symptoms, serial ECGs and laboratory assessment.
Think widespread subendocardial ischemia or supply–demand imbalance. It does not uniquely identify acute left-main occlusion.
No. Interpret the preceding symptoms and ECG evolution. A Wellens-type clinical presentation remains high risk even between episodes.
The syndrome requires clinical context and exclusion of important mimics. A T-wave shape alone cannot establish the coronary anatomy or urgency for every patient.
A short PR, delta wave and widened QRS support manifest ventricular pre-excitation. Fusion can make the pattern subtle; compare multiple leads and prior ECGs.
A very fast, irregular wide-complex rhythm with changing QRS appearance may represent pre-excited AF. AV-nodal blocking drugs can be harmful; use urgent rhythm-specific management.
Initial delta-wave polarity, lead placement and the intended study population matter. A concealed pathway with no antegrade pre-excitation cannot be localized by a delta-wave algorithm.
Mean QRS axis and initial delta-wave activation are different information. Fusion and anatomy prevent an unsupported one-angle-to-one-location mapping.
Overview: open the full-resolution tracing to inspect intervals and morphology.
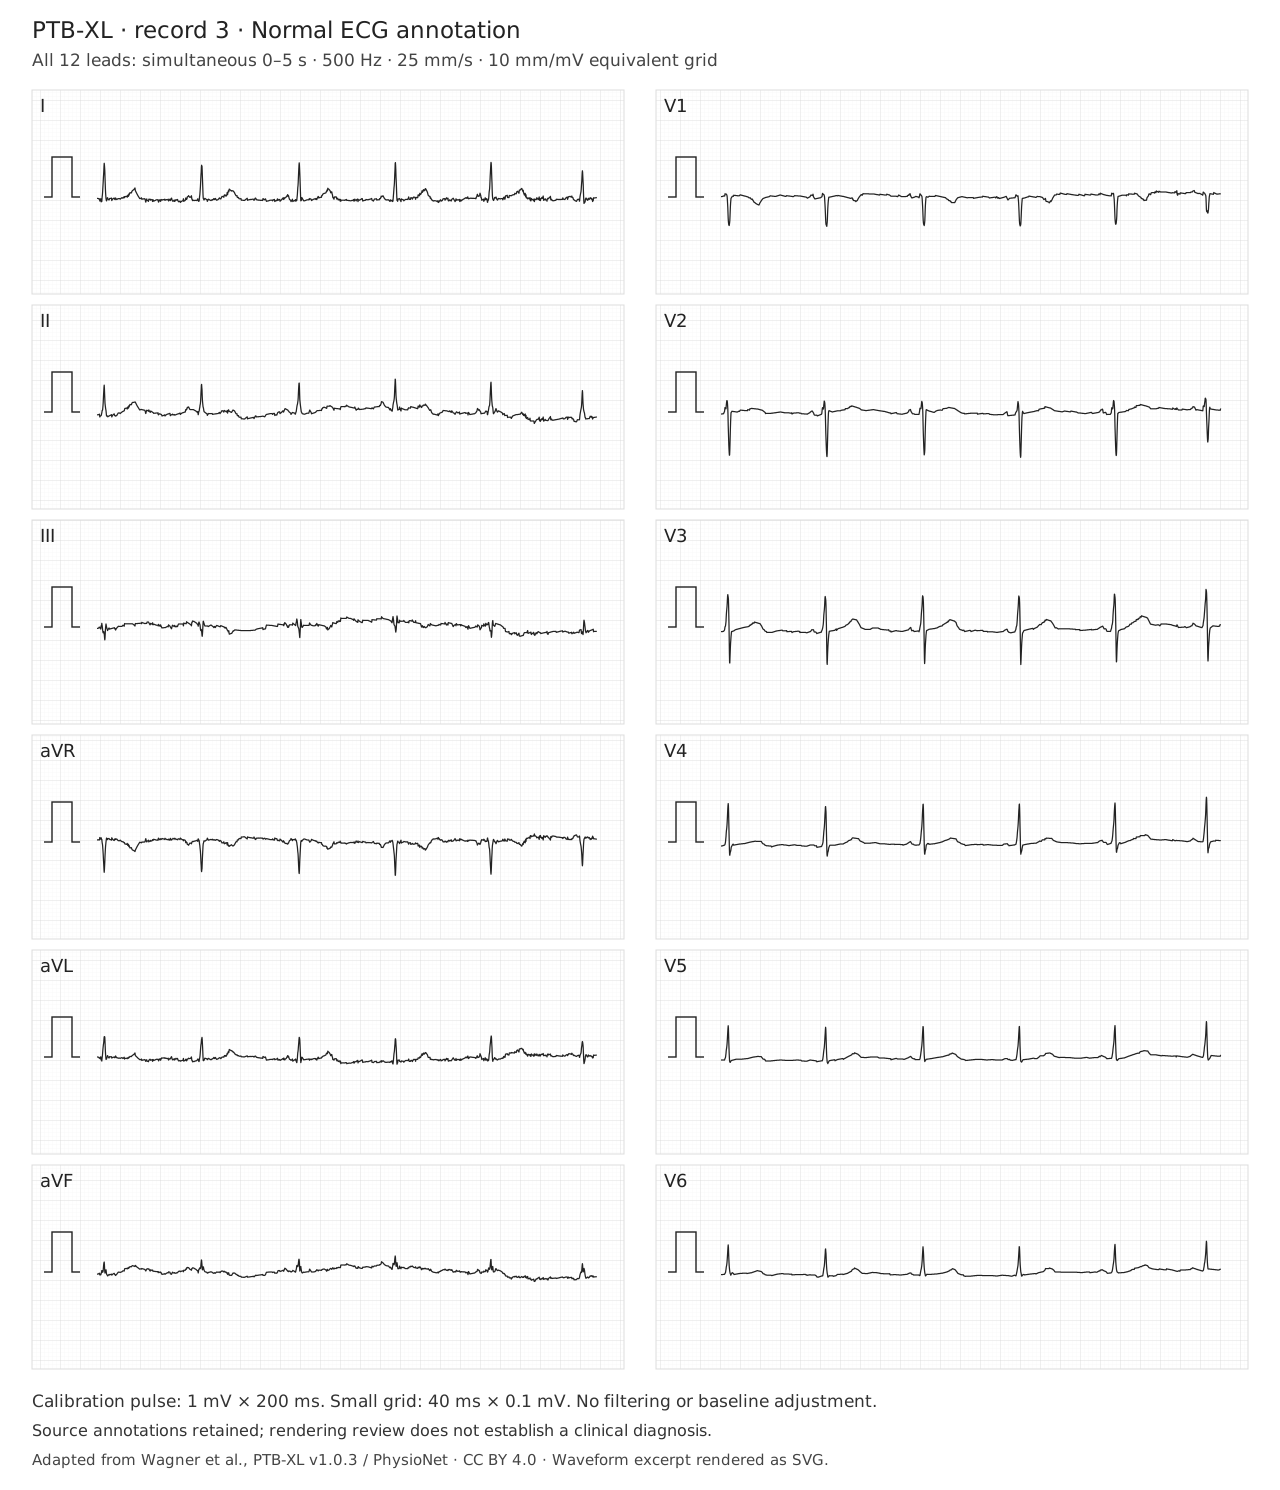
The dataset labels this record NORM (normal ECG) and SR. That is source metadata, not an independently adjudicated diagnosis or a statement that coronary disease is absent. Confirm the recording quality, atrial relationship, QRS width, axis and ST–T findings yourself.
The recording supports independent inspection. The annotation provides dataset context, but must not substitute for reading the signal or establishing a clinical diagnosis.
Overview: open the full-resolution tracing to inspect intervals and morphology.
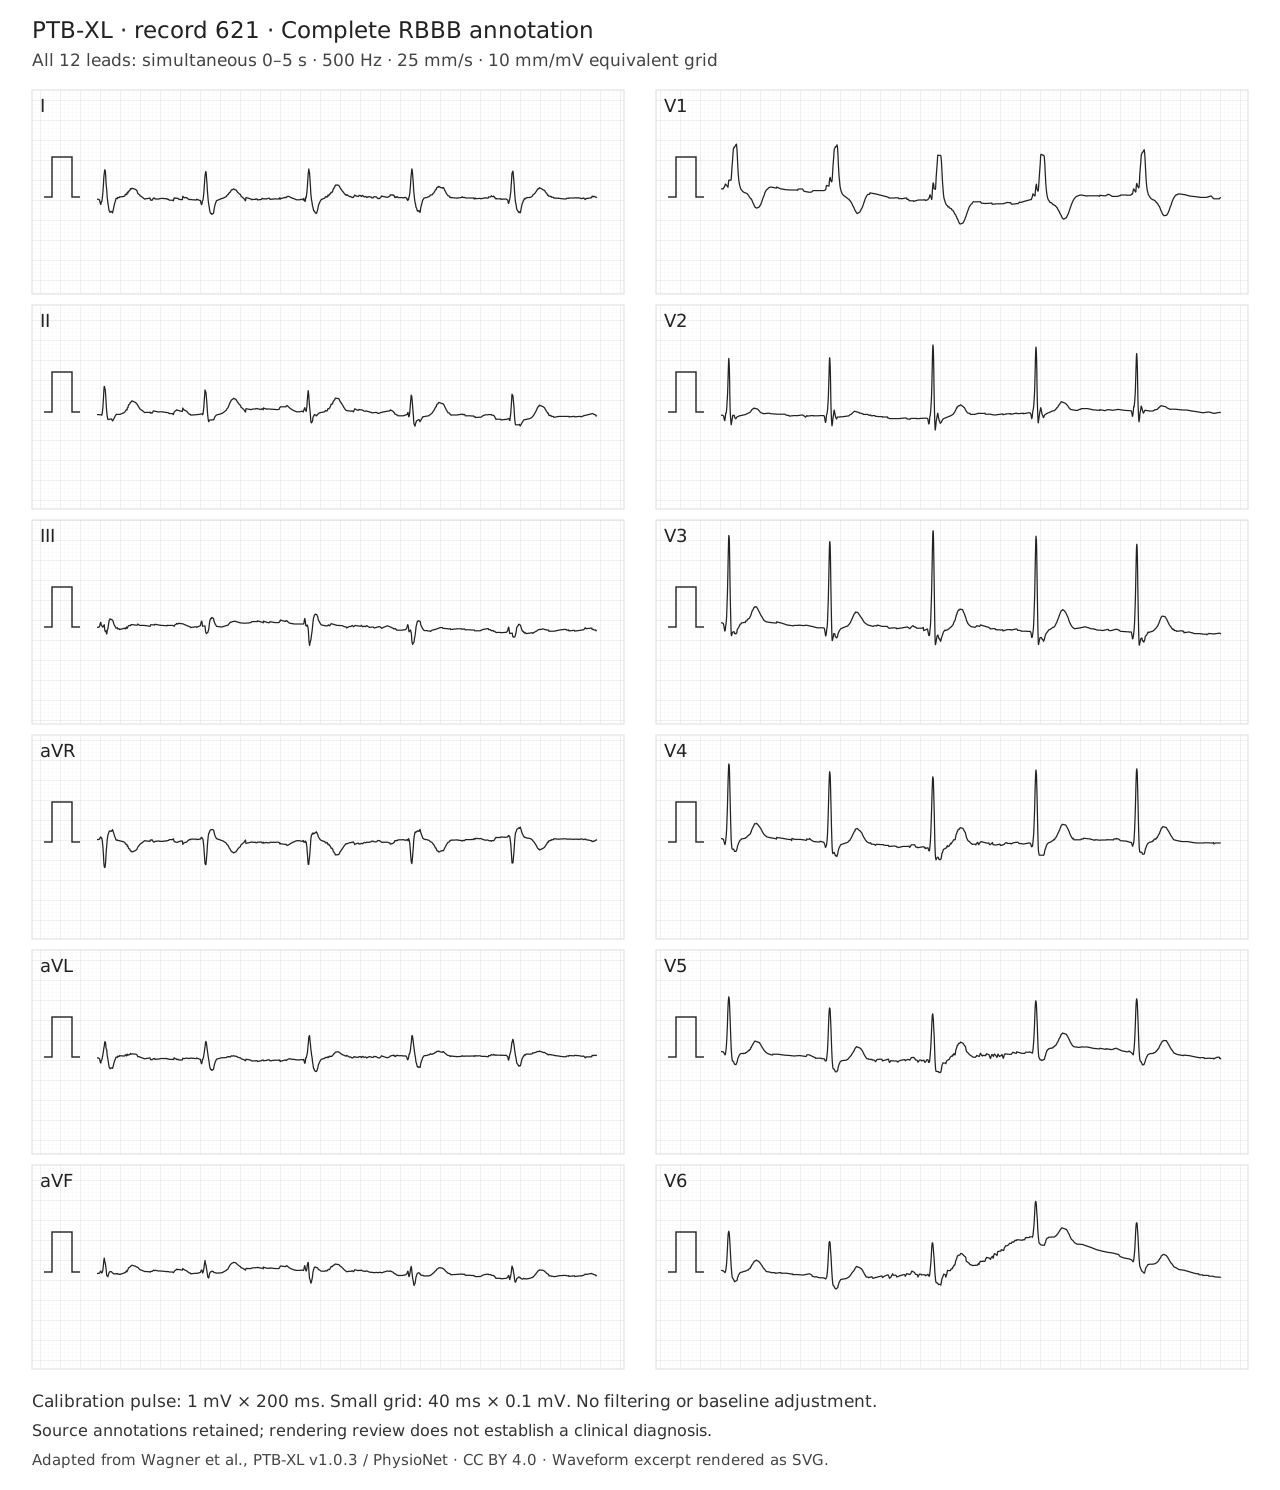
The source label is CRBBB (complete RBBB), with SR. Verify adult QRS duration ≥120 ms, the right-precordial terminal R′ pattern, and a broad terminal S in I/V6. No isolated notch establishes complete RBBB. Baseline wander in V6 is retained. The bundle pattern does not establish a cause of conduction disease, a pacing indication or the mechanism of a future tachycardia.
No. Compare actual morphology, initial activation, AV relationships and the clinical prior. A negative algorithm can leave substantial VT probability; baseline RBBB is not a rule-out test.
“Normal ECG.”
“LVH.”
“Algorithm says SVT.”
“QTc long.”
“No diagnostic ischemic changes on this recording; symptoms still require assessment.”
“Voltage criteria with lateral strain; correlate with imaging.”
“WCT remains indeterminate; treat uncertainty appropriately.”
“QT measured manually, stated RR/correction and QRS duration.”
Each chapter links its primary studies or professional guidance. Original schematics are educational abstractions; real ECGs retain case or dataset provenance, licenses and stated transformations. The axis, QT and Bayesian tools teach their stated models; they do not establish a patient diagnosis.
Identify the clinically important finding or unresolved uncertainty and its consequence, with meaningful comparison to prior tracings when available.
