Skip to animations
← All guides

Animations

48 original teaching loops for 42 guides. Loops play automatically. Expand a loop for a closer view or slower playback.

Qualitative schematics with simplified anatomy and timing. Sources and interpretation accompany each loop. Download a video, GIF or scalable SVG for teaching.

48 animations

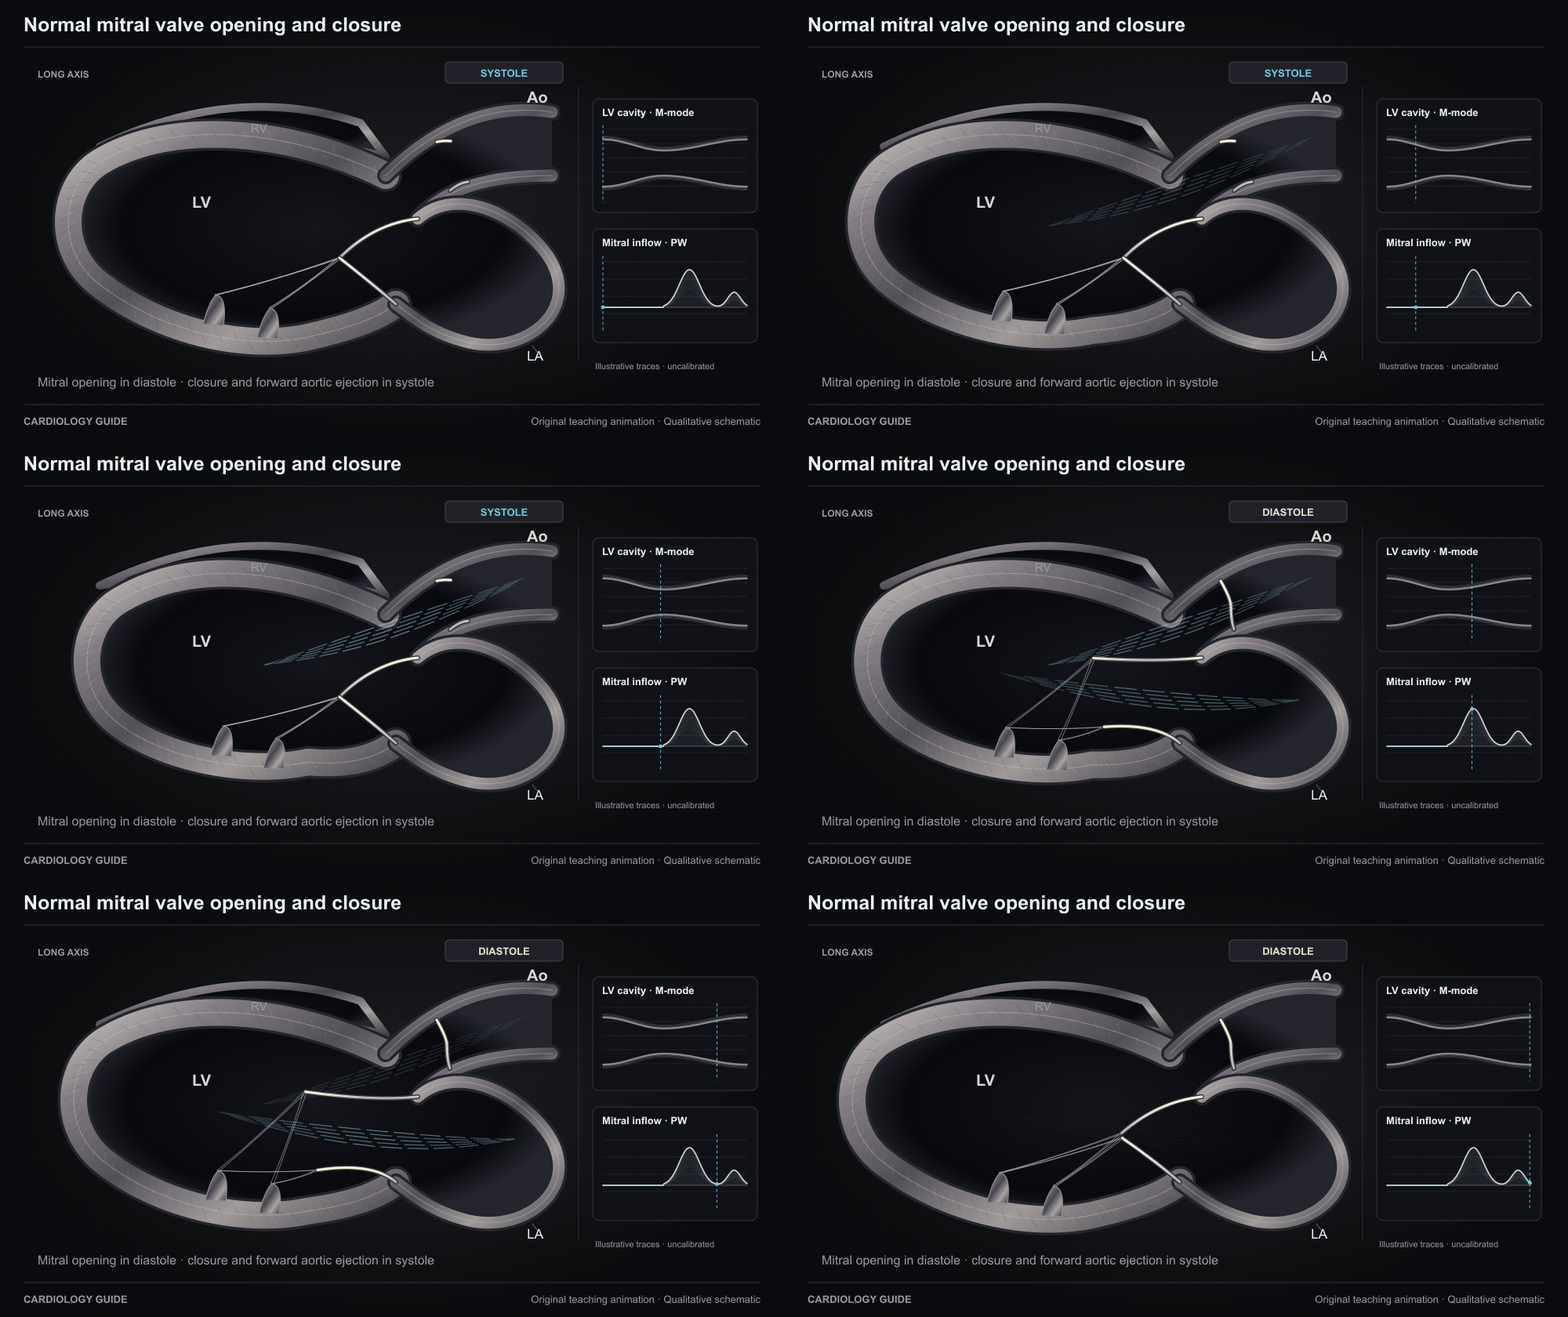
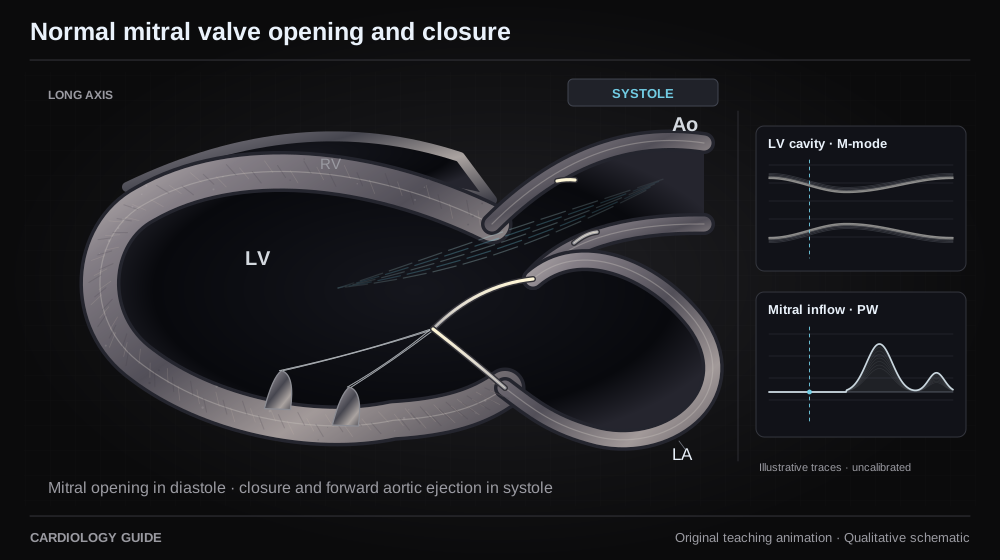
Normal mitral valve opening and closure

The mitral valve opens for LA-to-LV filling in diastole and closes during ventricular systole while blood exits through the aortic valve. Original qualitative long-axis schematic with uncalibrated teaching traces.

Echo Guide — Physics, Diastology & Valve Quantitation · Structural & Valvular Heart Guide

Source and interpretation

ASE/SCMR native valvular regurgitation (2017)

Original qualitative teaching schematic. Motion, particles and traces are illustrative. Timing and geometry are simplified.

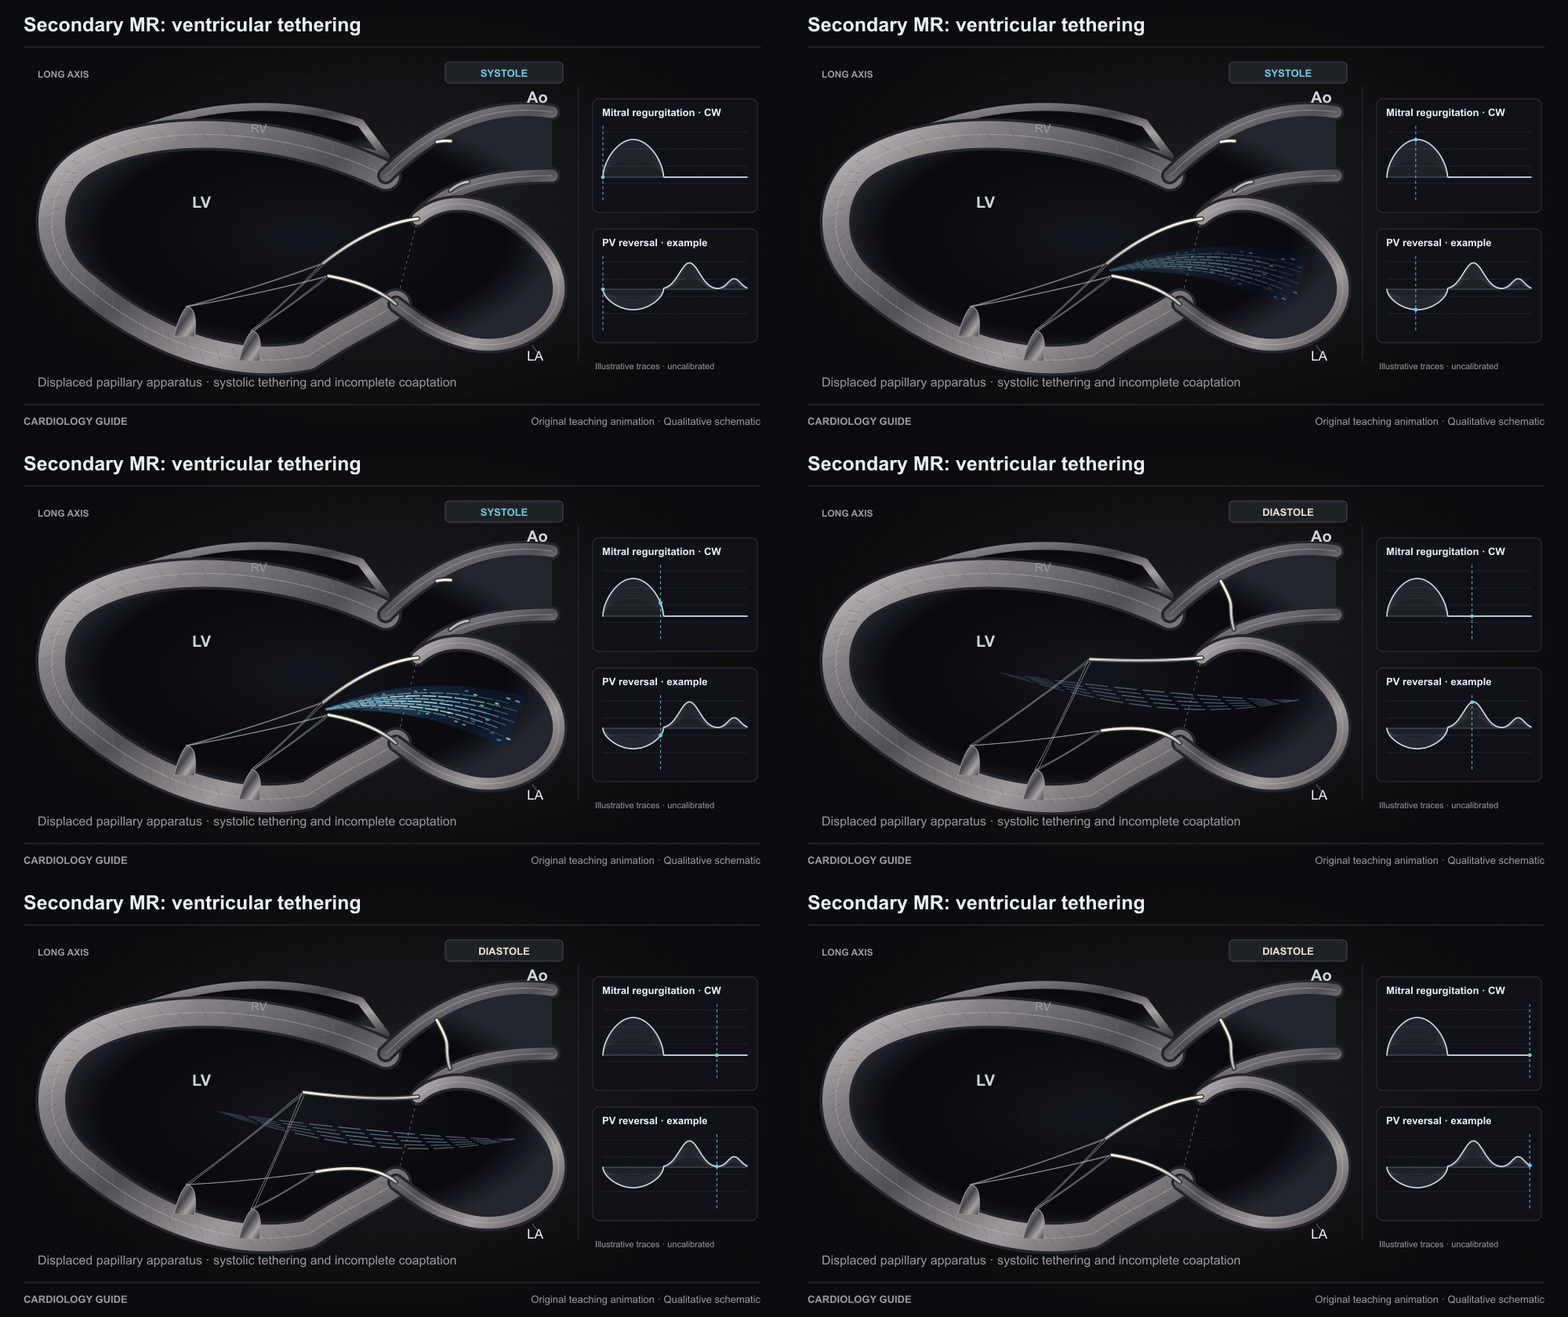
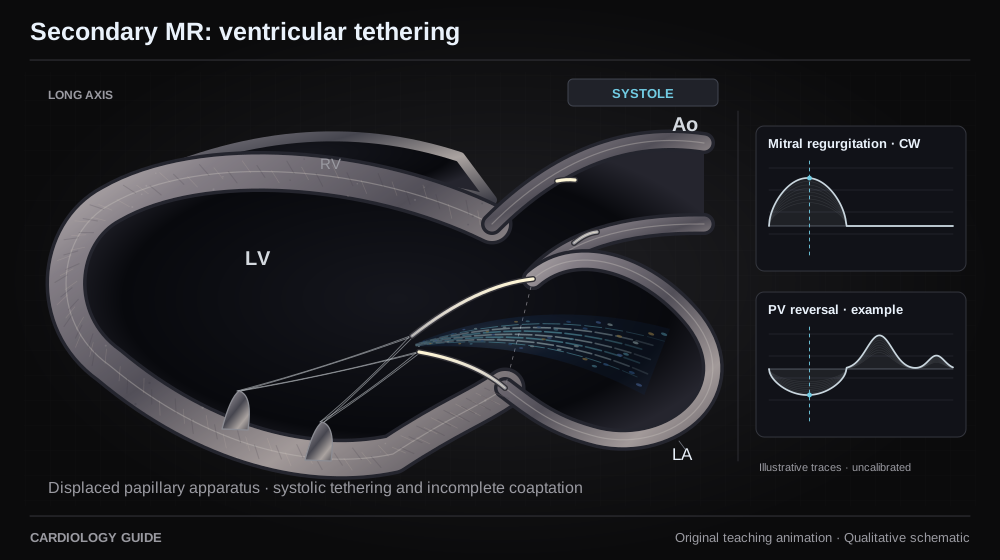
Secondary MR: ventricular tethering

In this ventricular secondary-MR example, LV remodeling displaces the papillary apparatus and restricts systolic leaflet coaptation. The stream travels from LV to LA during systole. Geometry varies across patients. Traces are qualitative and uncalibrated.

Structural & Valvular Heart Guide · Heart Failure Comprehensive · Echo Guide — Physics, Diastology & Valve Quantitation

Source and interpretation

ASE/SCMR native valvular regurgitation (2017)

Original qualitative teaching schematic. Motion, particles and traces are illustrative. Timing and geometry are simplified.

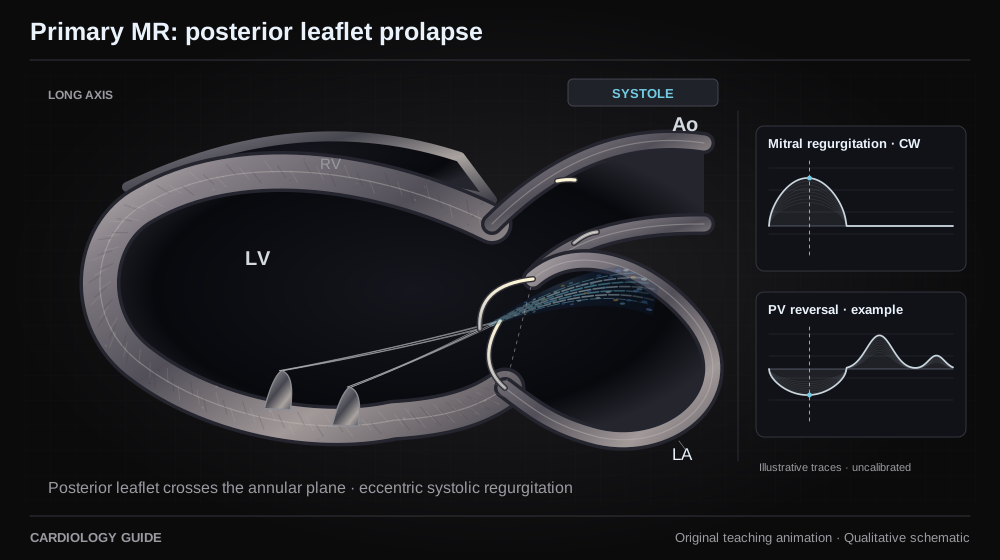
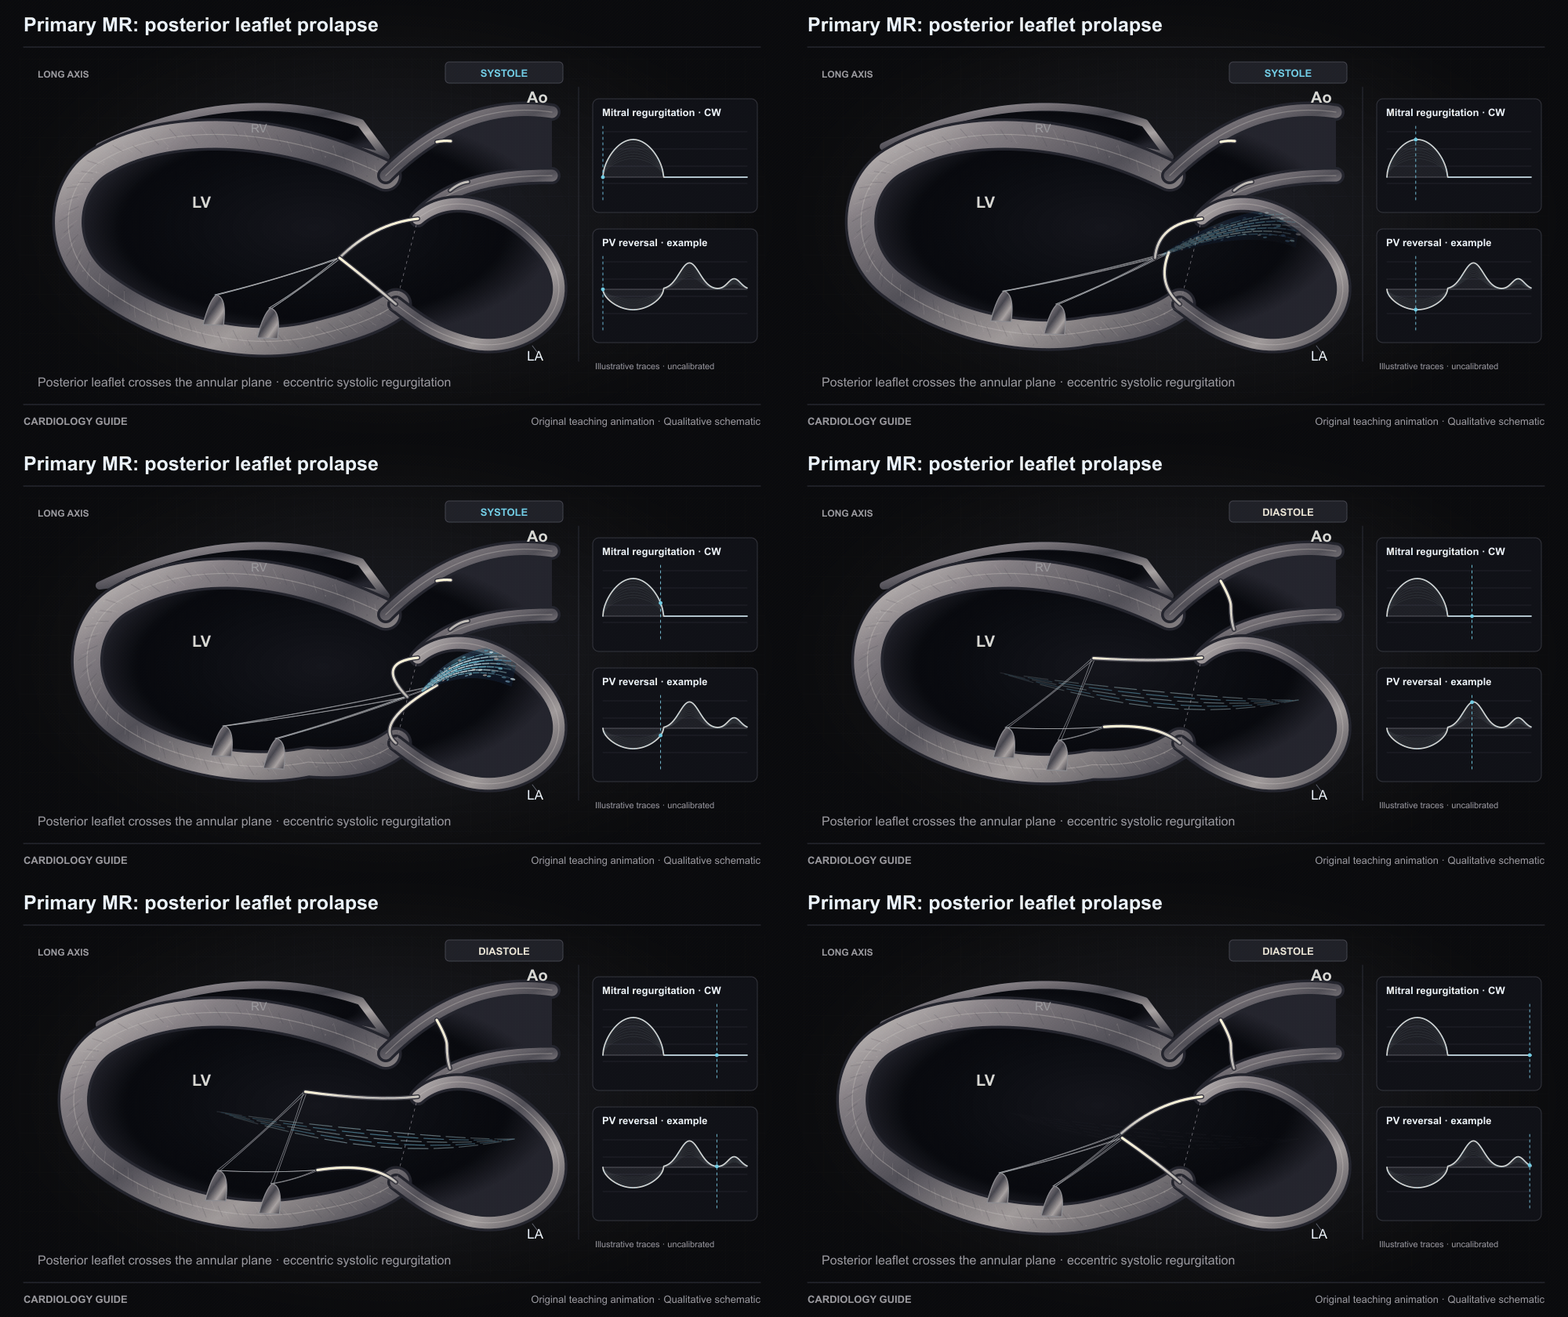
Primary MR: posterior leaflet prolapse

A posterior mitral leaflet prolapses to the atrial side of the annular plane during systole, impairing coaptation and producing an eccentric stream. This shows one primary-MR mechanism, not all degenerative disease. Traces are qualitative and uncalibrated.

Structural & Valvular Heart Guide · Echo Guide — Physics, Diastology & Valve Quantitation

Source and interpretation

ASE/SCMR native valvular regurgitation (2017)

Original qualitative teaching schematic. Motion, particles and traces are illustrative. Timing and geometry are simplified.

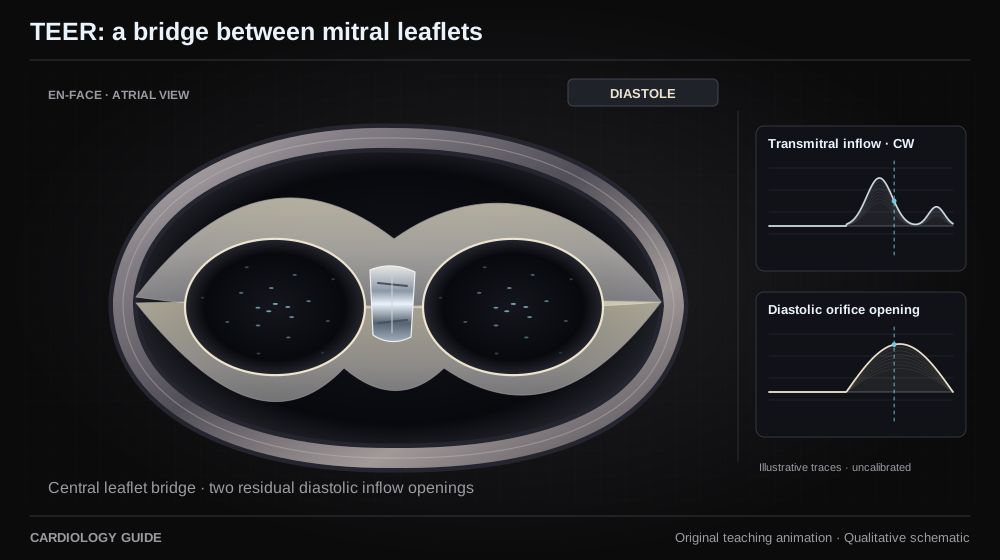
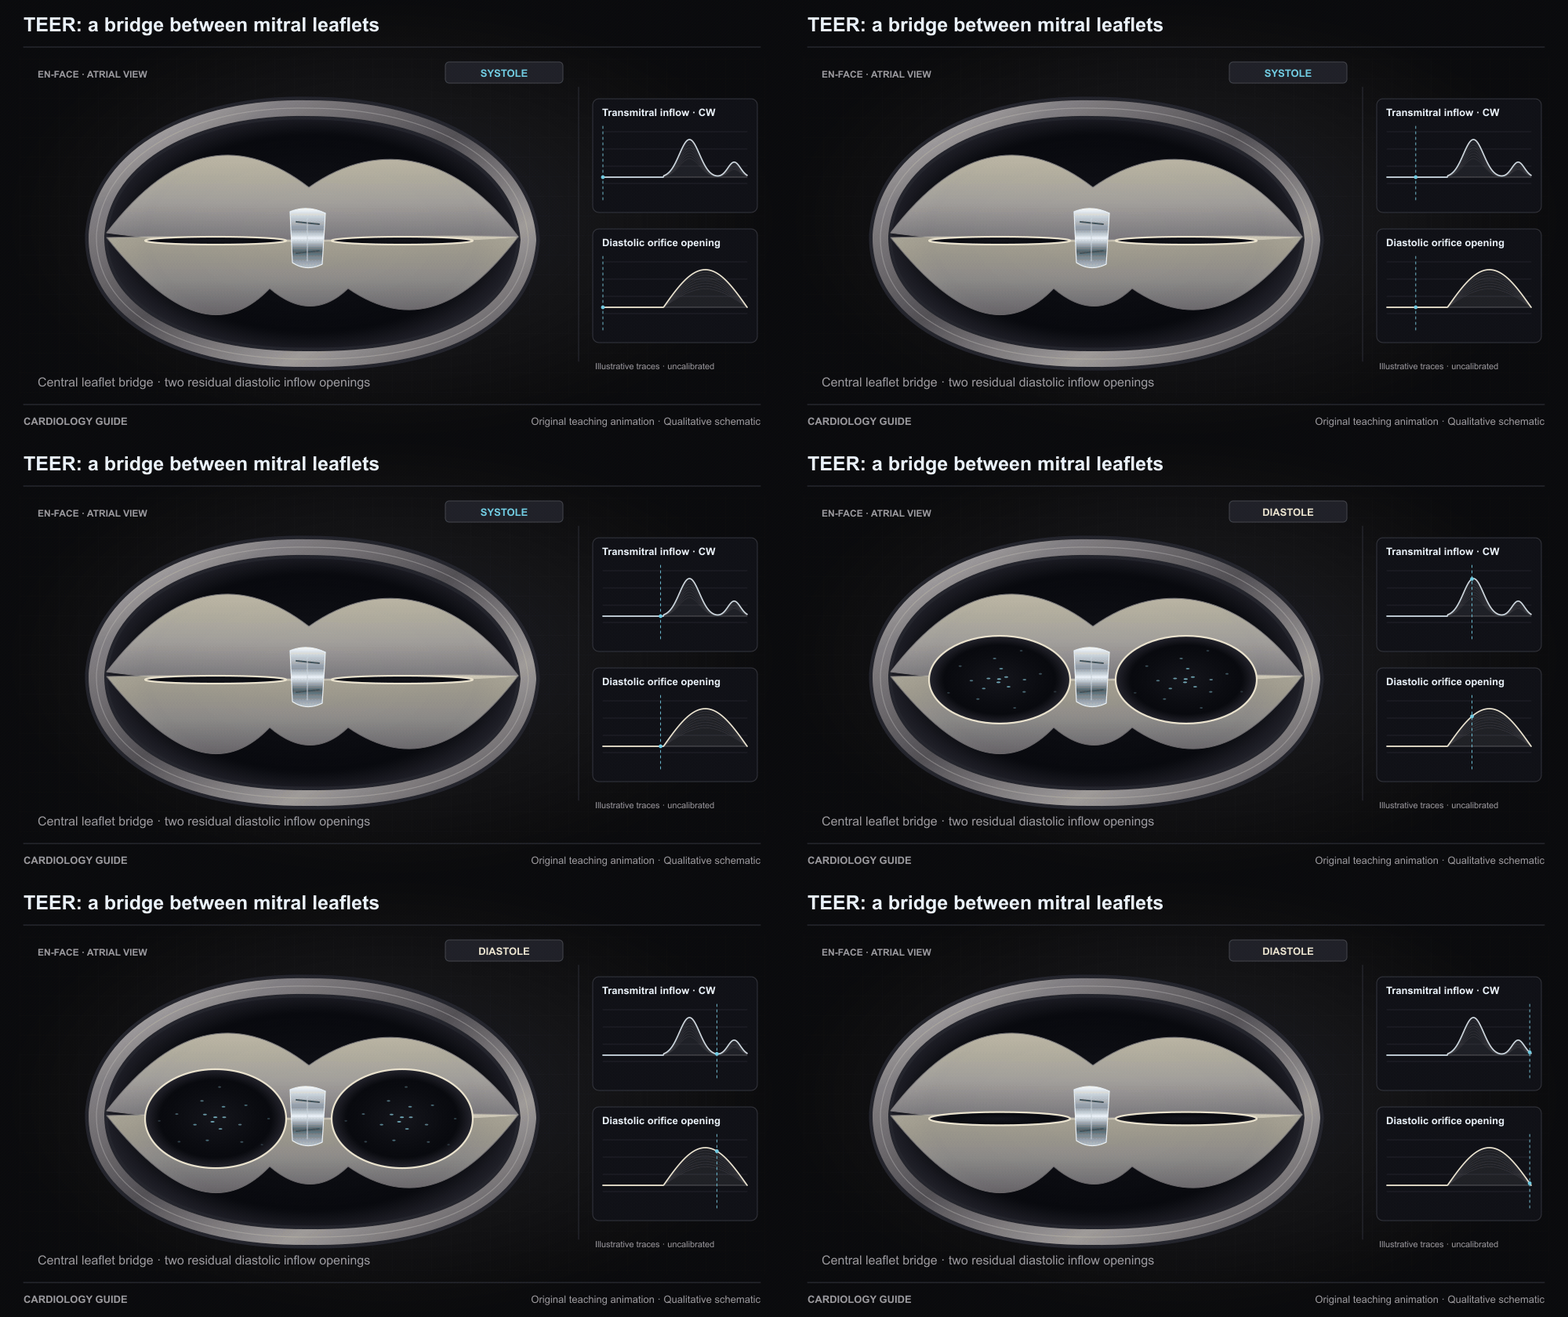
TEER: a bridge between mitral leaflets

An en-face schematic shows central edge-to-edge leaflet approximation creating two residual inflow orifices. They expand during diastole around the leaflet bridge. This depicts geometry, not procedural guidance or guaranteed MR elimination. Flecks represent inflow through the plane.

Structural & Valvular Heart Guide · Heart Failure Comprehensive

Source and interpretation

ASE after percutaneous valve repair (2019)

Original qualitative teaching schematic. Motion, particles and traces are illustrative. Timing and geometry are simplified.

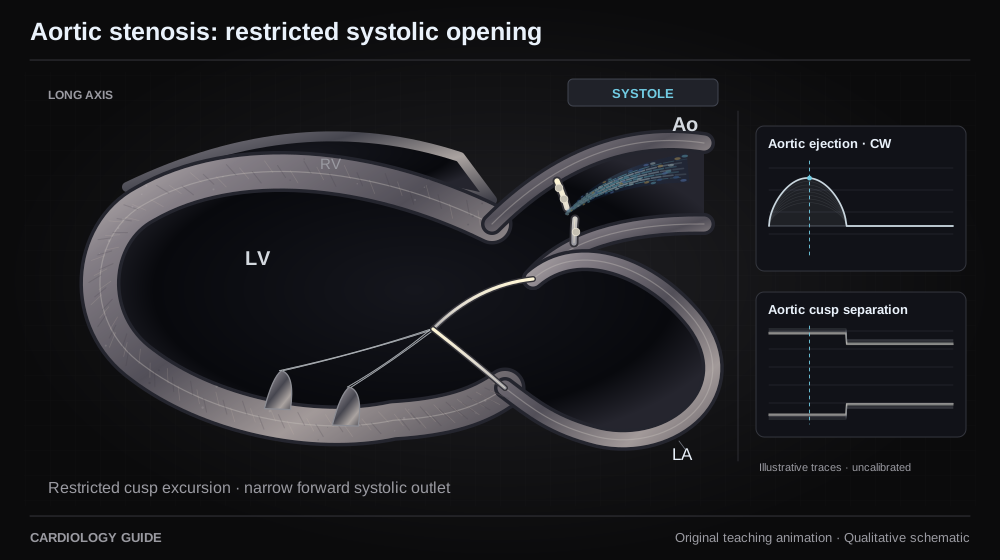
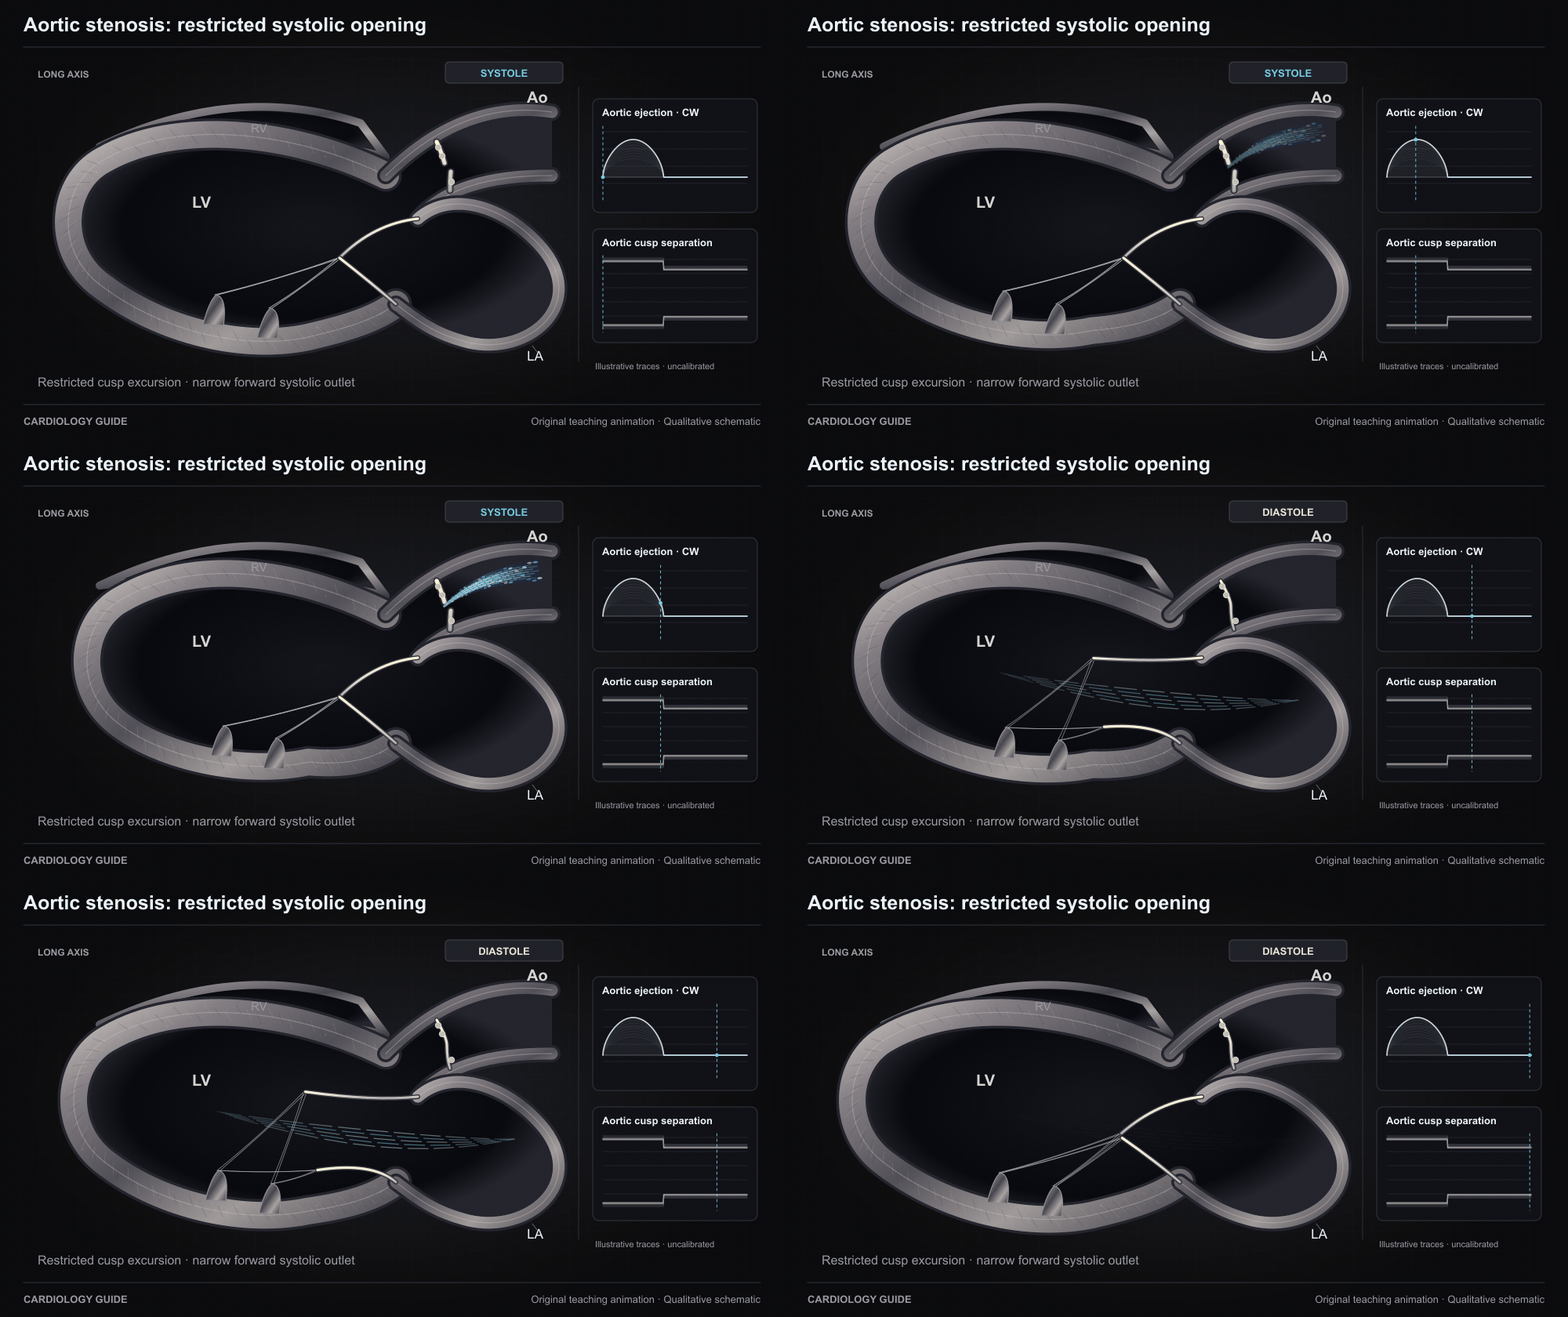
Aortic stenosis: restricted systolic opening

Restricted cusp opening concentrates forward flow through a narrowed aortic outlet in systole. The jet and teaching CW envelope illustrate timing without a calibrated velocity or severity scale.

Structural & Valvular Heart Guide · Echo Guide — Physics, Diastology & Valve Quantitation · Bedside Cardiac Examination

Source and interpretation

ASE/EACVI aortic valve stenosis (2017)

Original qualitative teaching schematic. Motion, particles and traces are illustrative. Timing and geometry are simplified.

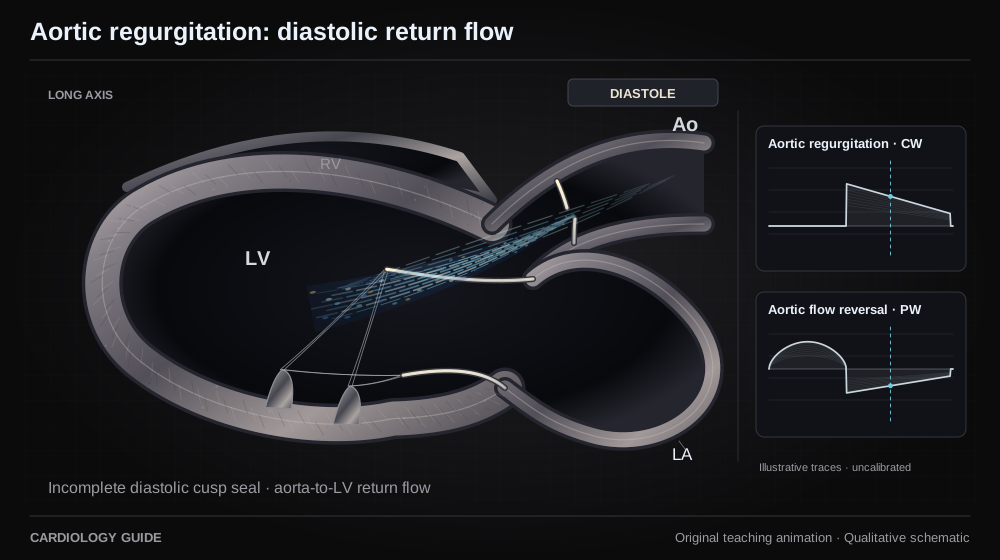
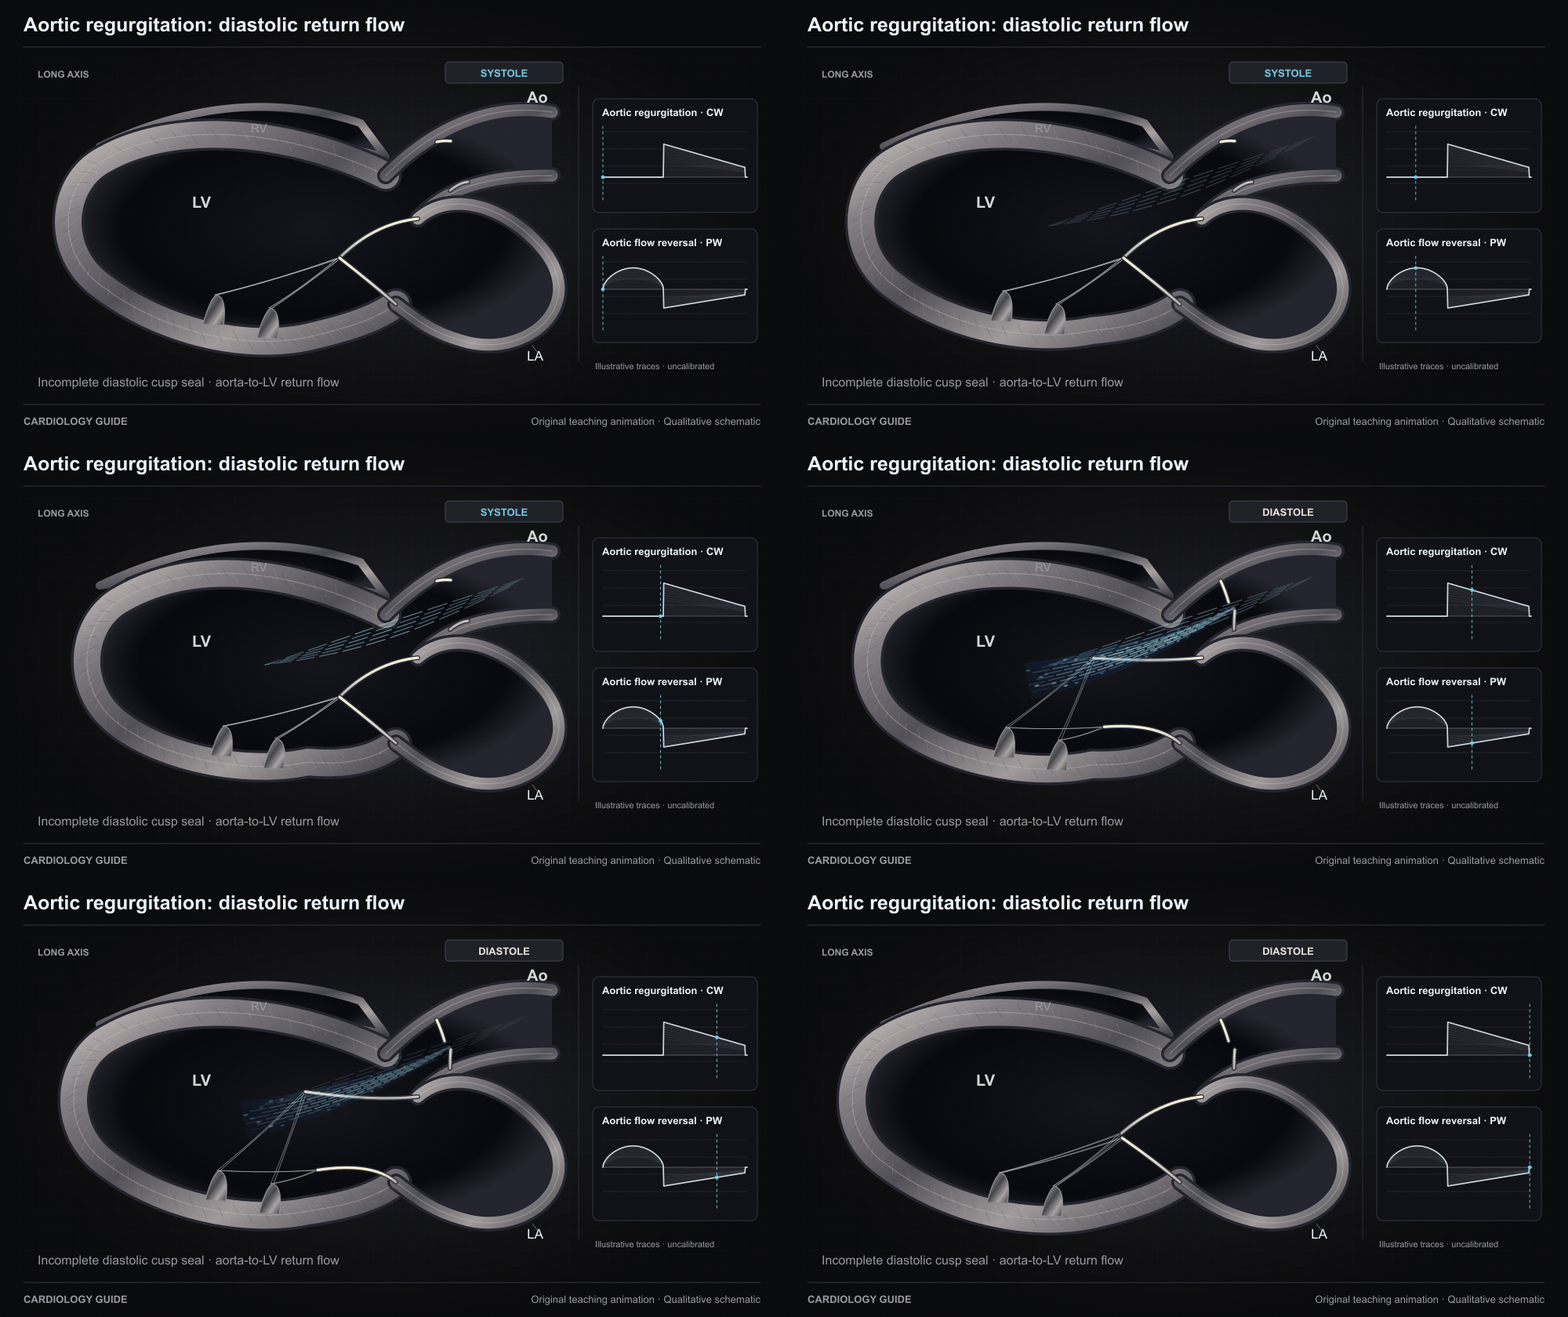
Aortic regurgitation: diastolic return flow

Incomplete aortic closure allows aorta-to-LV return flow during diastole. The reverse diastolic stream and normal forward systolic stream are phase-gated. Teaching traces are qualitative and cannot grade AR.

Structural & Valvular Heart Guide · Echo Guide — Physics, Diastology & Valve Quantitation · Bedside Cardiac Examination

Source and interpretation

ASE/SCMR native valvular regurgitation (2017)

Original qualitative teaching schematic. Motion, particles and traces are illustrative. Timing and geometry are simplified.

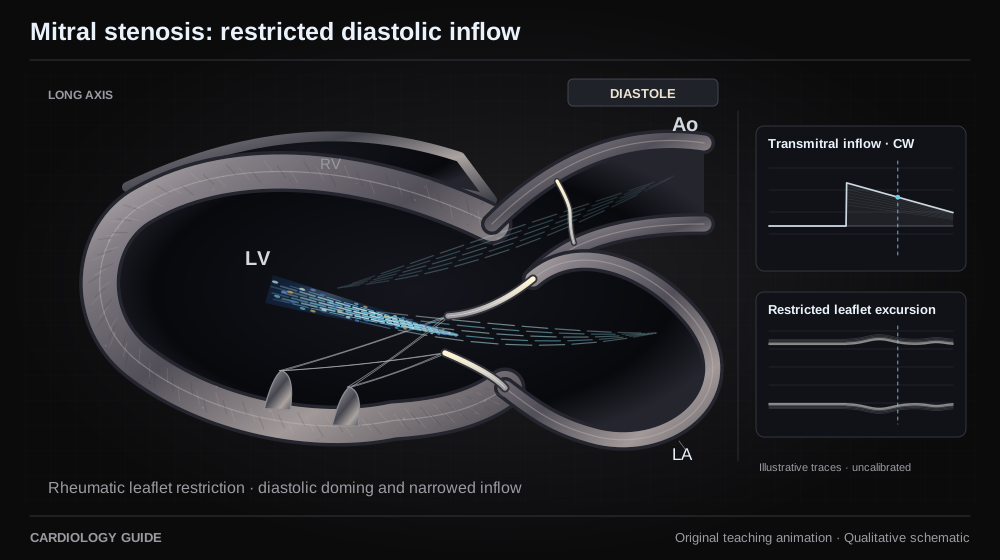
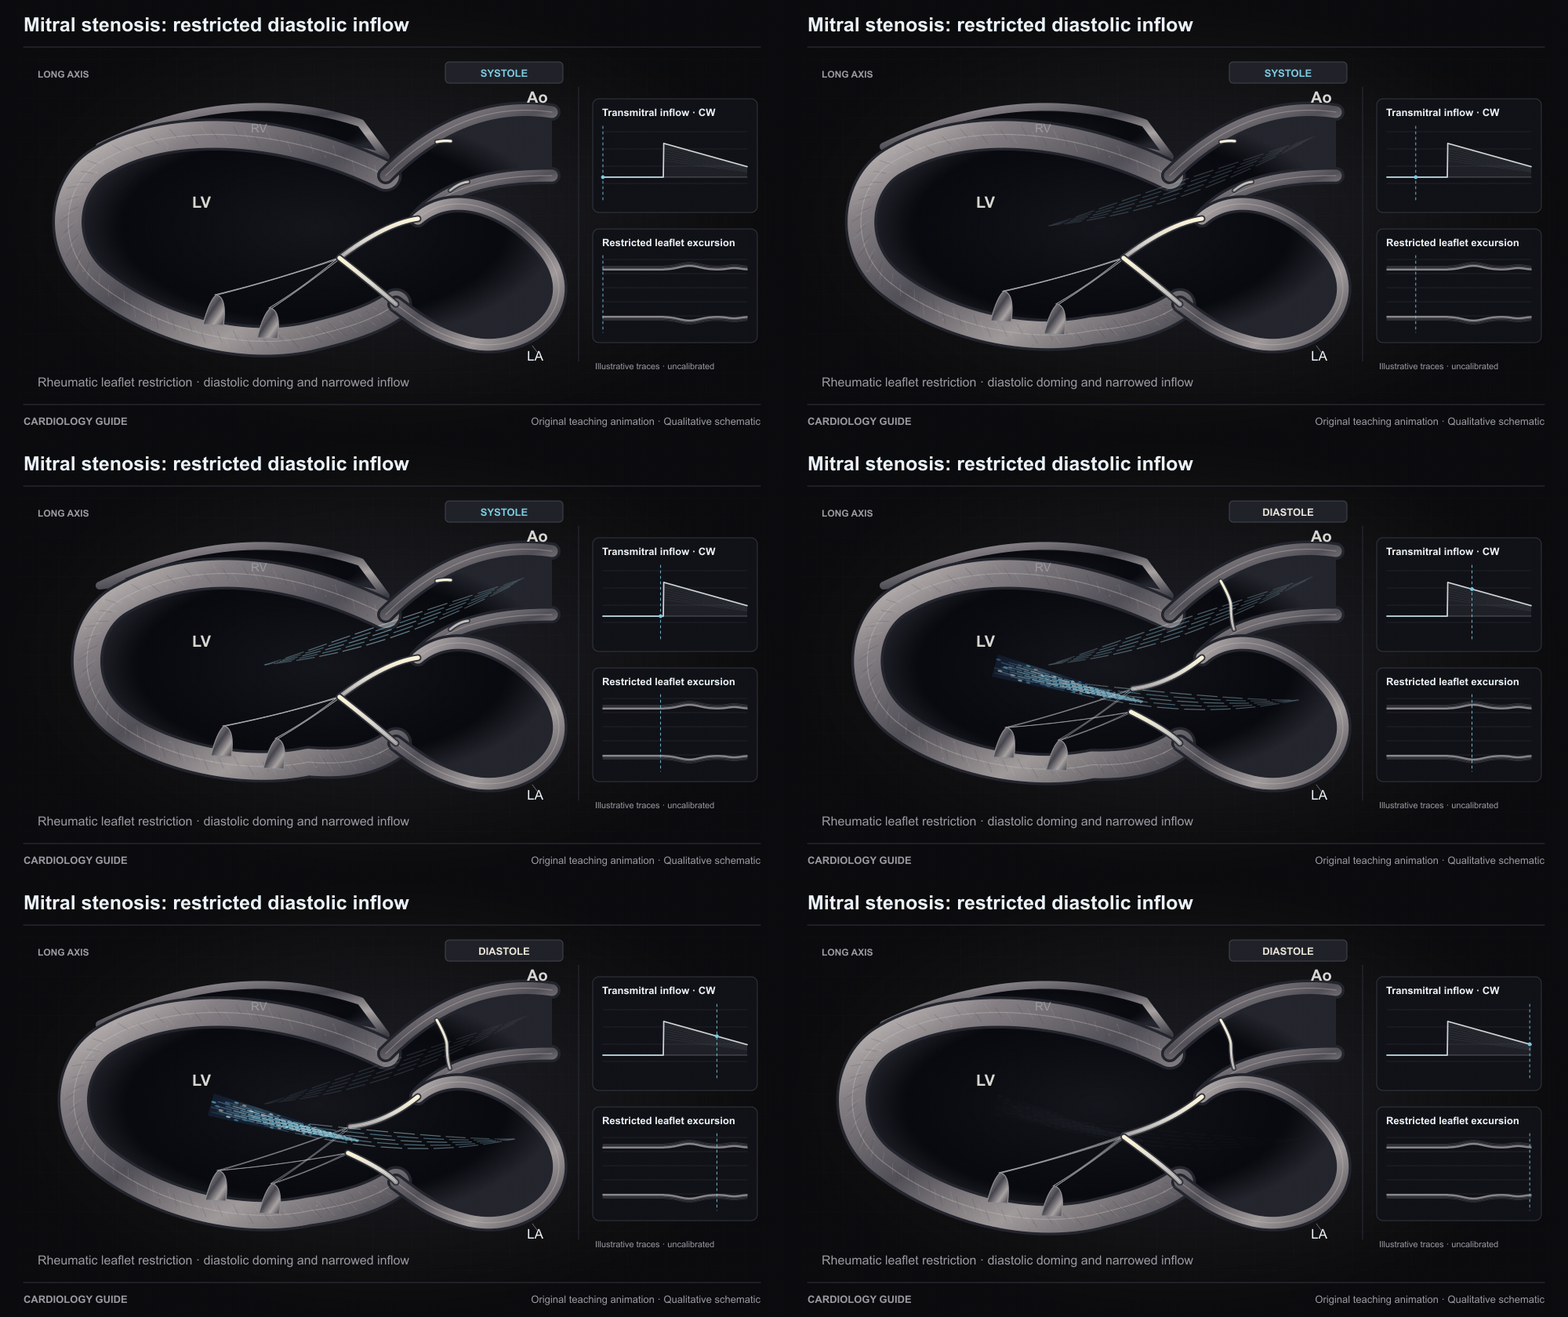
Mitral stenosis: restricted diastolic inflow

This rheumatic-MS example shows thickened, restricted leaflets doming in diastole with a narrowed residual inflow opening. Flow travels LA to LV. MAC-related stenosis has different anatomy. Teaching traces are uncalibrated.

Structural & Valvular Heart Guide · Echo Guide — Physics, Diastology & Valve Quantitation

Source and interpretation

ASE rheumatic heart disease (2023)

Original qualitative teaching schematic. Motion, particles and traces are illustrative. Timing and geometry are simplified.

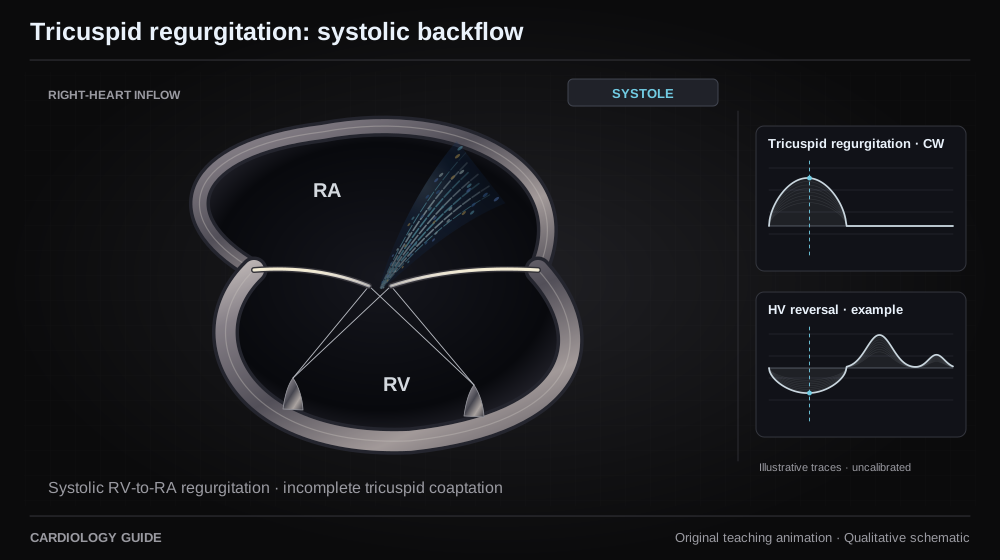
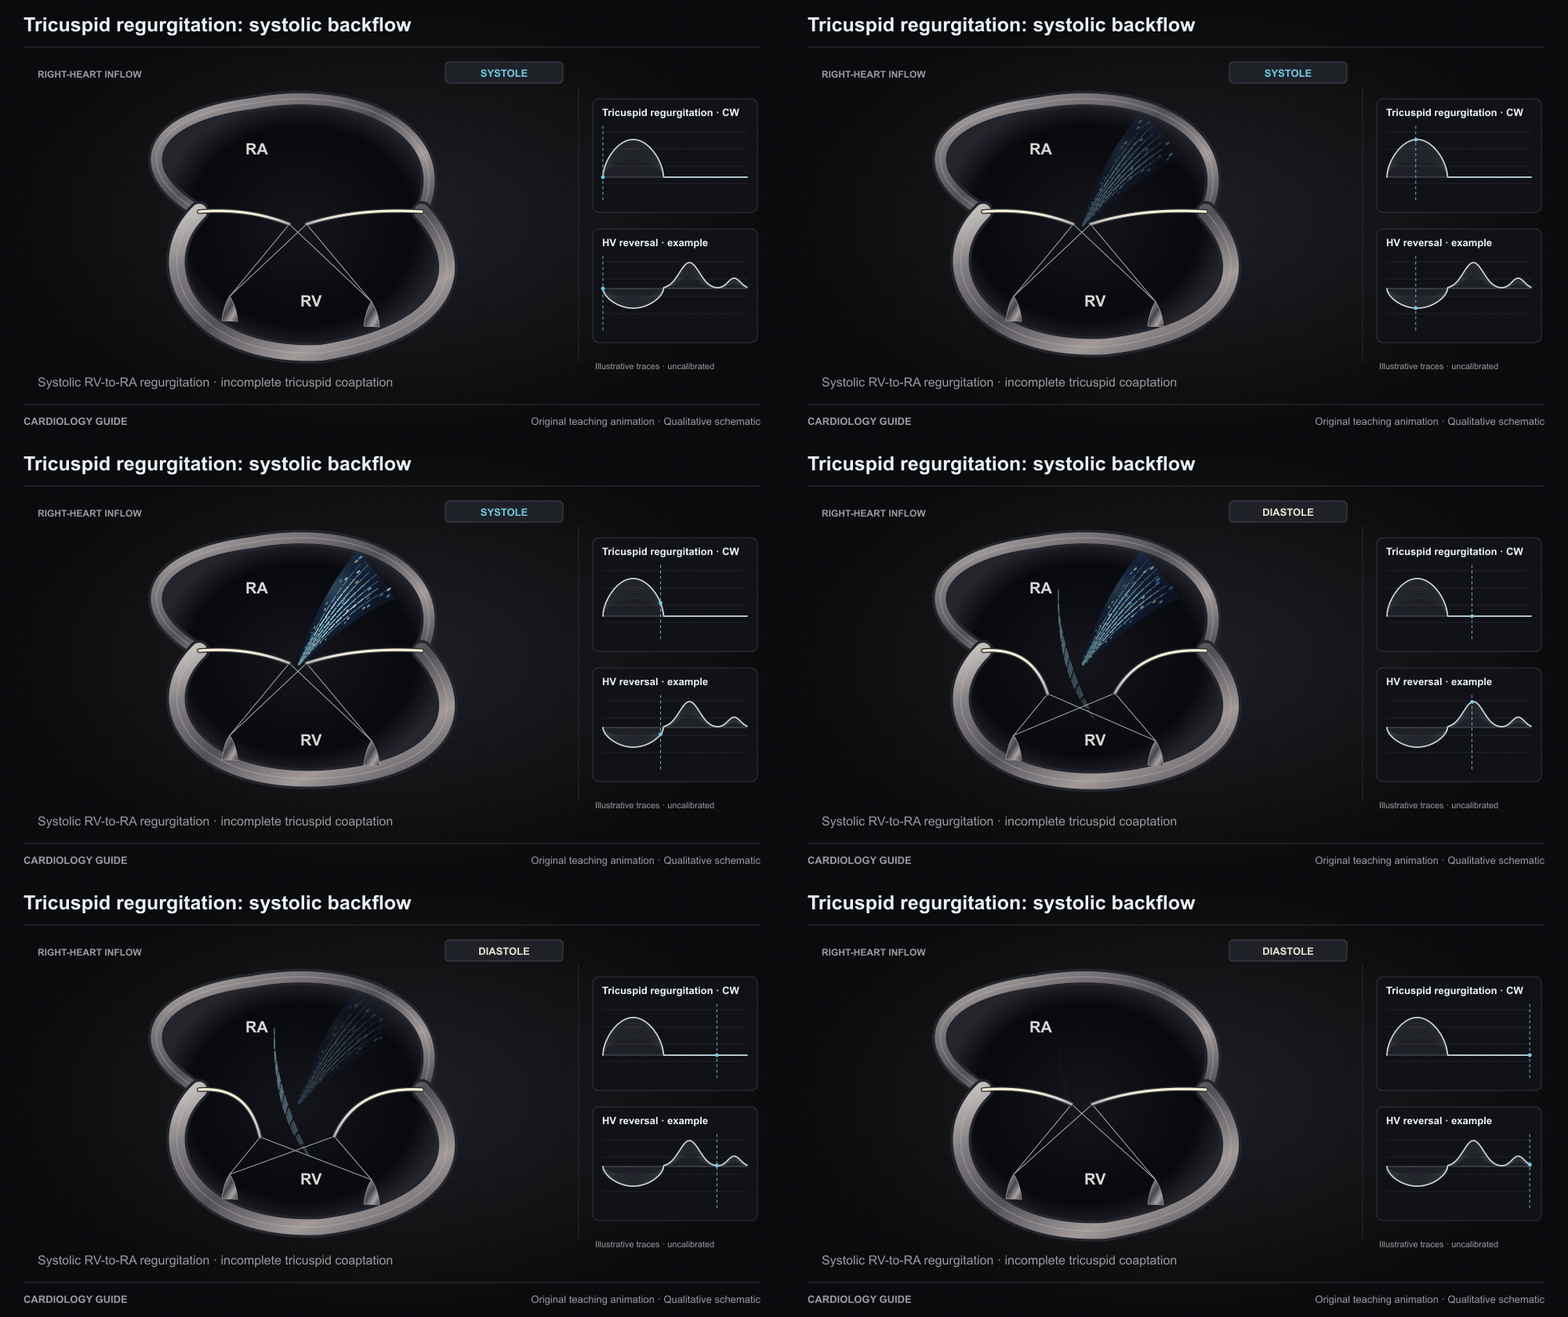
Tricuspid regurgitation: systolic backflow

Incomplete tricuspid coaptation allows RV-to-RA backflow in systole. The valve opens for RA-to-RV filling in diastole. This right-heart teaching plane and its traces do not quantify TR.

Structural & Valvular Heart Guide · Right Ventricular Failure · Echo Guide — Physics, Diastology & Valve Quantitation

Source and interpretation

ASE/SCMR native valvular regurgitation (2017)

Original qualitative teaching schematic. Motion, particles and traces are illustrative. Timing and geometry are simplified.

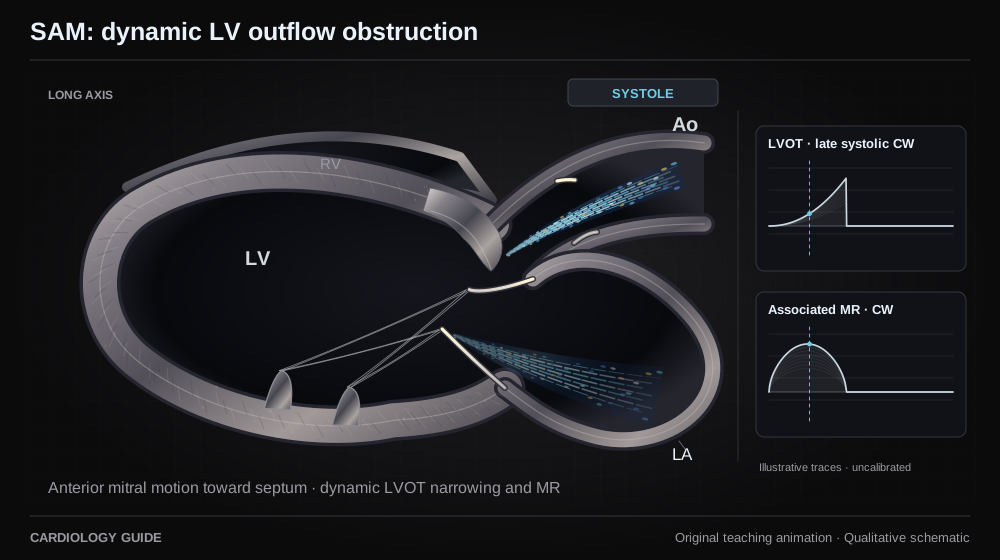
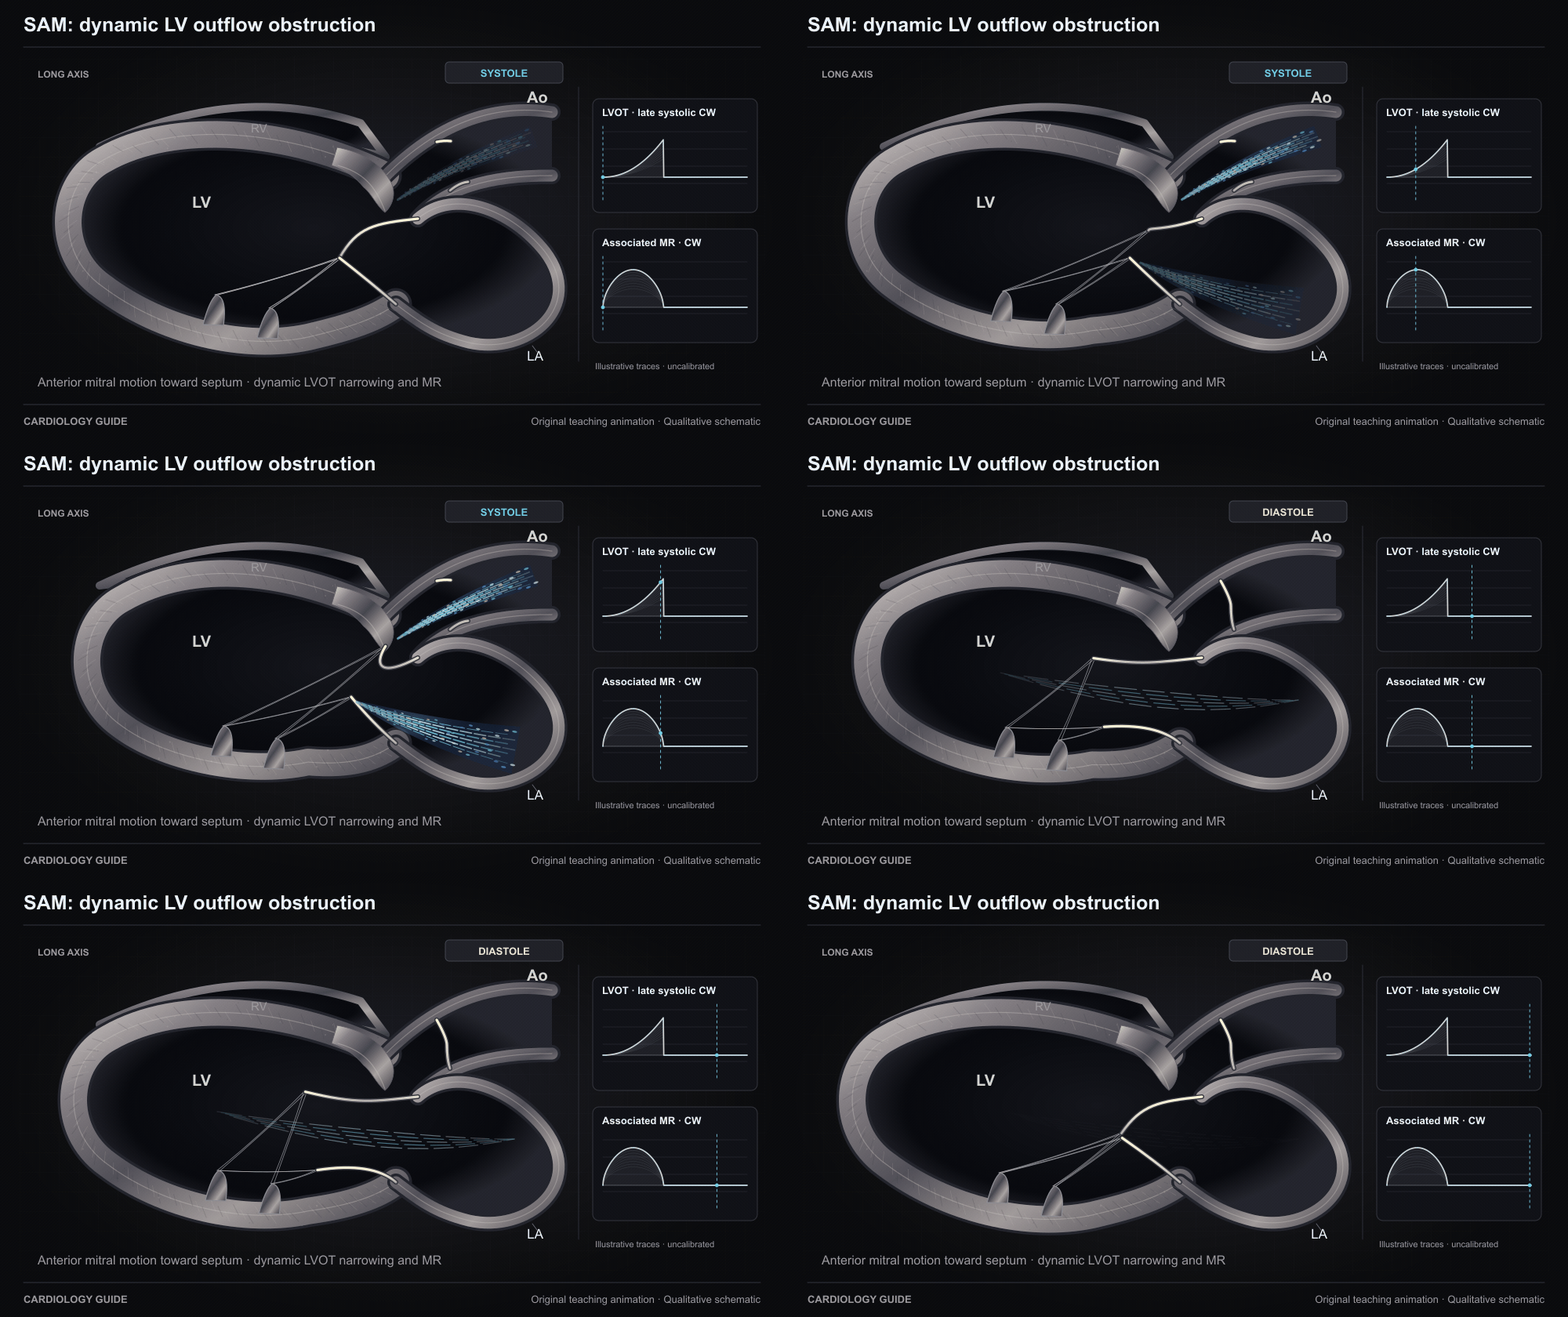
SAM: dynamic LV outflow obstruction

In this obstructive-HCM example, SAM brings the anterior mitral leaflet toward the basal septum, narrowing LV outflow and impairing coaptation. Not every HCM phenotype has SAM or obstruction. The late systolic envelope is uncalibrated.

Hypertrophic Cardiomyopathy · Echo Guide — Physics, Diastology & Valve Quantitation · Mechanical Complications of MI

Source and interpretation

AHA/ACC HCM guideline (2024)

Original qualitative teaching schematic. Motion, particles and traces are illustrative. Timing and geometry are simplified.

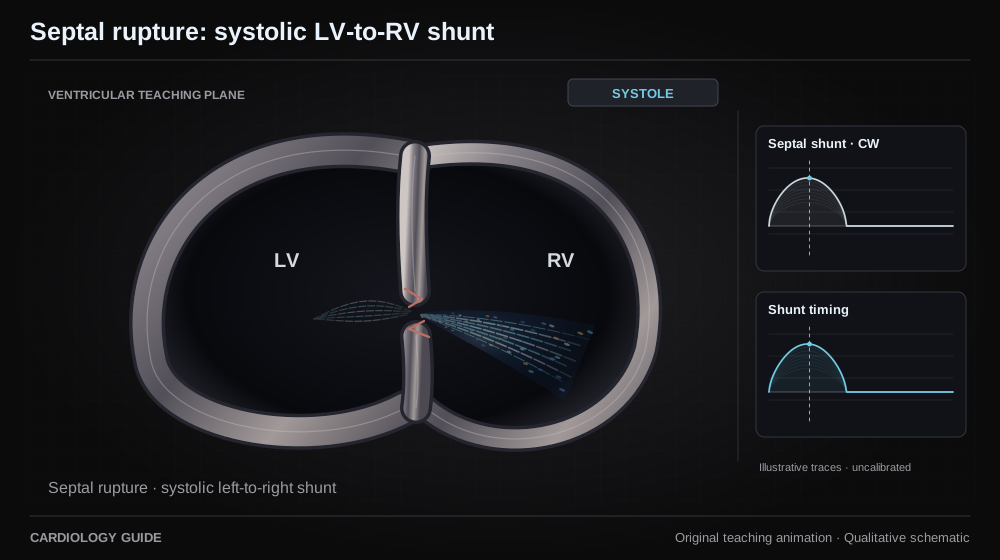
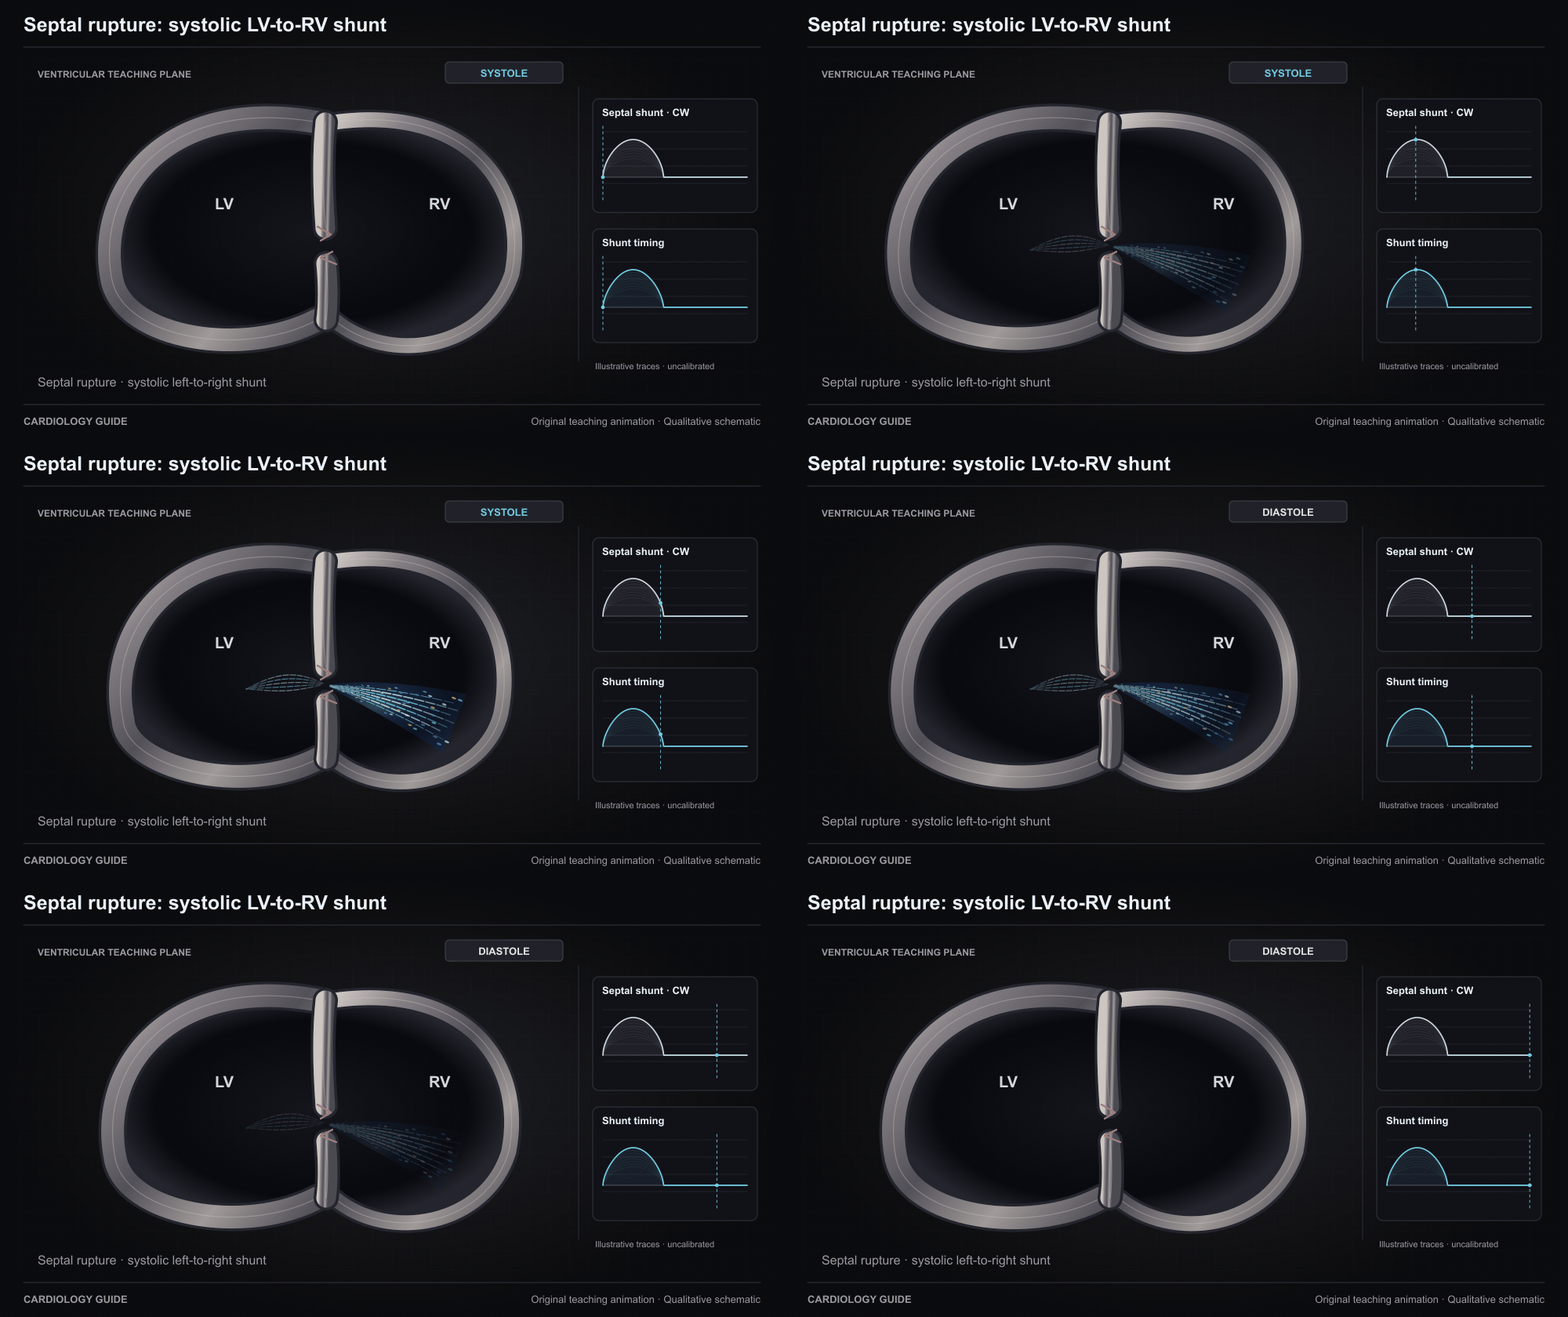
Septal rupture: systolic LV-to-RV shunt

A post-infarction ventricular septal defect permits a left-to-right shunt in systole. The LV-to-RV stream is phase-gated. Anatomy and consequences vary by defect location and loading. Teaching traces have no velocity scale.

Mechanical Complications of MI · Echo Guide — Physics, Diastology & Valve Quantitation · Cardiac Catheterization Diagnostics

Source and interpretation

AHA mechanical complications of MI (2021)

Original qualitative teaching schematic. Motion, particles and traces are illustrative. Timing and geometry are simplified.

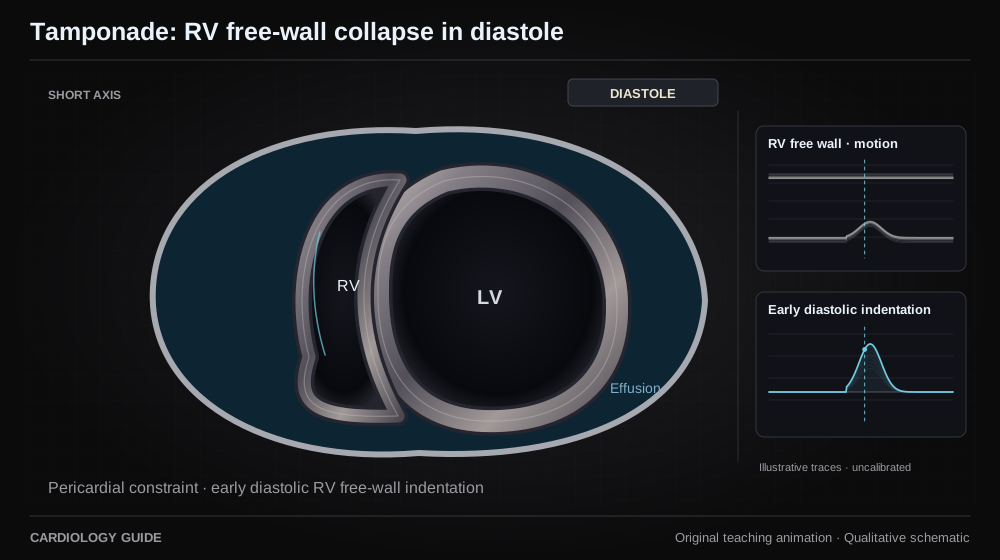
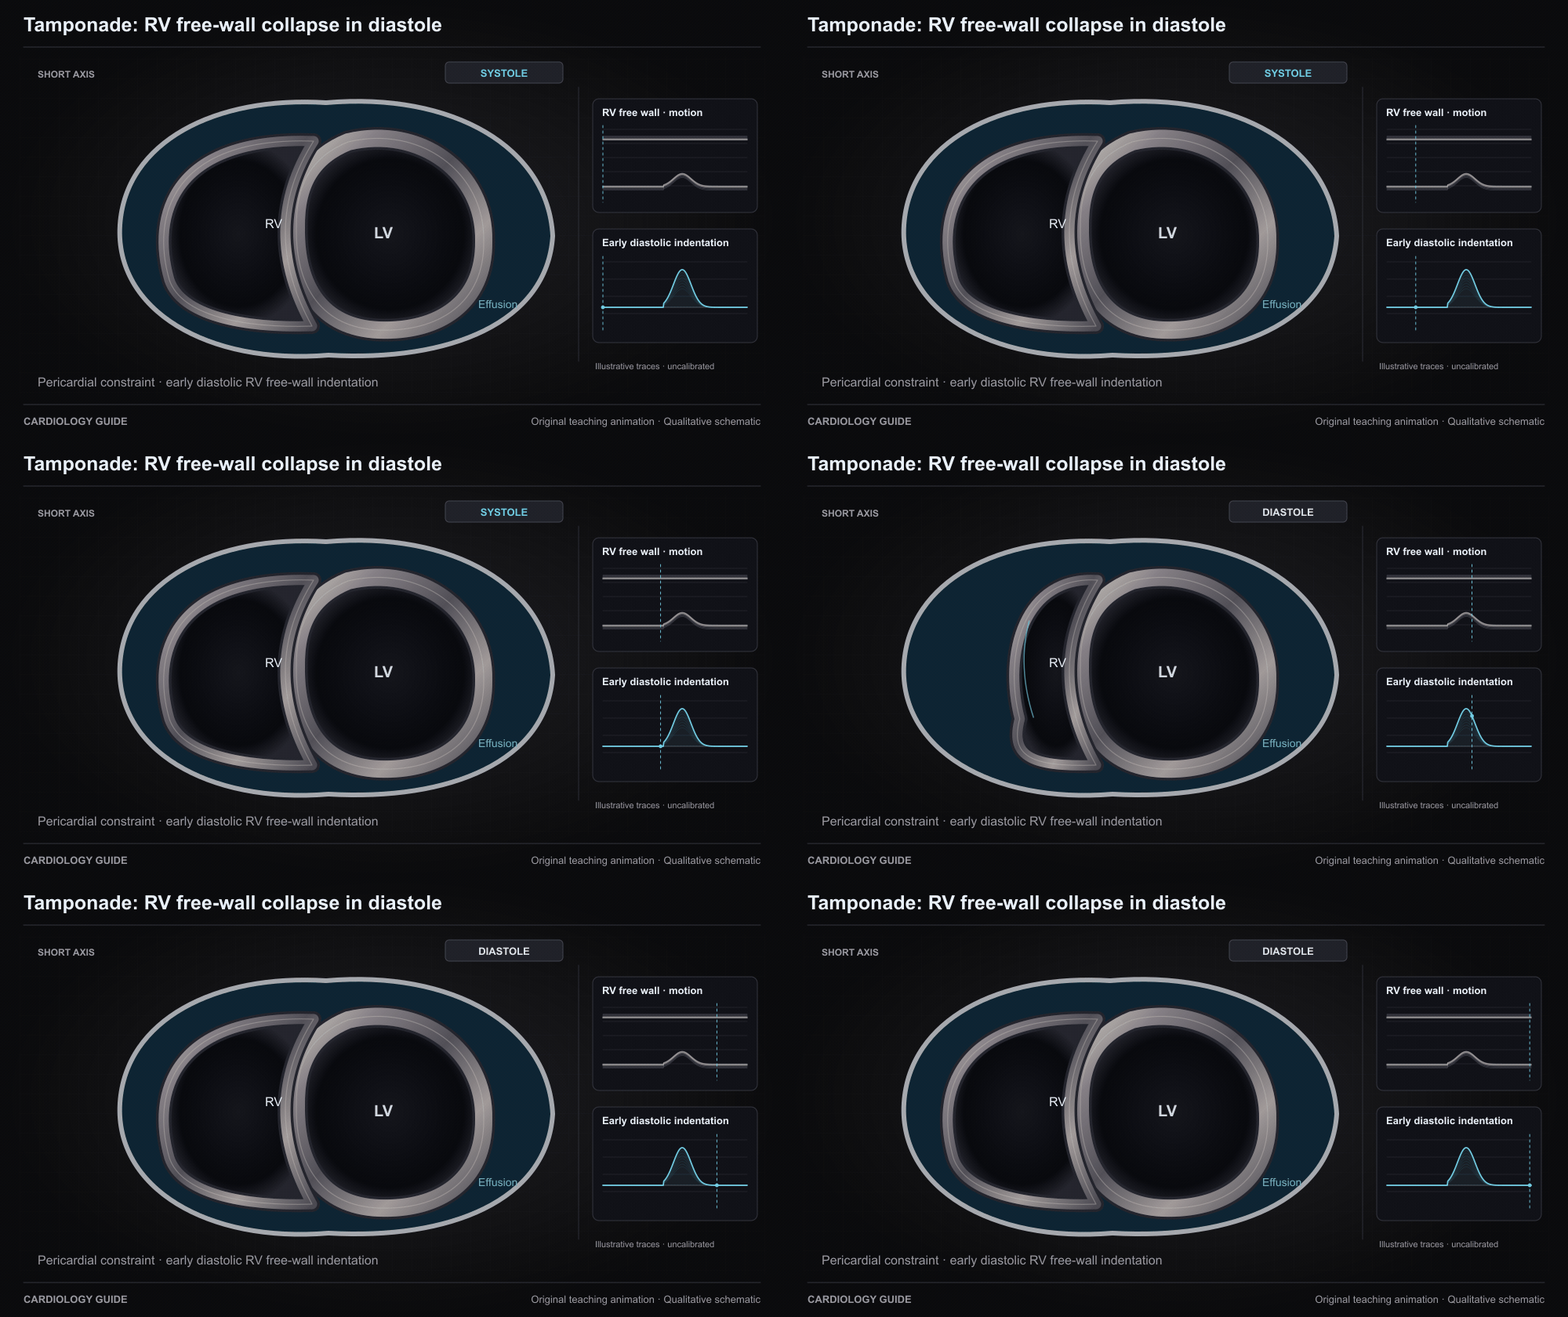
Tamponade: RV free-wall collapse in diastole

Pericardial pressure can transiently exceed RV pressure in early diastole and indent its free wall. Collapse timing is one element of integrated tamponade assessment. Elevated right-sided pressure can prevent collapse. The motion trace is qualitative.

Pericardial Disease & Tamponade · Echo Guide — Physics, Diastology & Valve Quantitation · Mechanical Complications of MI

Source and interpretation

ESC pericardiocentesis in tamponade (2017)

Original qualitative teaching schematic. Motion, particles and traces are illustrative. Timing and geometry are simplified.

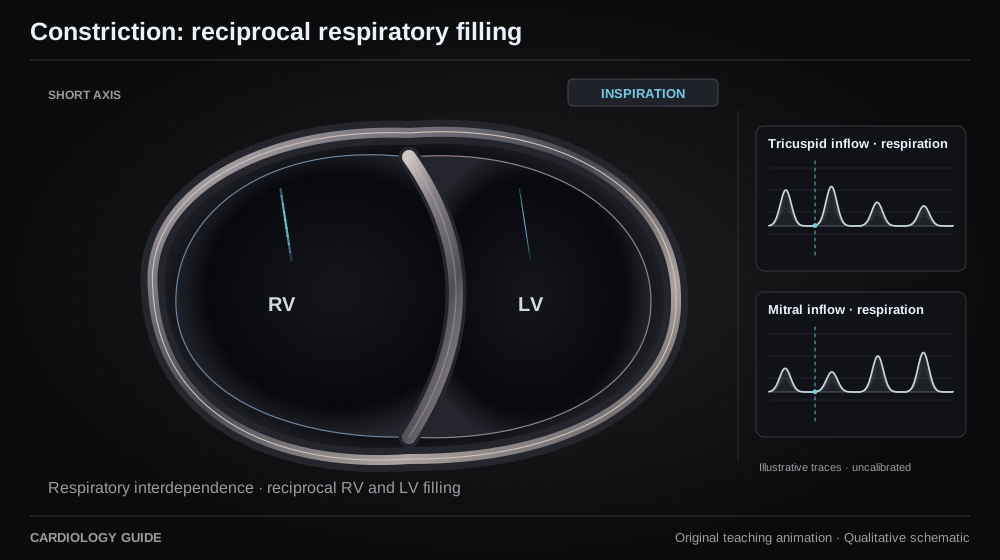
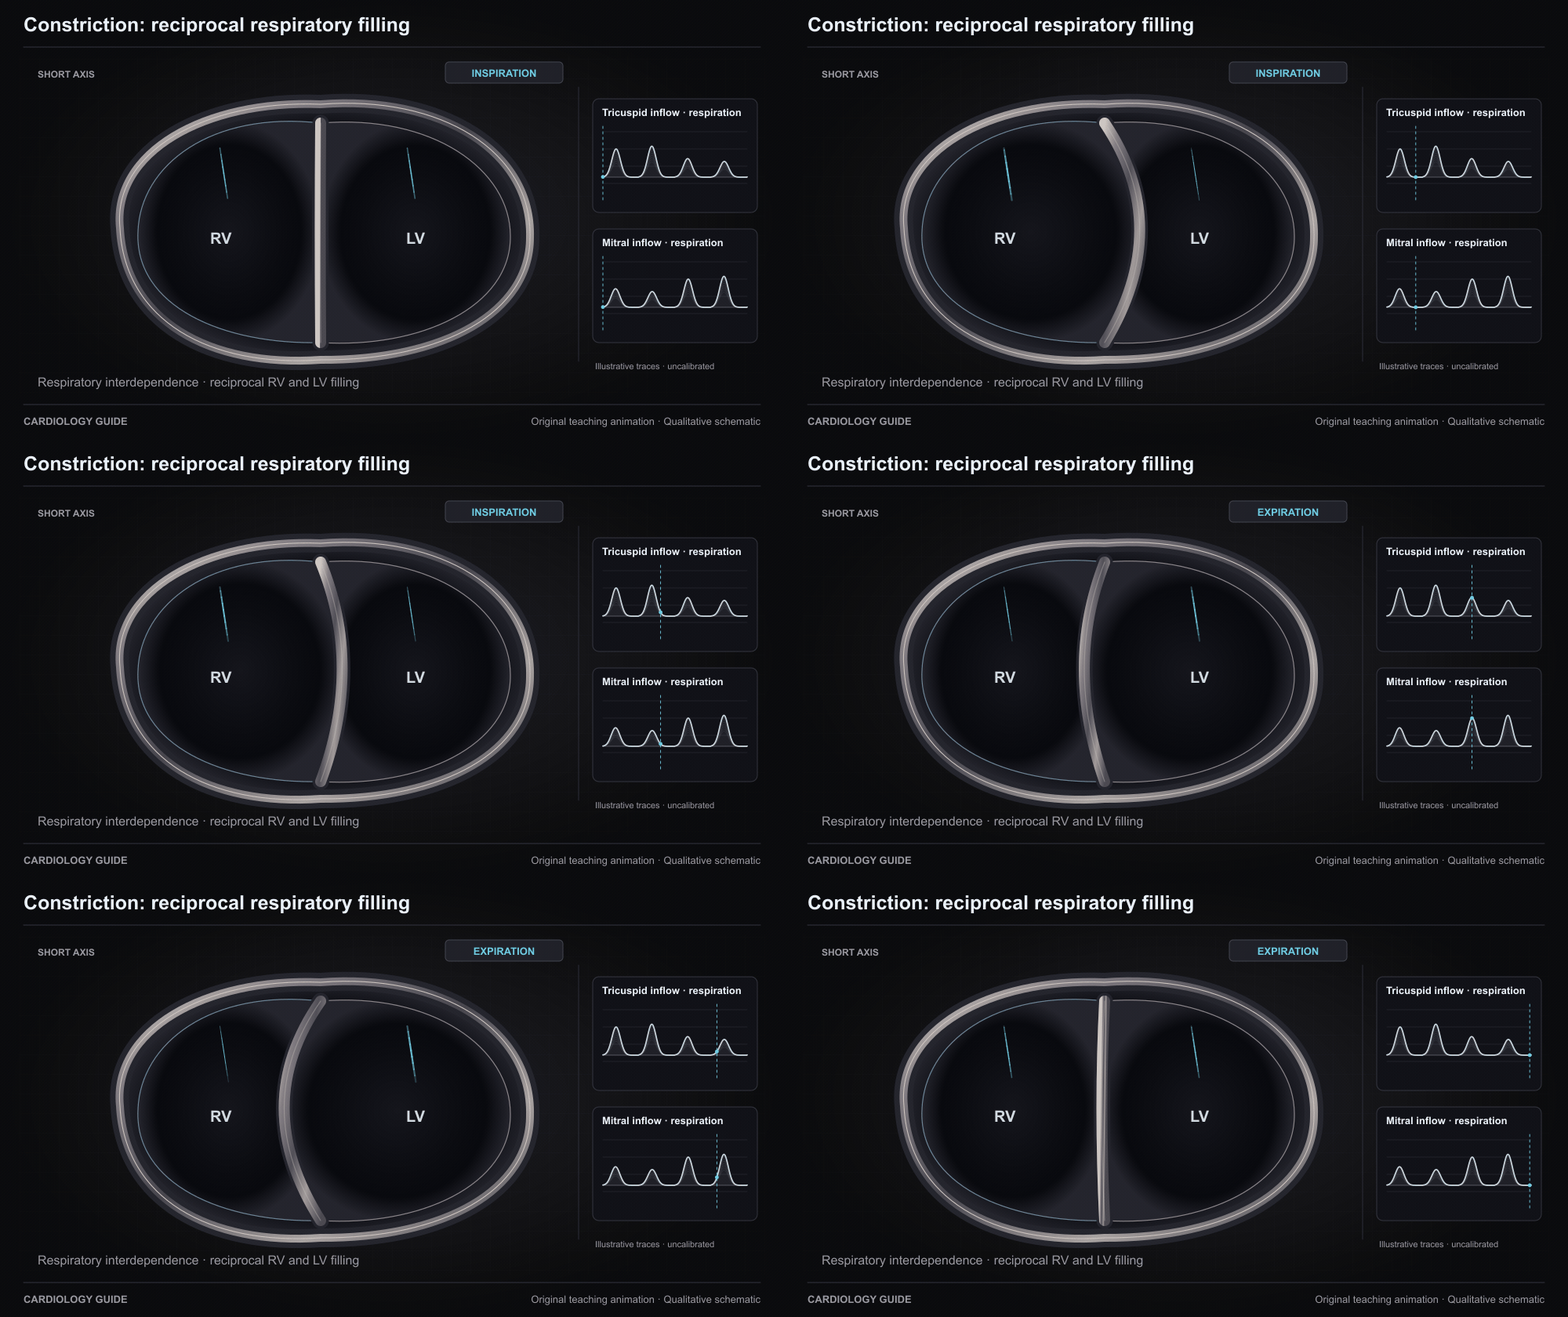
Constriction: reciprocal respiratory filling

Pericardial constraint exaggerates ventricular interdependence. Inspiration increases RV filling while LV filling decreases and the septum shifts toward the LV. Expiration reverses the balance. This is a respiratory loop. Paired inflow envelopes are qualitative, not measured Doppler data.

Pericardial Disease & Tamponade · Right Heart Cath & Hemodynamics · Echo Guide — Physics, Diastology & Valve Quantitation

Source and interpretation

ESC constriction imaging (2017)

Original qualitative teaching schematic. Motion, particles and traces are illustrative. Timing and geometry are simplified.

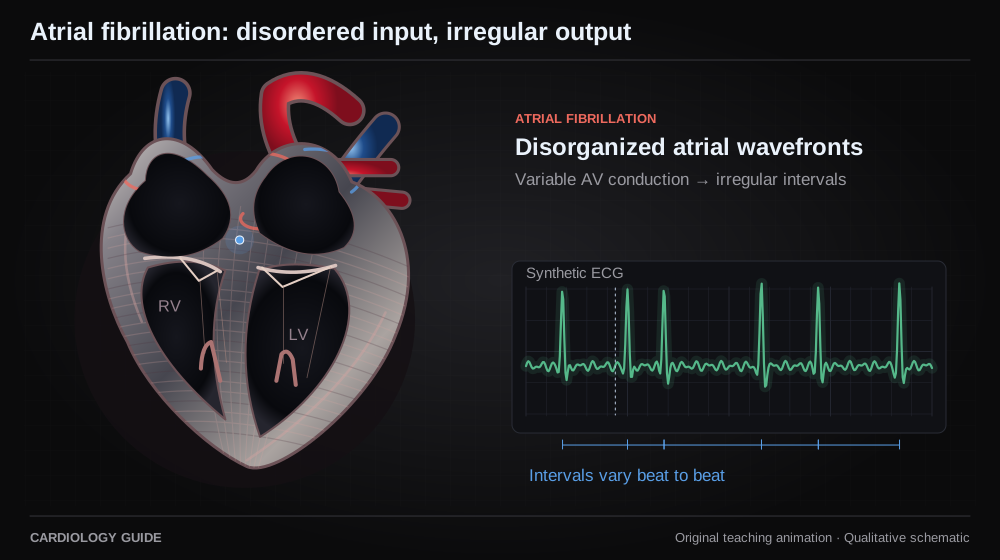
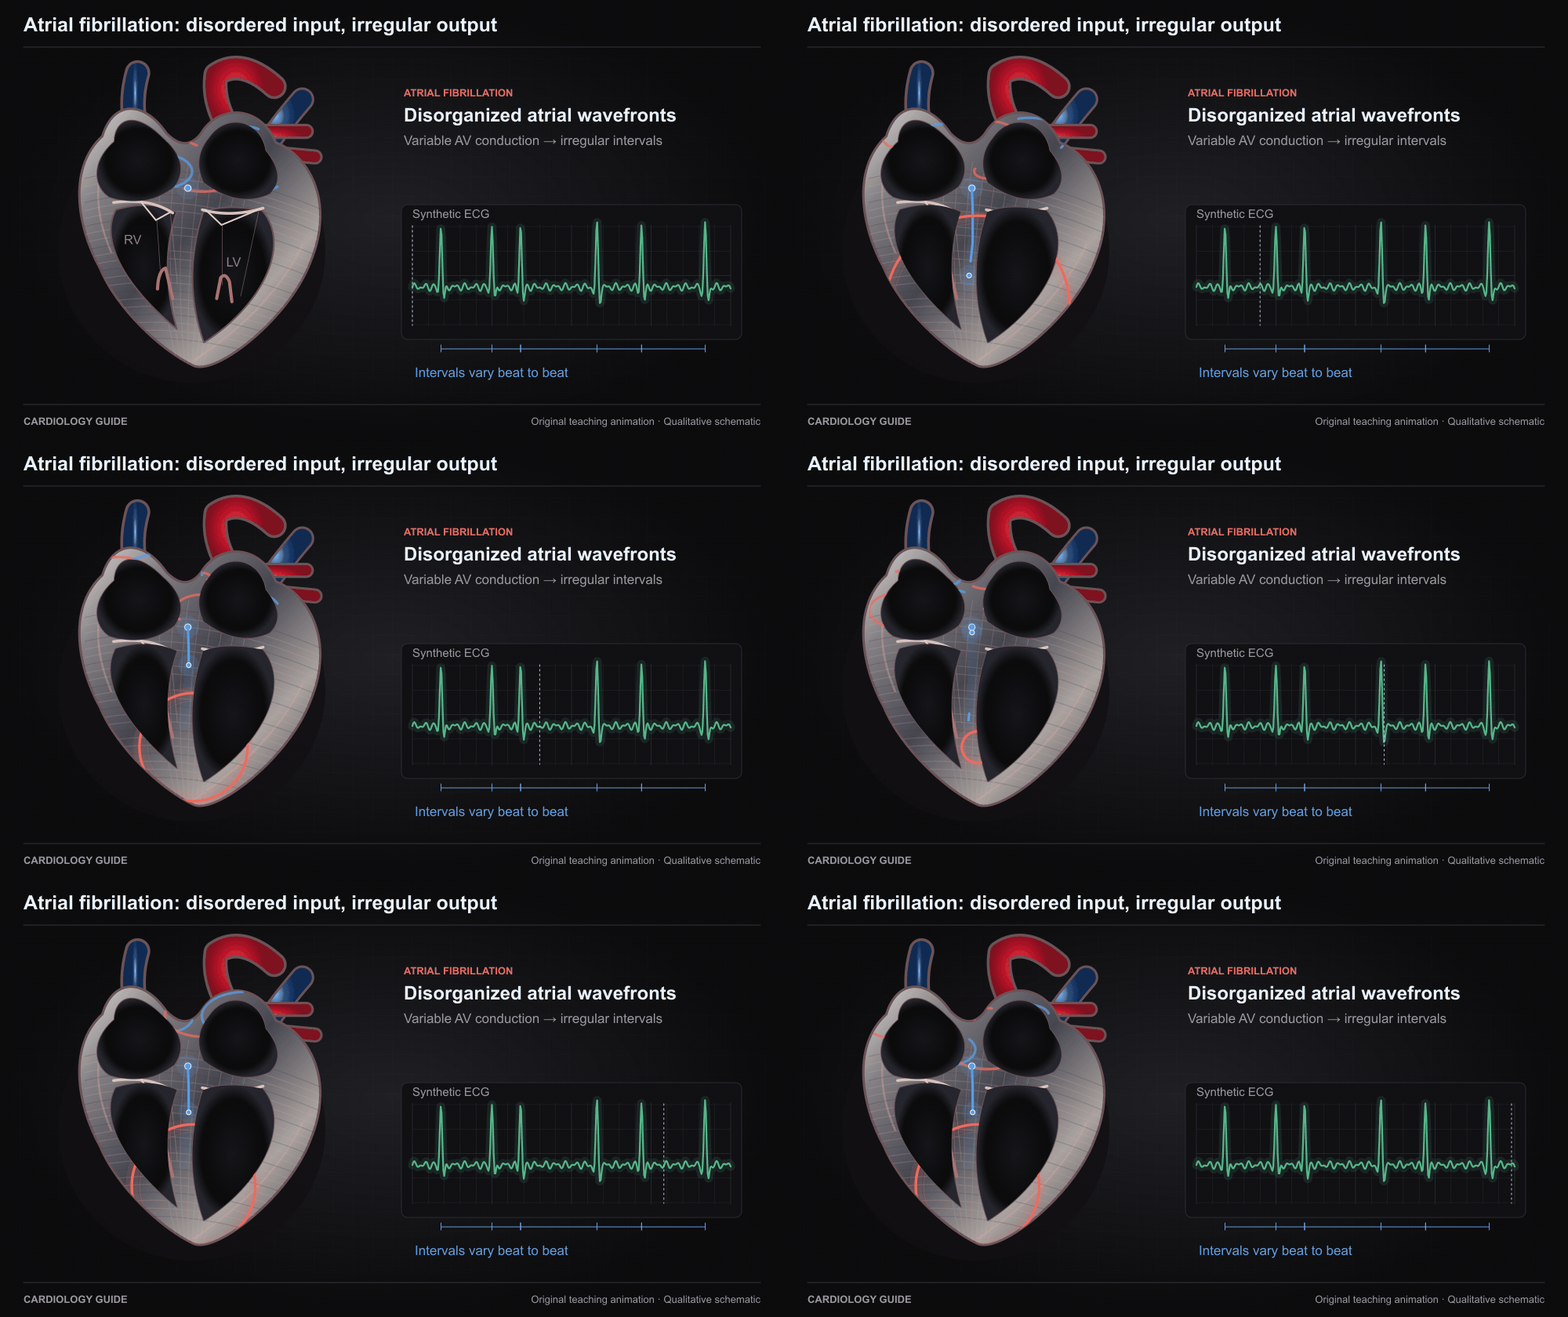
Atrial fibrillation: disordered input, irregular output

Disorganized atrial activation supplies variable impulses to the AV node, producing irregular ventricular intervals when conduction is intact. Synthetic tracing. AV block or pacing can make the ventricular rhythm regular.

Atrial Fibrillation · ECG Interpretation

Source and interpretation

2023 ACC/AHA/ACCP/HRS atrial fibrillation guideline

Original qualitative teaching schematic. Motion, particles and traces are illustrative. Timing and geometry are simplified.

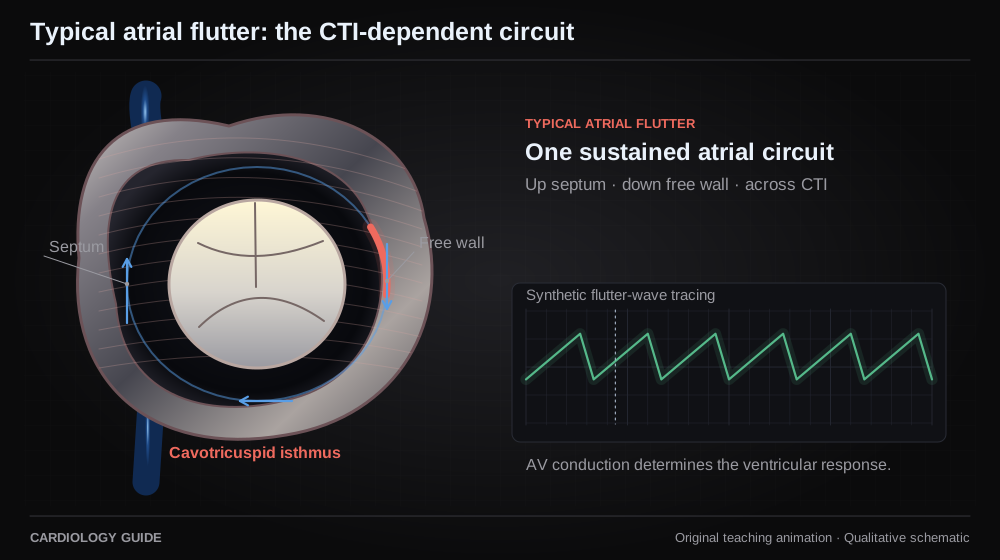
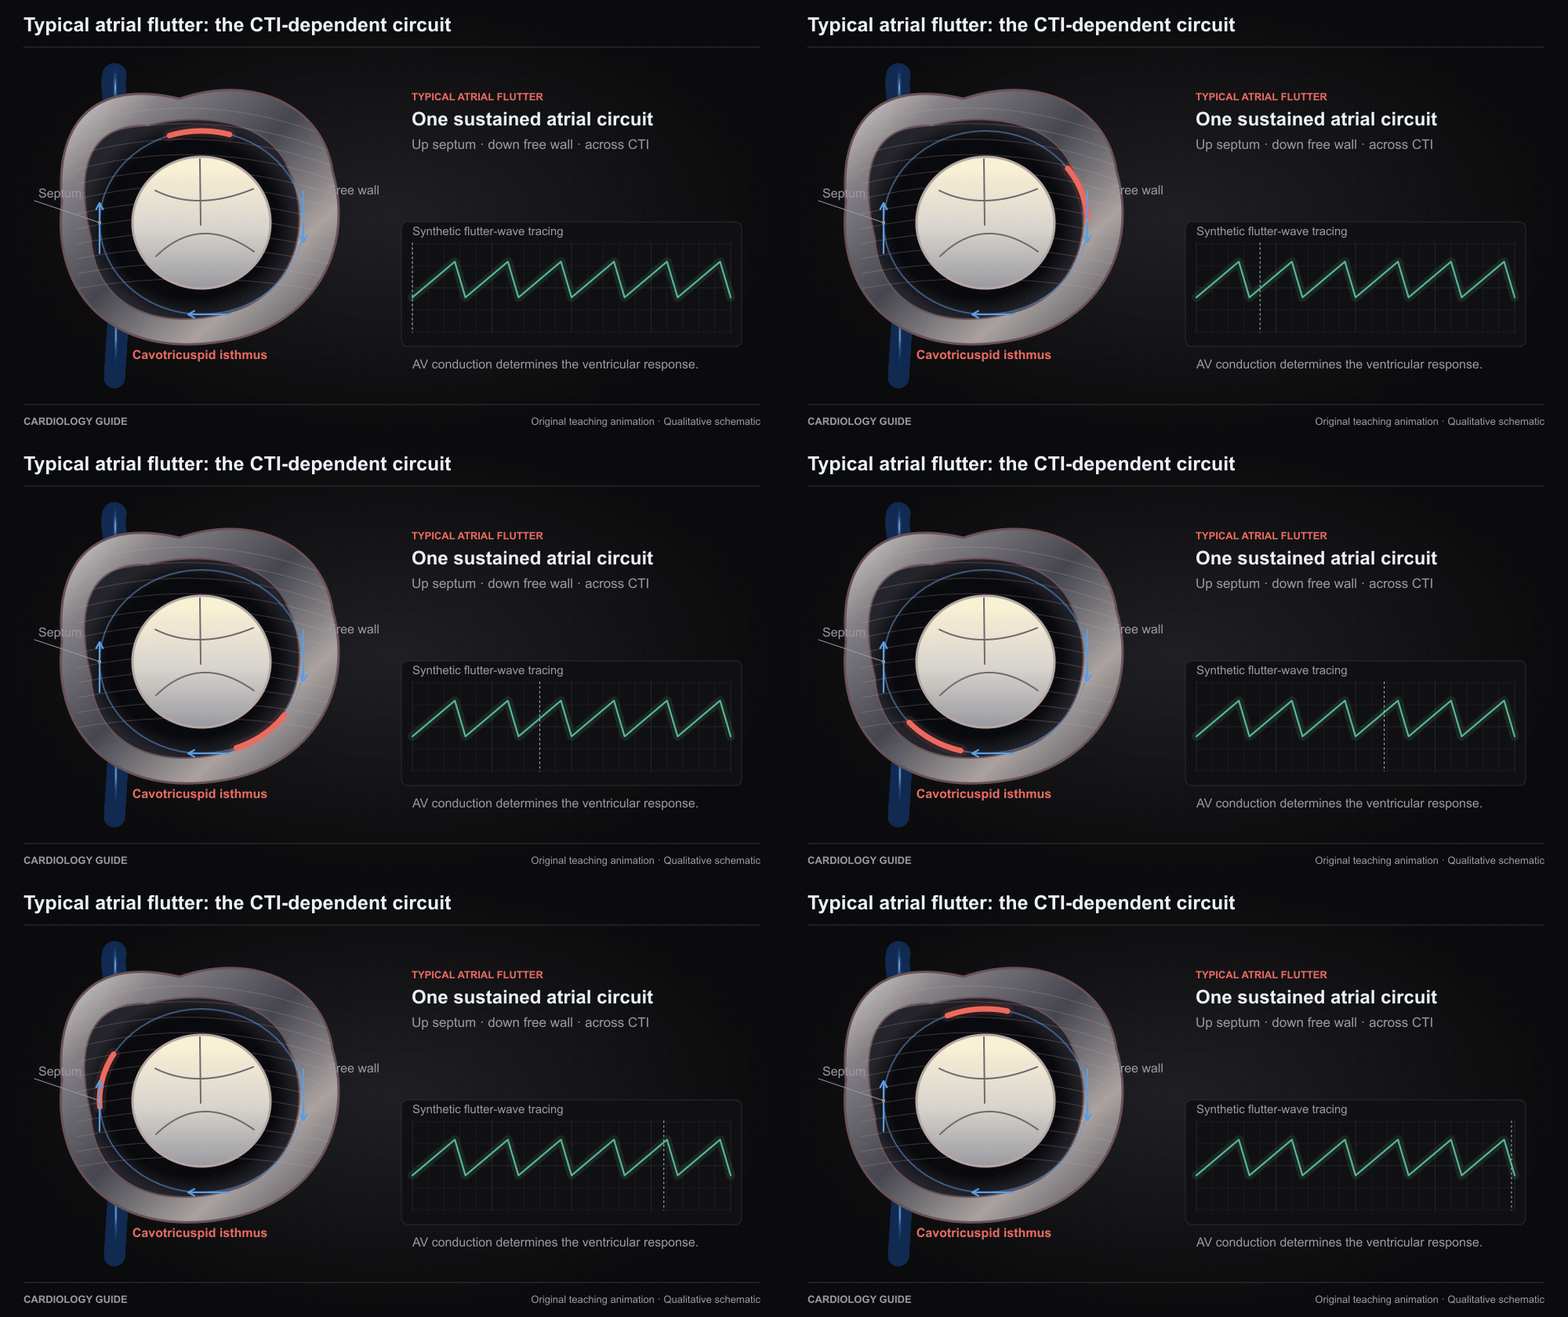
Typical atrial flutter: the CTI-dependent circuit

Typical CTI-dependent flutter travels up the right atrial septum, down the free wall, and through the cavotricuspid isthmus. This is a circuit schematic rather than an anatomical viewing orientation. The ECG is synthetic.

Atrial Fibrillation · ECG Interpretation

Source and interpretation

2015 ACC/AHA/HRS supraventricular tachycardia guideline

Original qualitative teaching schematic. Motion, particles and traces are illustrative. Timing and geometry are simplified.

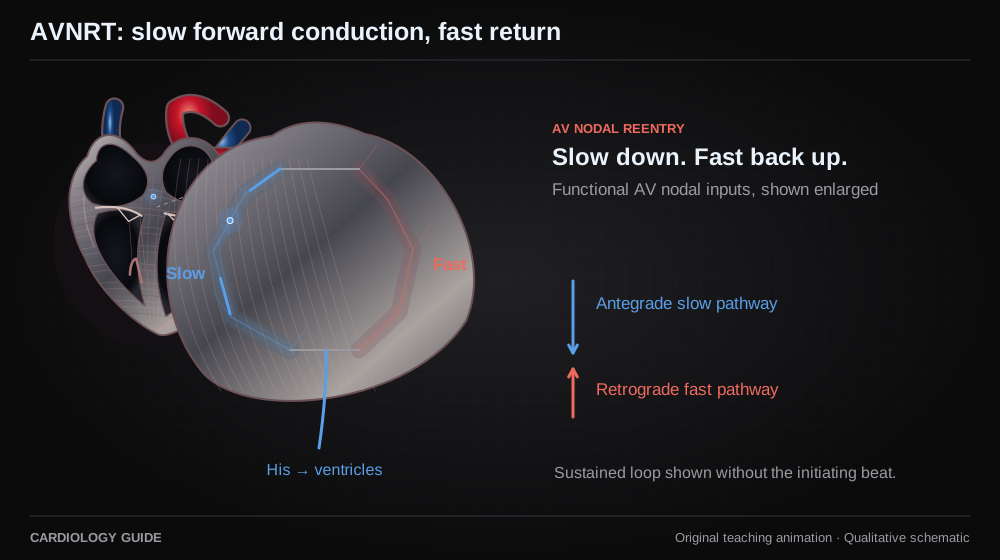
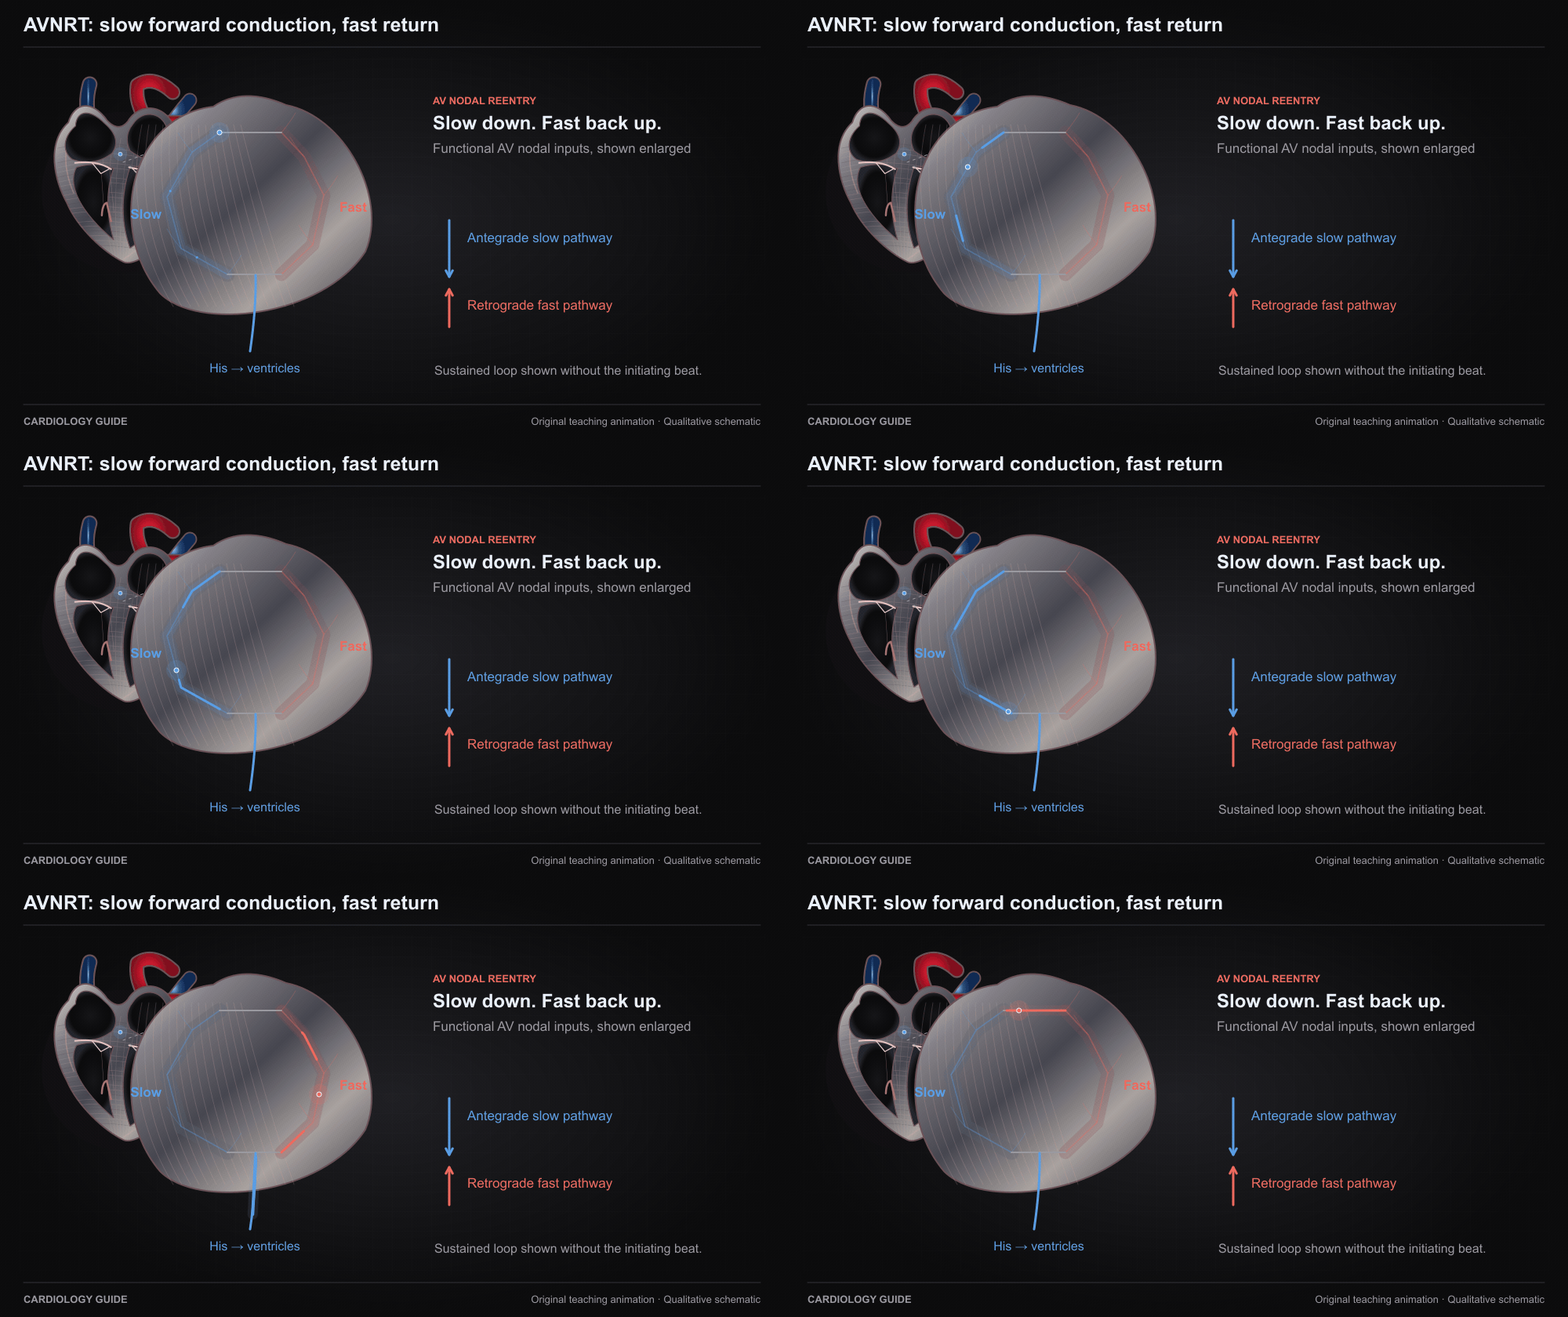
AVNRT: slow forward conduction, fast return

Typical slow–fast AV nodal reentrant tachycardia uses antegrade slow-pathway and retrograde fast-pathway conduction. Pathways represent functional AV nodal inputs, not separate visible tubes. Sustained circuit shown without initiation.

ECG Interpretation · Cardiology Pharmacology

Source and interpretation

2015 ACC/AHA/HRS supraventricular tachycardia guideline

Original qualitative teaching schematic. Motion, particles and traces are illustrative. Timing and geometry are simplified.

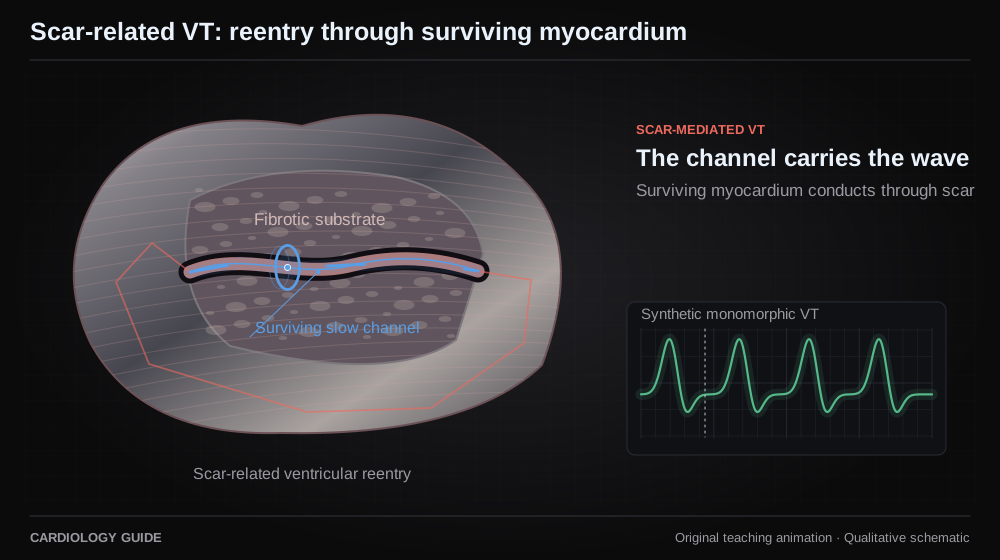
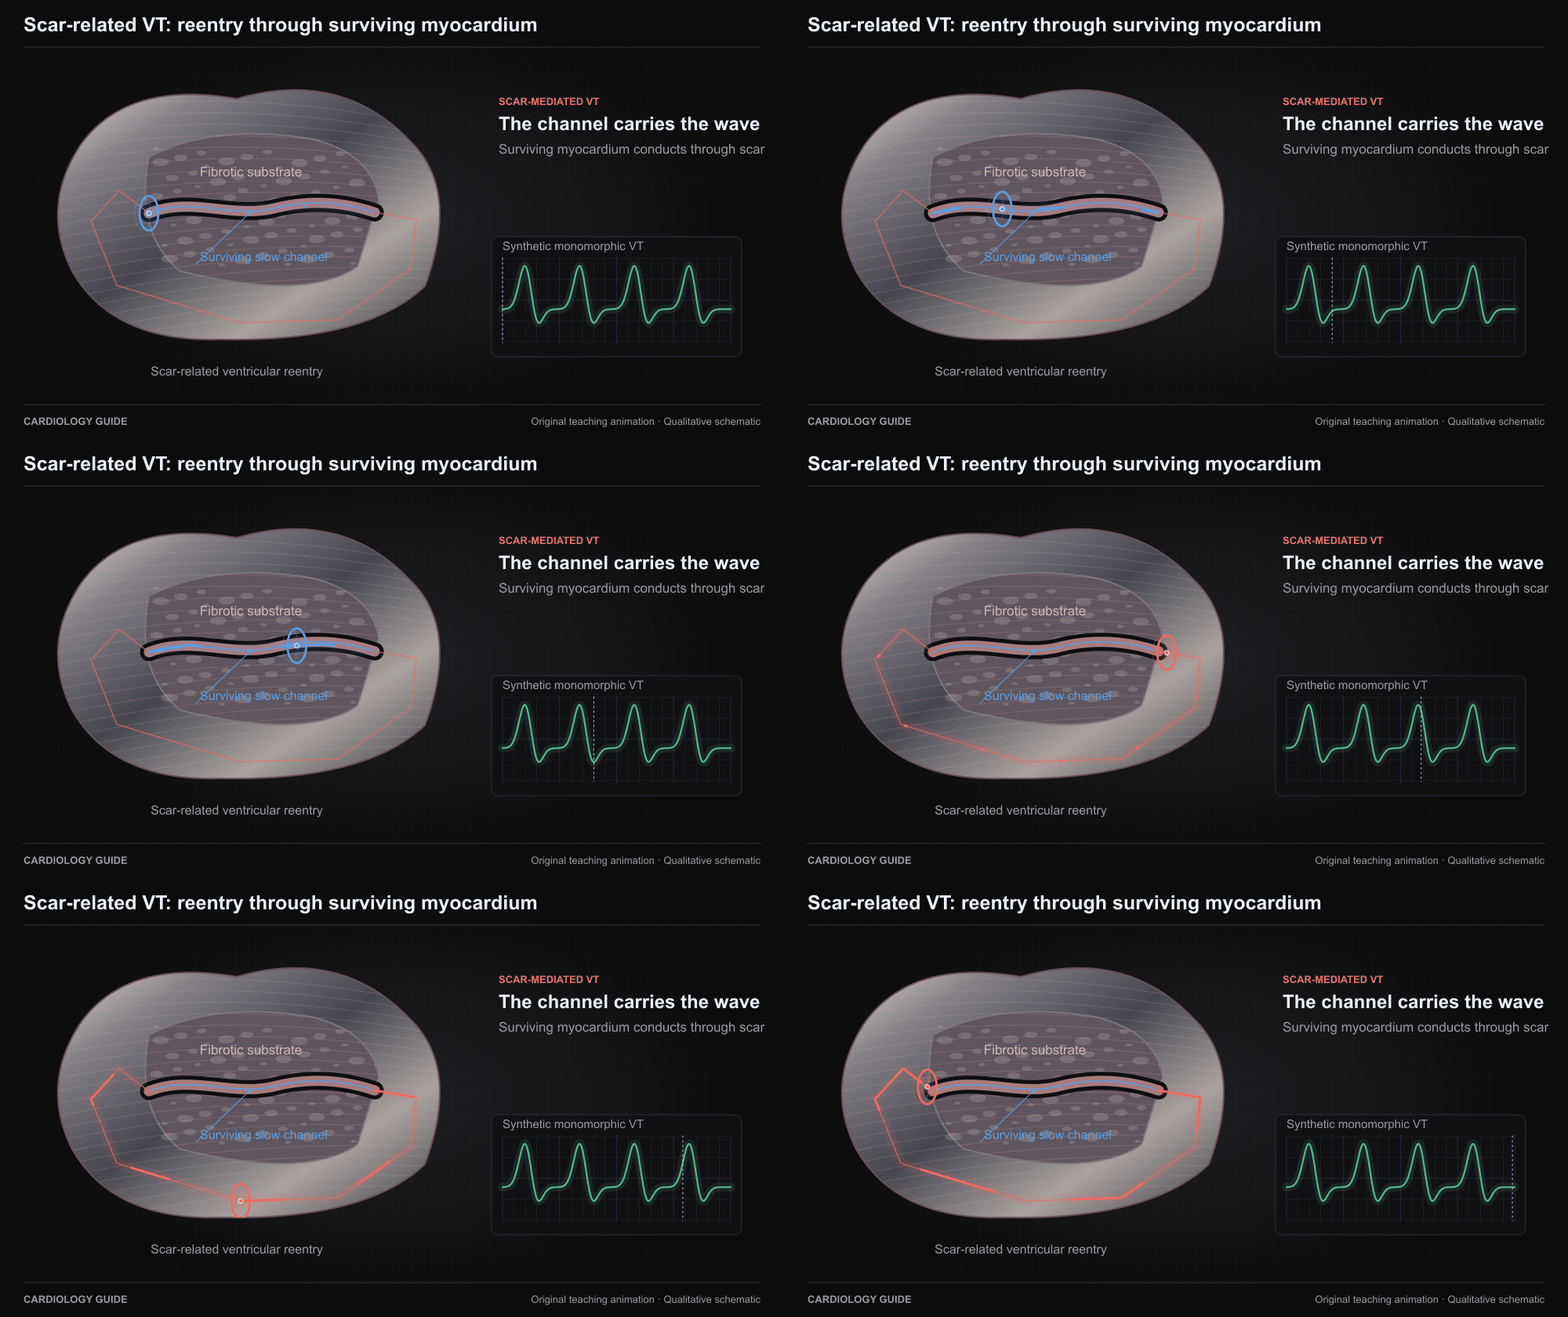
Scar-related VT: reentry through surviving myocardium

A surviving myocardial channel within or beside scar can sustain reentry with slow conduction and an exit to the ventricle. This is one simplified scar-related mechanism, not a map of a patient or all ventricular tachycardias.

Ventricular Tachycardia: Diagnostic Workup · ECG Interpretation

Source and interpretation

2019 HRS/EHRA/APHRS/LAHRS ventricular arrhythmia ablation consensus

Original qualitative teaching schematic. Motion, particles and traces are illustrative. Timing and geometry are simplified.

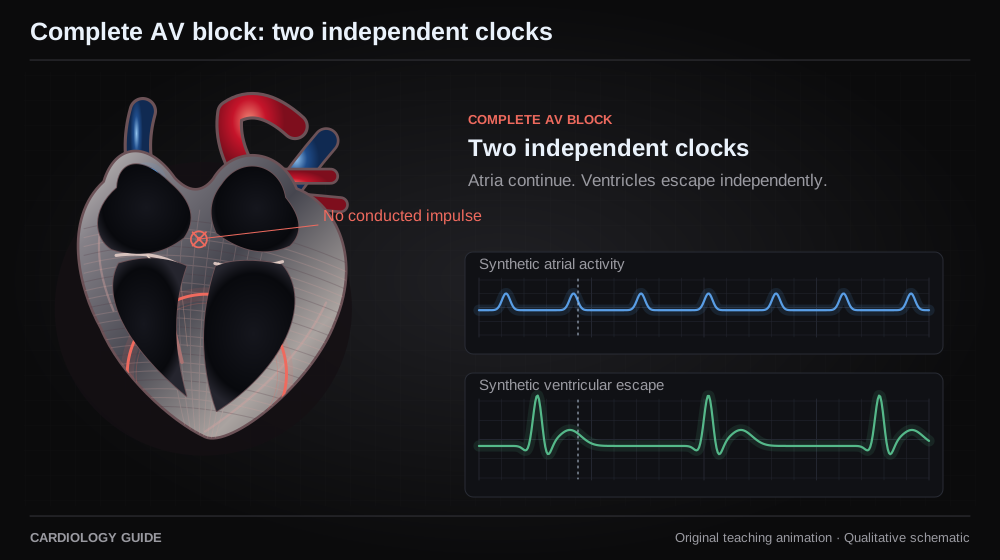
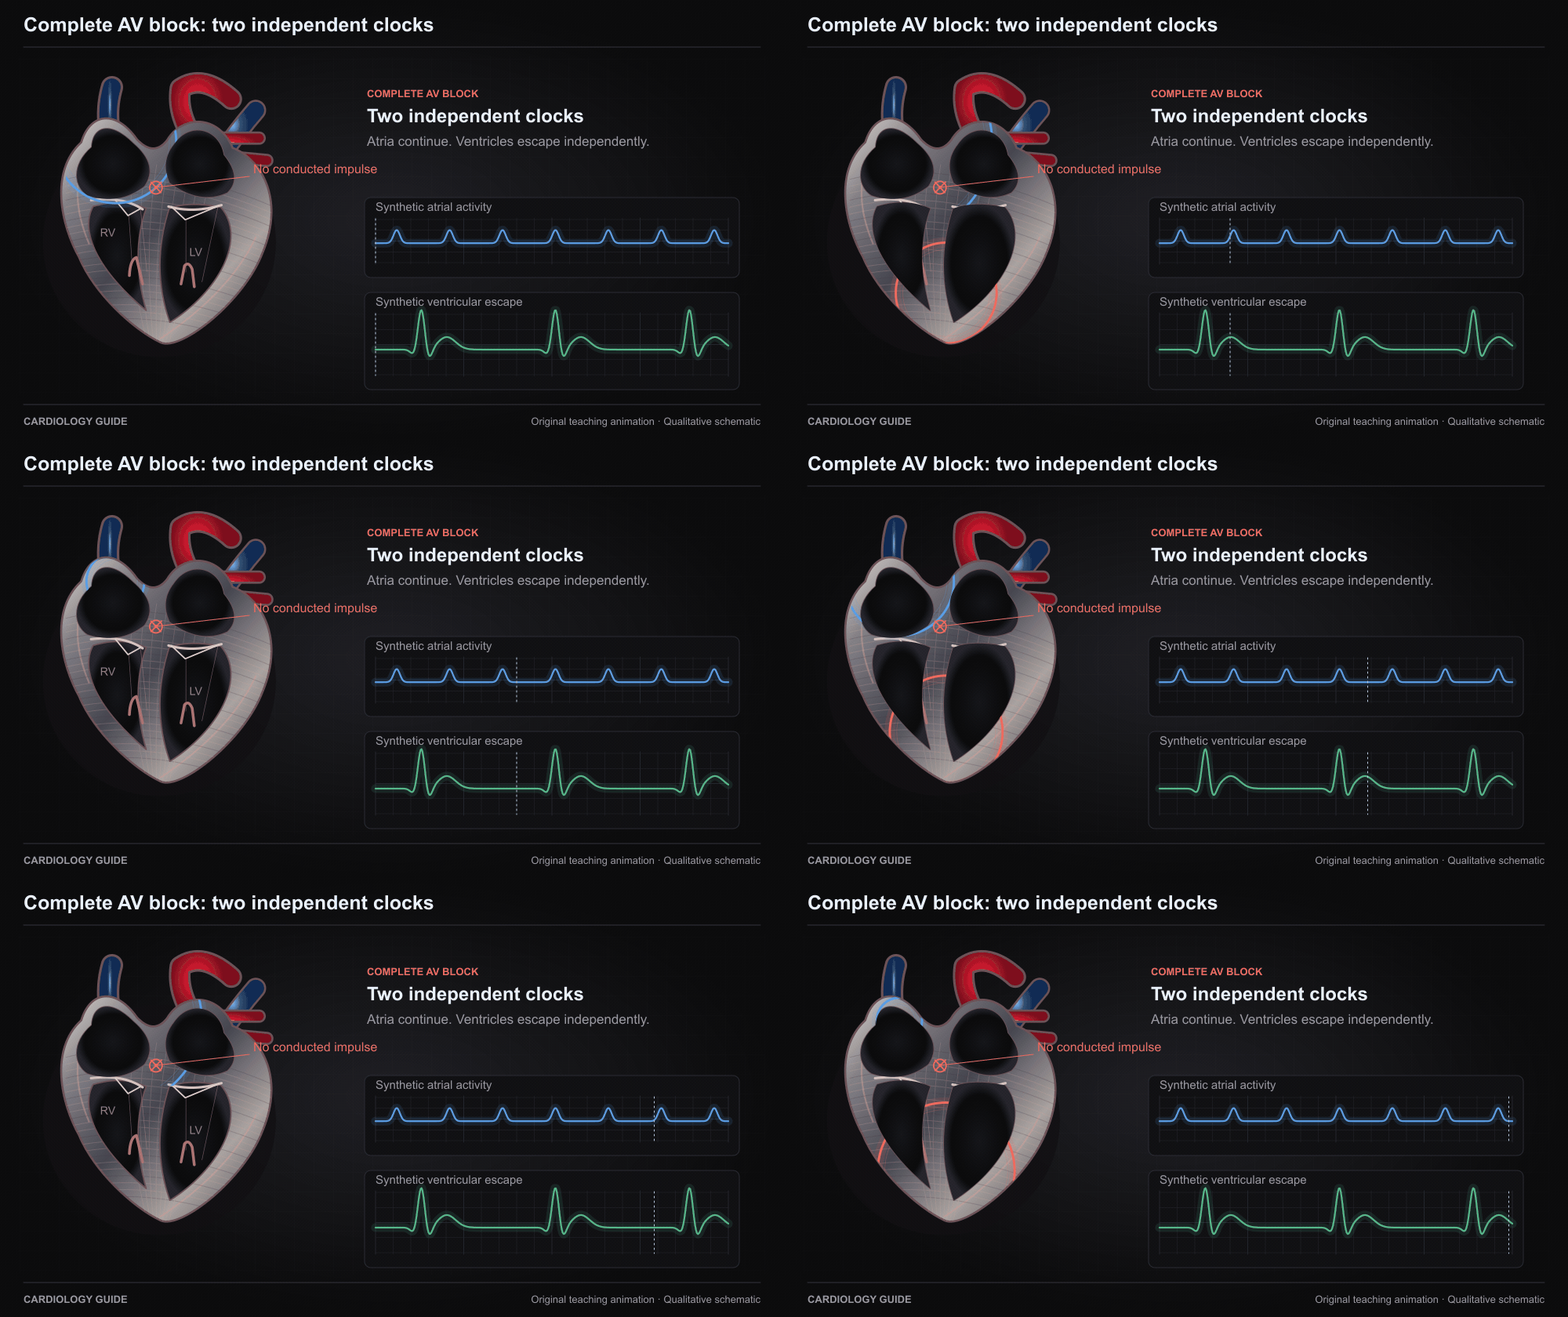
Complete AV block: two independent clocks

In complete AV block, atrial impulses do not conduct to the ventricles. A slower escape rhythm can continue independently. Synthetic ladder and tracing. AV dissociation alone does not prove complete AV block.

ECG Interpretation · Syncope, Bradycardia & Pacing

Source and interpretation

2018 ACC/AHA/HRS bradycardia and conduction delay guideline

Original qualitative teaching schematic. Motion, particles and traces are illustrative. Timing and geometry are simplified.

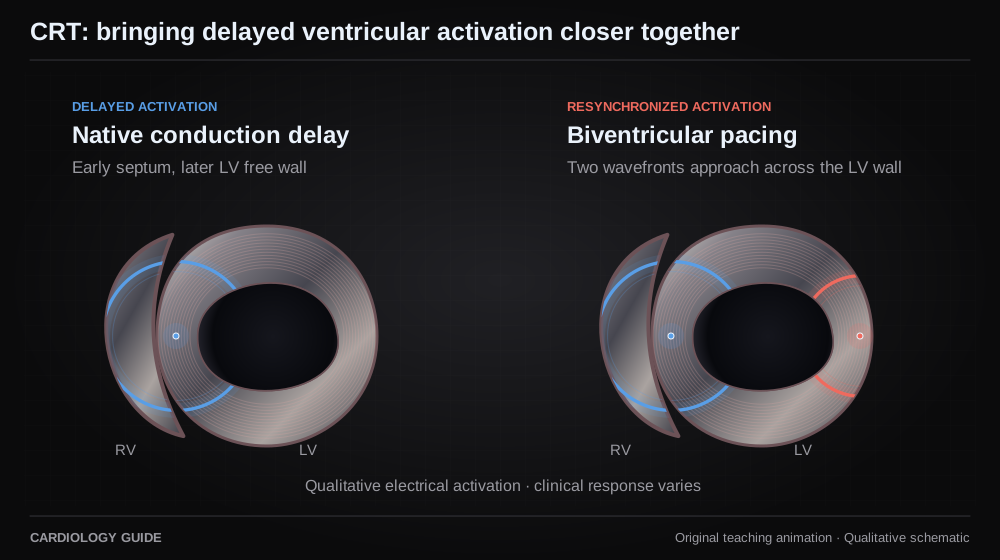
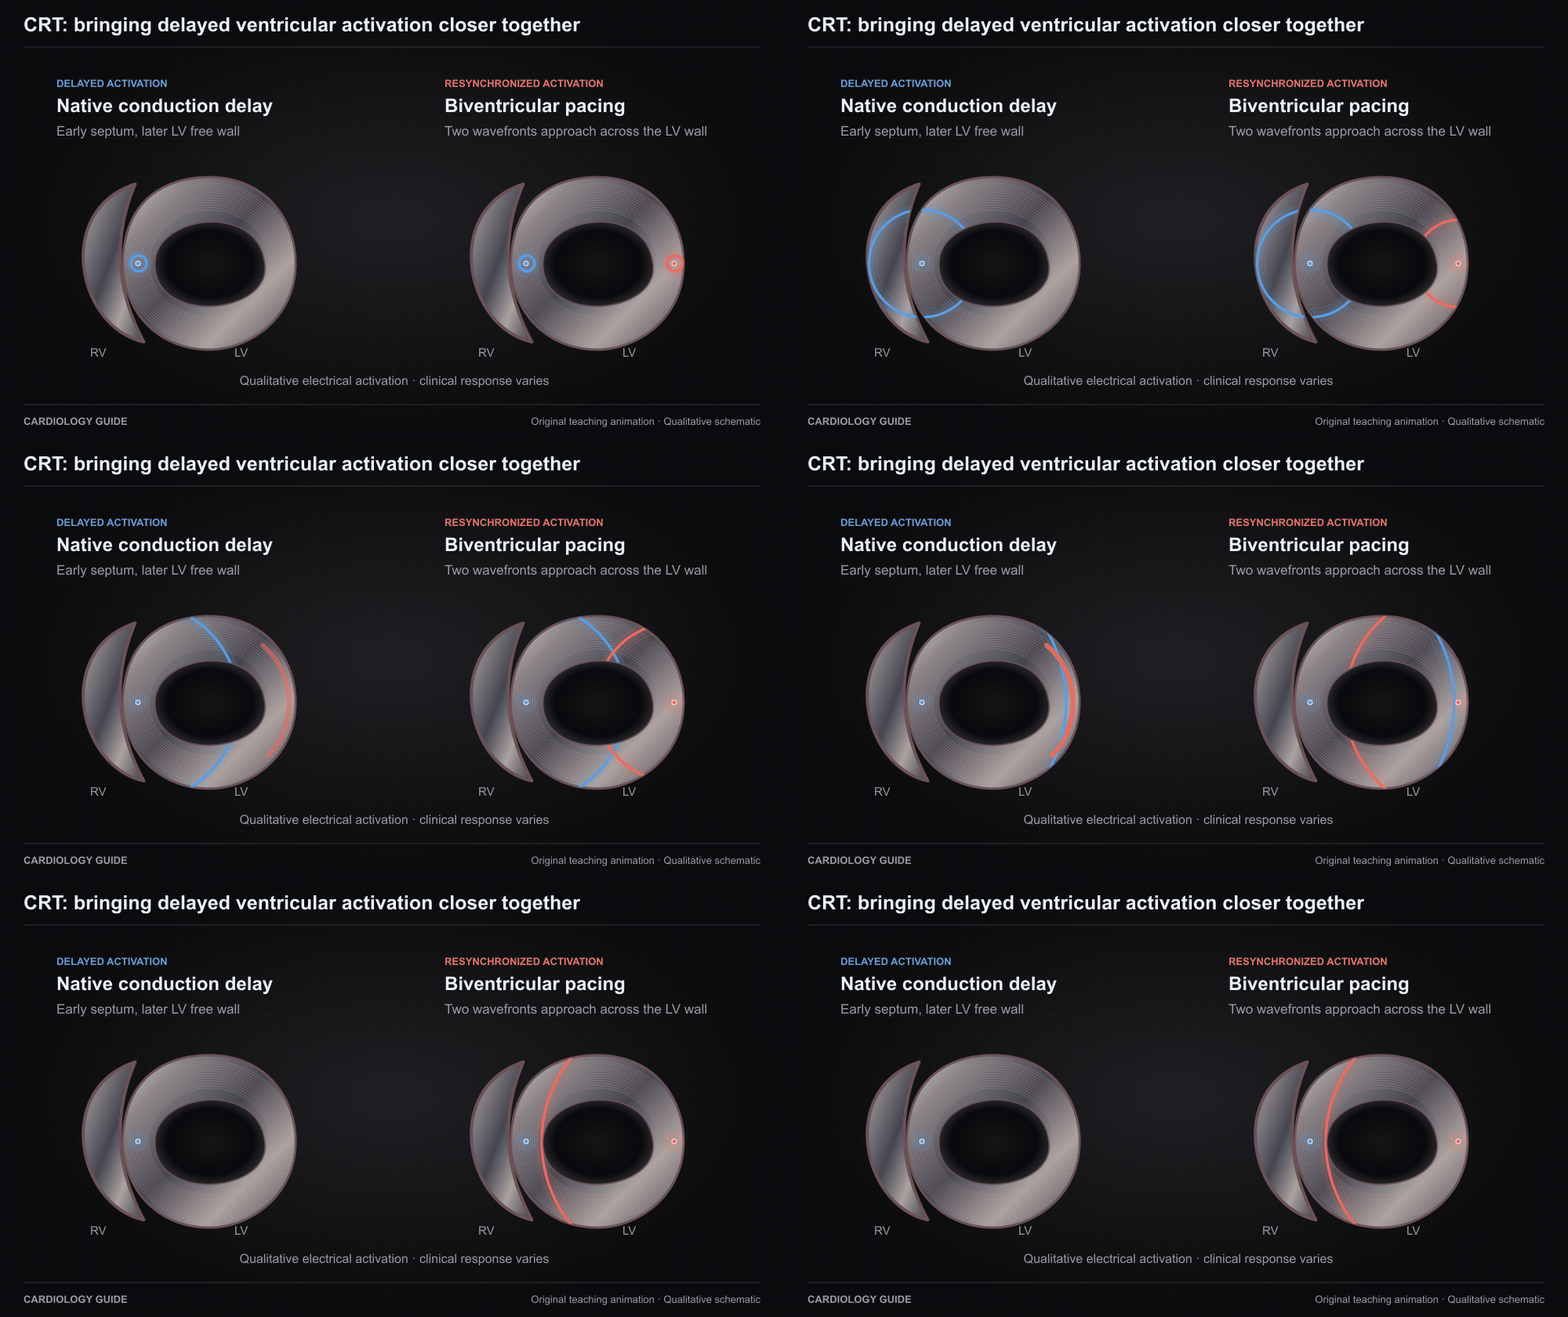
CRT: bringing delayed ventricular activation closer together

The left schematic illustrates delayed LV activation. The right shows two pacing sites launching more coordinated activation. A qualitative electrical model of biventricular CRT, not a prediction of mechanical response or benefit.

Heart Failure Comprehensive · Syncope, Bradycardia & Pacing · ECG Interpretation

Source and interpretation

2023 HRS/APHRS/LAHRS cardiac physiologic pacing guideline

Original qualitative teaching schematic. Motion, particles and traces are illustrative. Timing and geometry are simplified.

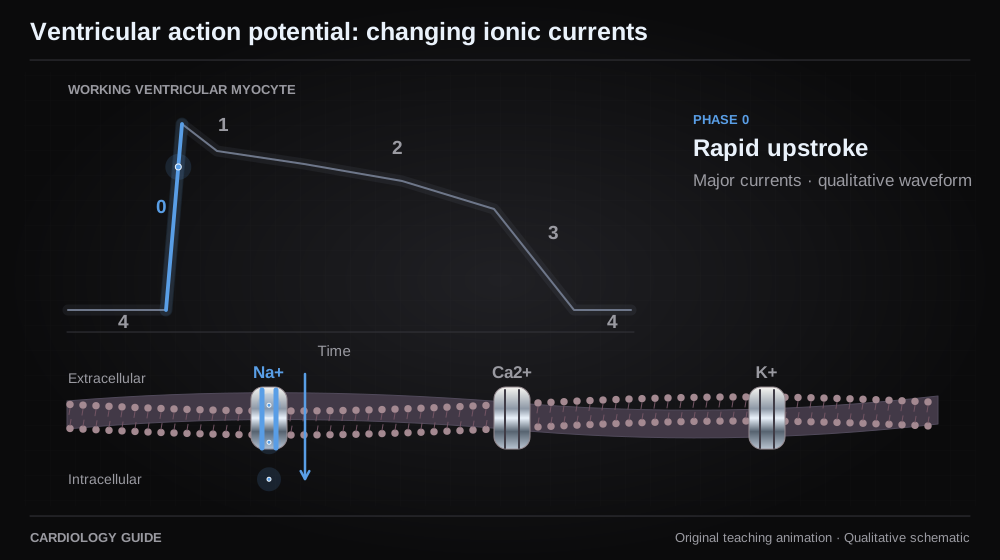
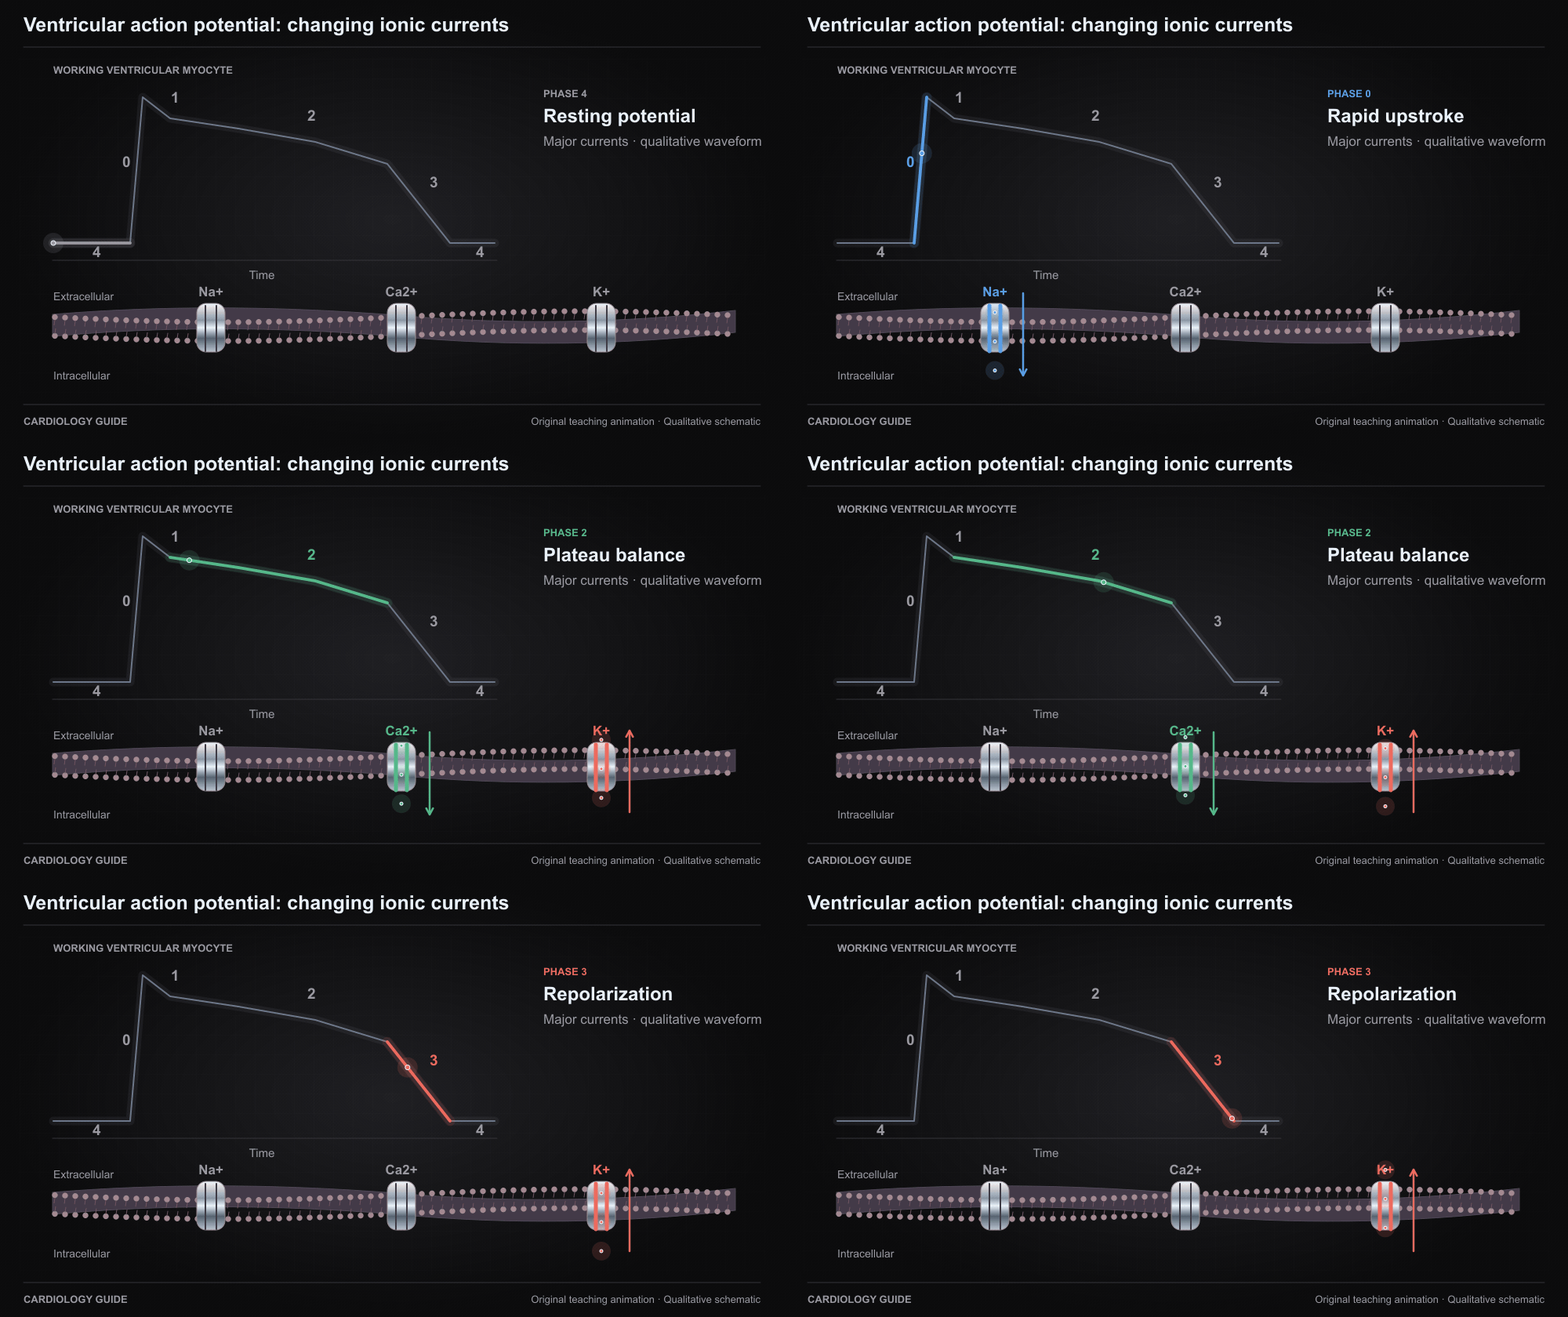
Ventricular action potential: changing ionic currents

A qualitative working ventricular myocyte action potential highlights sodium entry, early potassium efflux, the calcium–potassium plateau balance, and repolarization. Major currents only. Not a pacemaker-cell waveform or a quantitative simulation.

Cardiology Pharmacology · ECG Interpretation

Source and interpretation

2025 EHRA practical compendium of antiarrhythmic drugs

Original qualitative teaching schematic. Motion, particles and traces are illustrative. Timing and geometry are simplified.

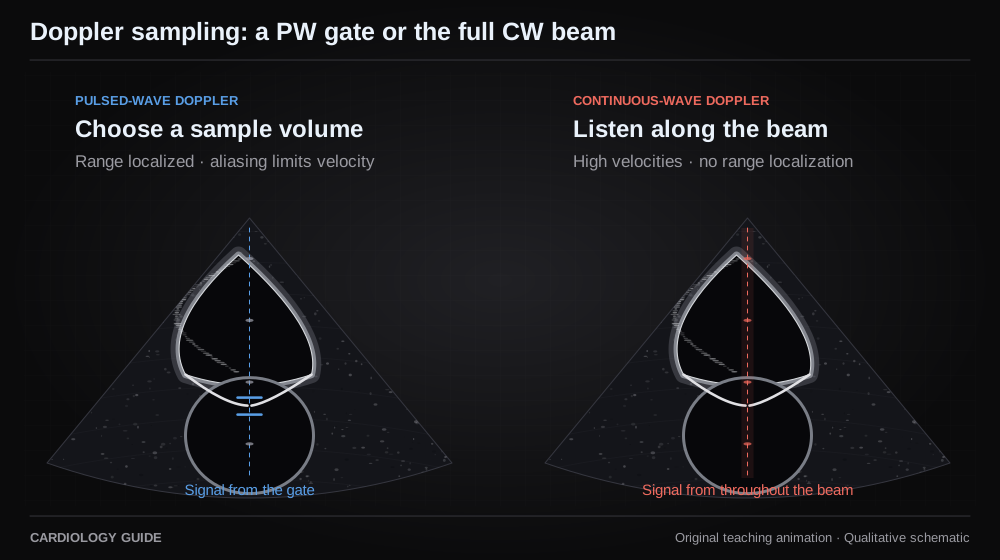
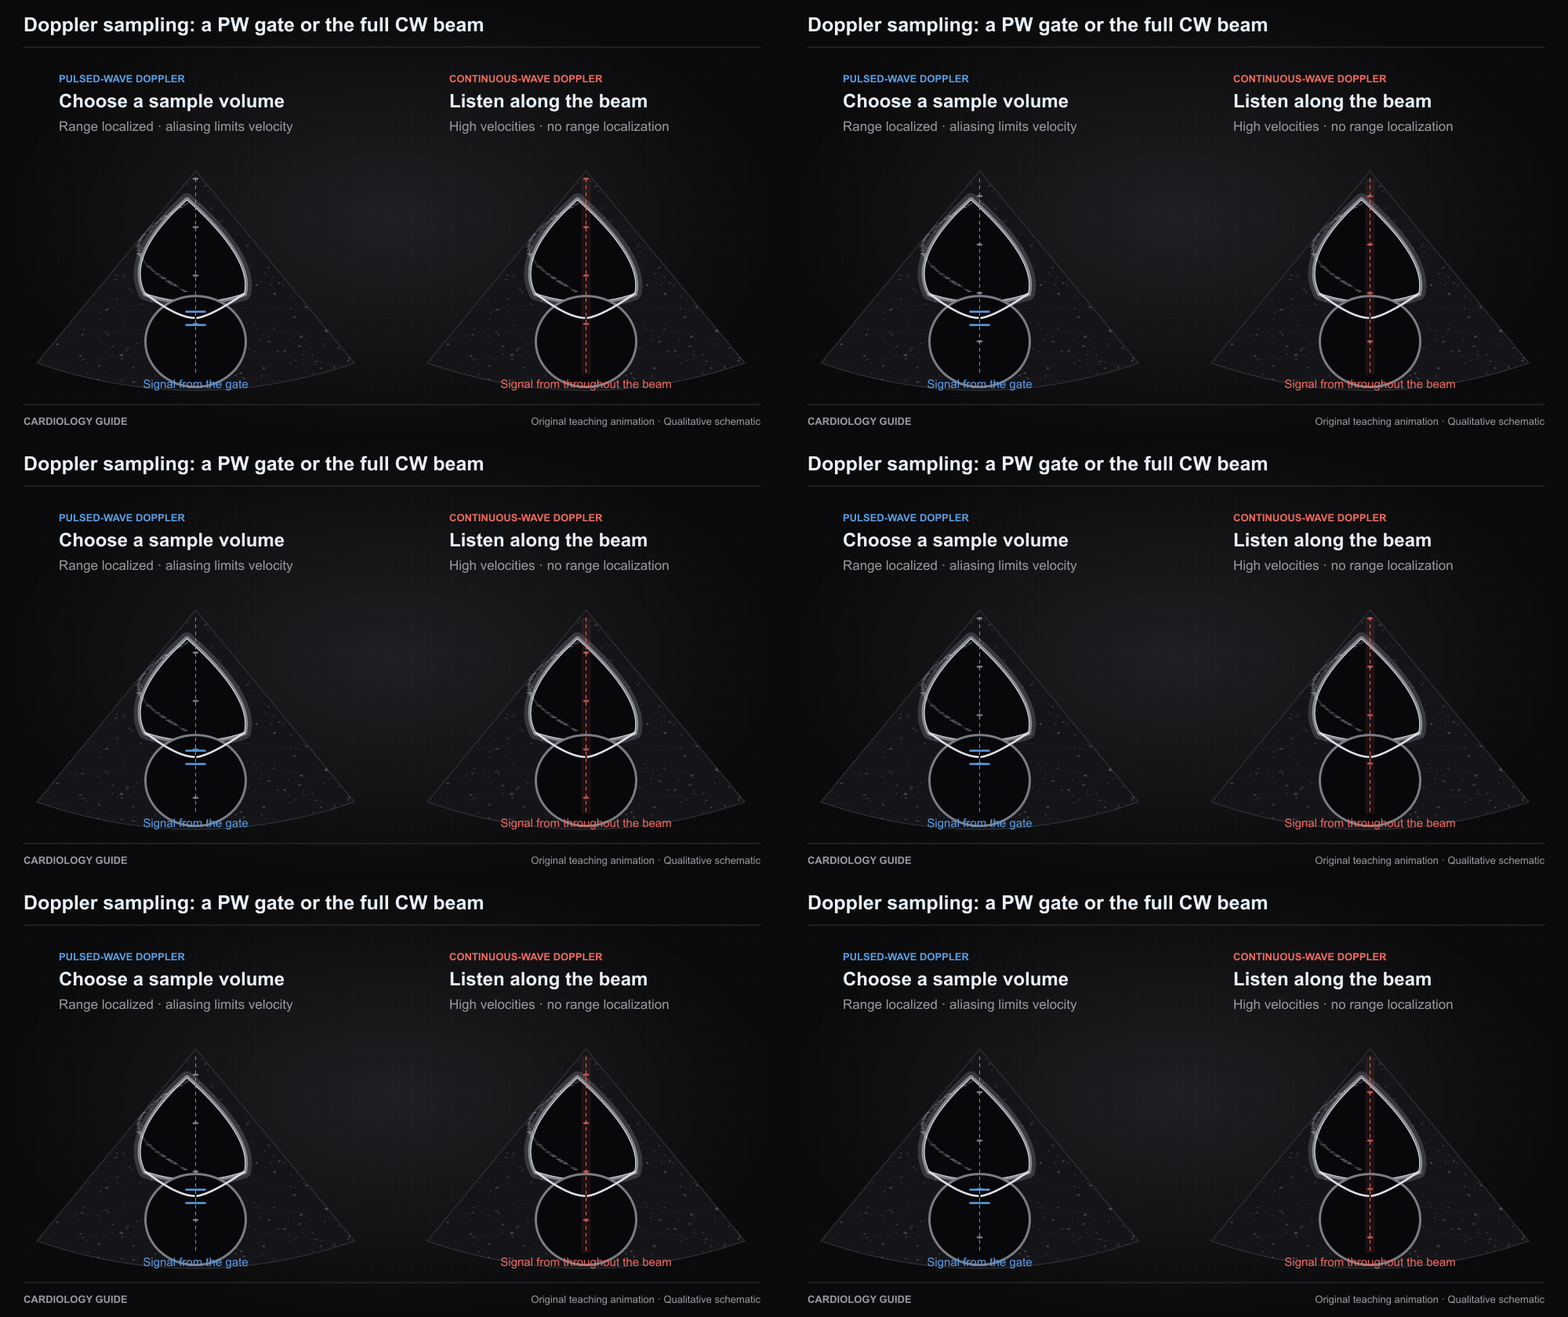
Doppler sampling: a PW gate or the full CW beam

Pulsed-wave Doppler localizes measurement to a selected sample volume but is subject to aliasing. Continuous-wave Doppler receives along the beam without depth localization and can measure high velocities. Synthetic ultrasound view, without calculated velocities.

Echo Guide — Physics, Diastology & Valve Quantitation

Source and interpretation

ASE · Comprehensive transthoracic echocardiography in adults

Original qualitative teaching schematic. Motion, particles and traces are illustrative. Timing and geometry are simplified.

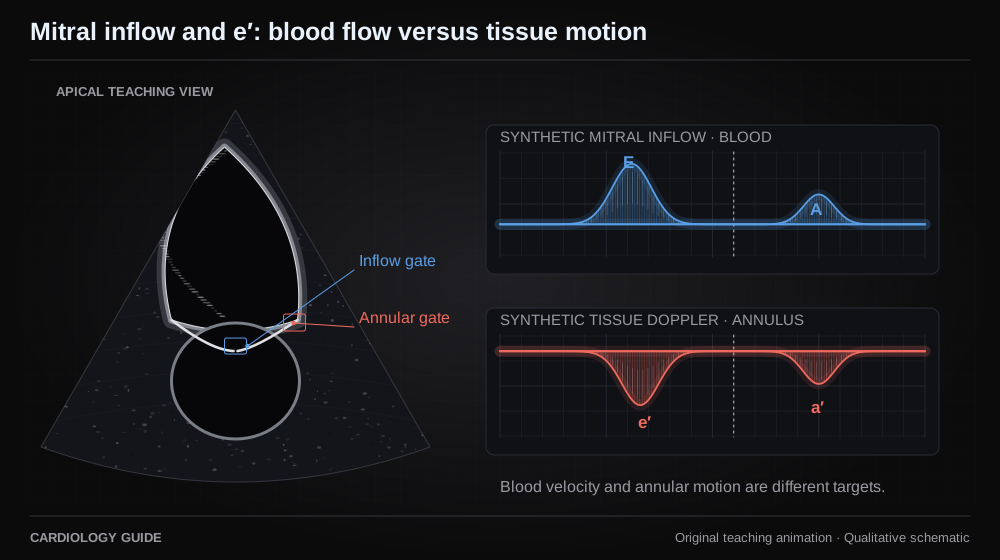
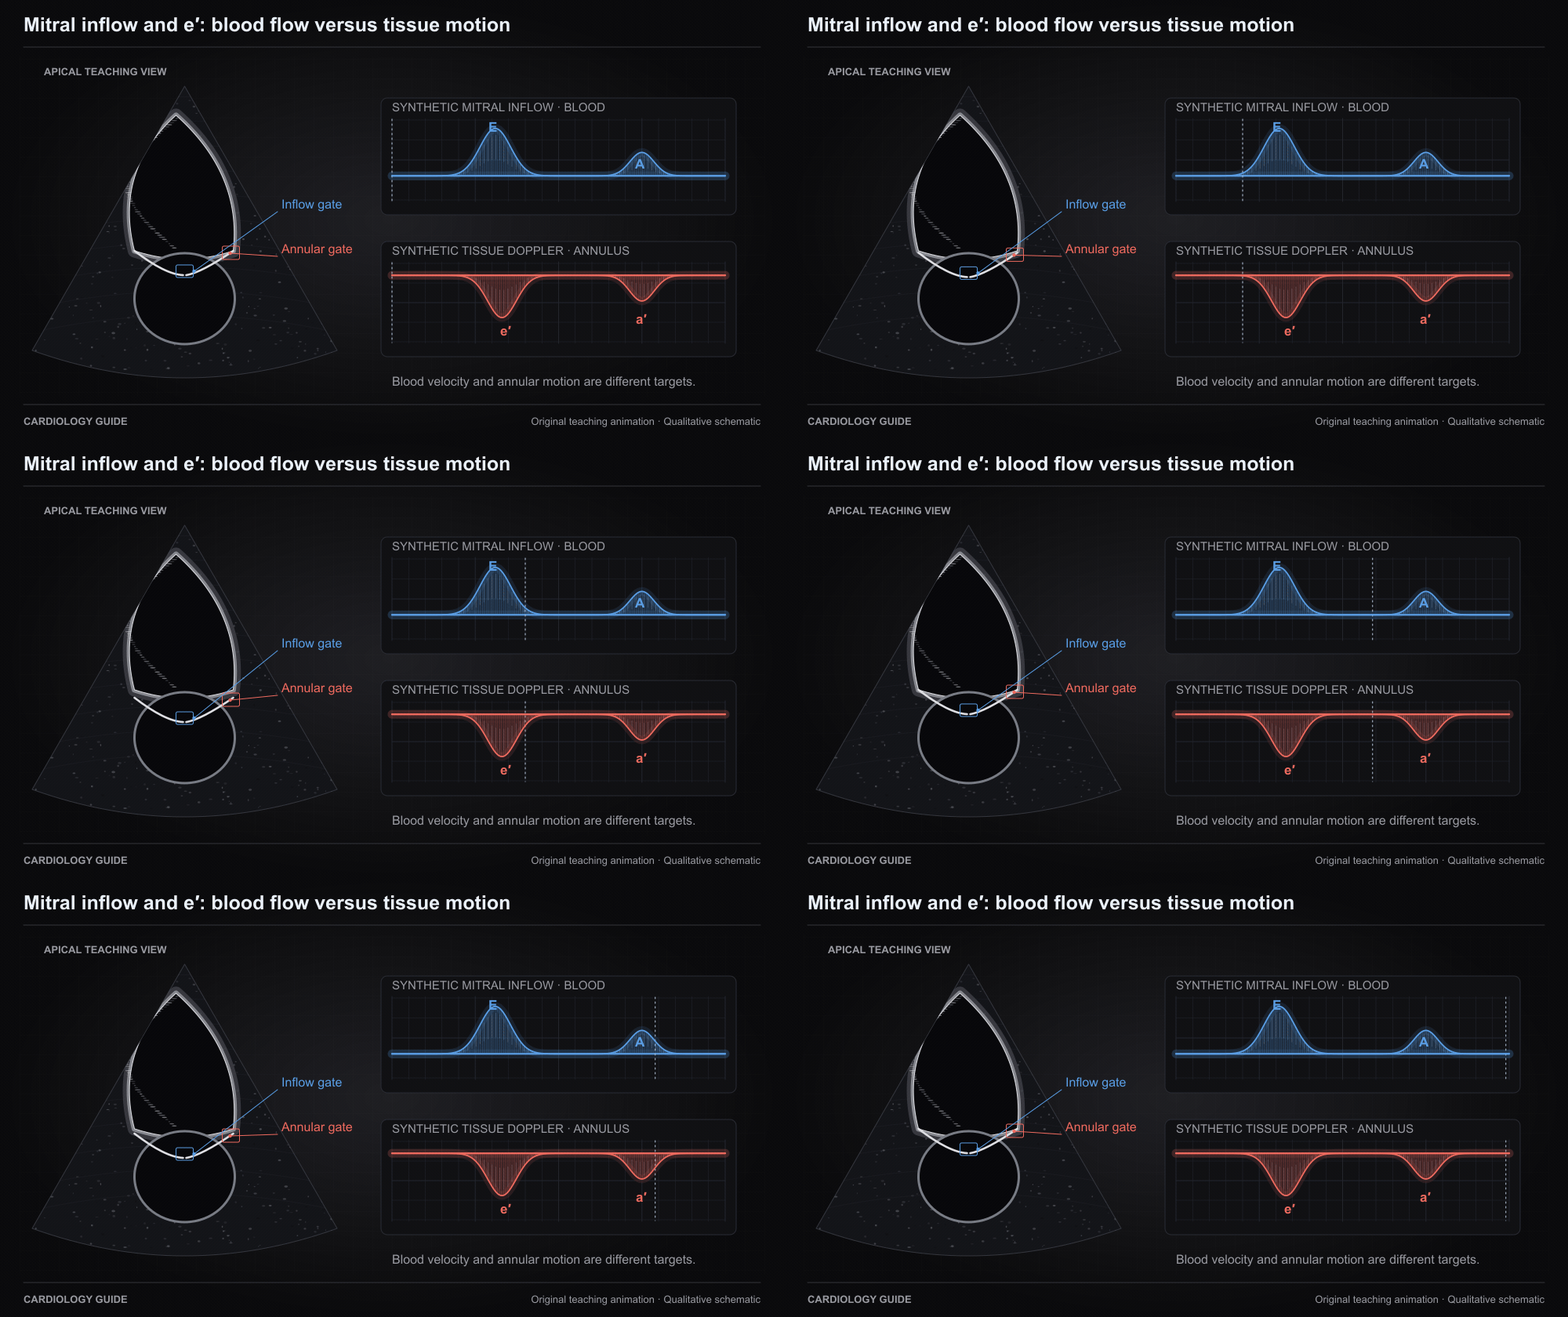
Mitral inflow and e′: blood flow versus tissue motion

Mitral inflow E samples early filling blood velocity at the leaflet tips. Tissue Doppler e′ samples early diastolic mitral annular motion. The two measure different targets. Synthetic ultrasound and spectra, without numeric pressure estimation.

Echo Guide — Physics, Diastology & Valve Quantitation · Heart Failure Comprehensive

Source and interpretation

ASE · Comprehensive transthoracic echocardiography in adults

Original qualitative teaching schematic. Motion, particles and traces are illustrative. Timing and geometry are simplified.

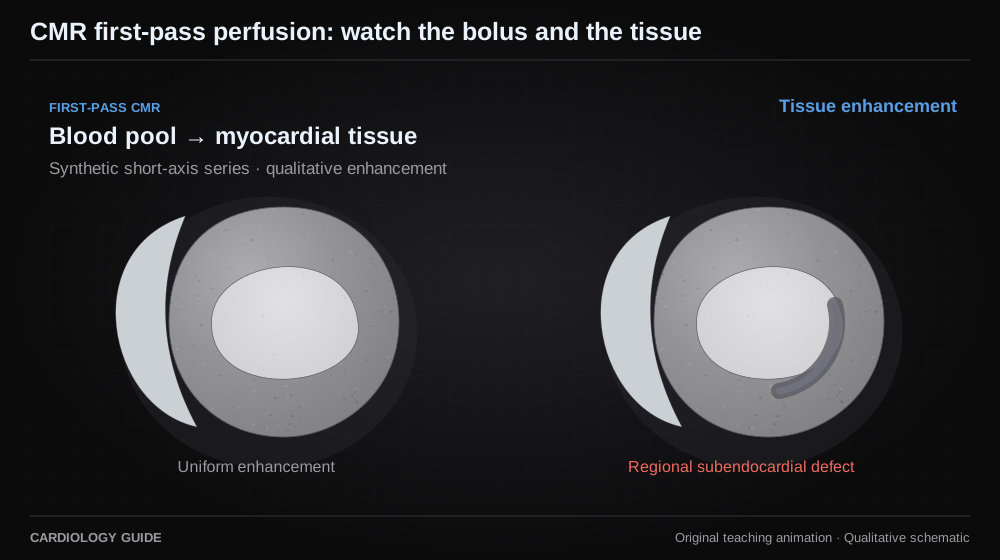
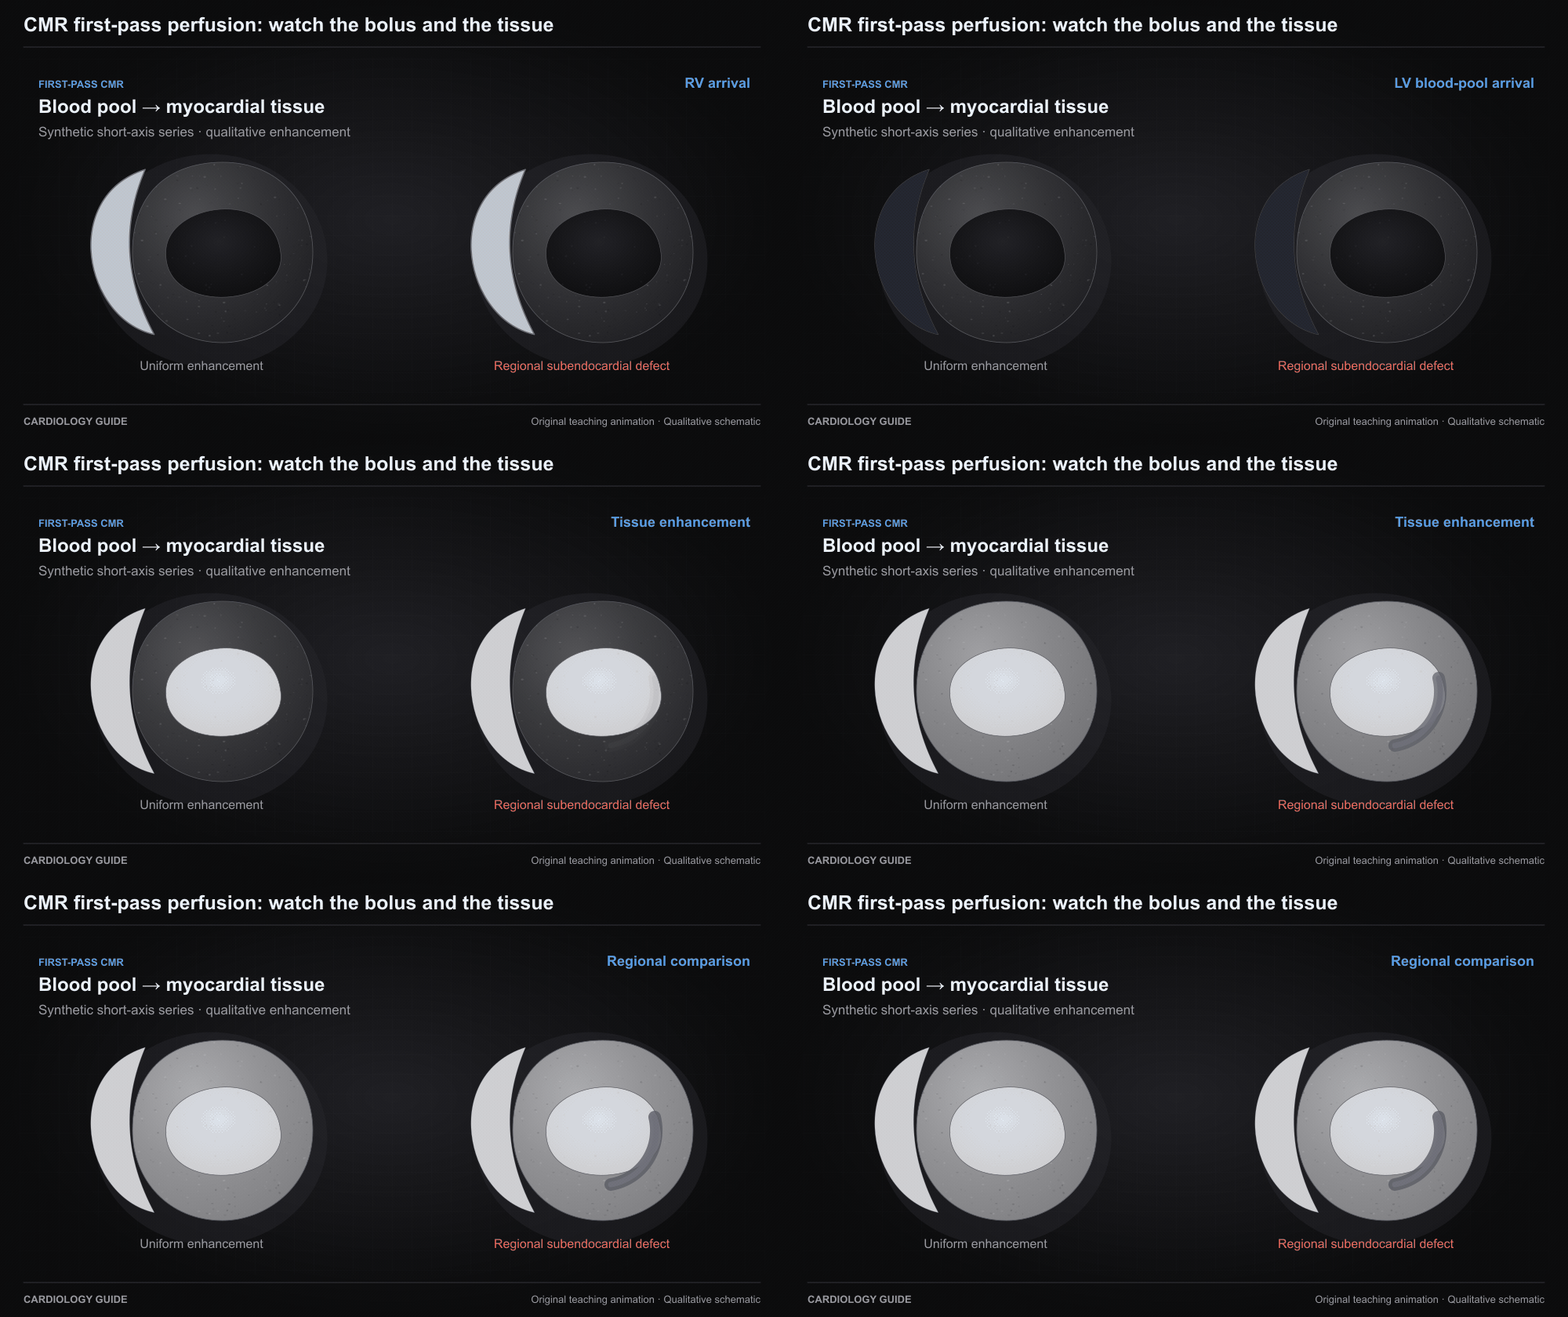
CMR first-pass perfusion: watch the bolus and the tissue

A synthetic first-pass sequence shows contrast reaching the RV, then LV blood pool, then myocardial tissue. A persistent regional subendocardial defect is illustrated. Not acquired CMR. Artifacts and rest or LGE comparison must be assessed separately.

Cardiac MRI · Nuclear Cardiology — Physics, Perfusion & Molecular Imaging

Source and interpretation

SCMR · Standardized CMR interpretation and post-processing, 2020

Original qualitative teaching schematic. Motion, particles and traces are illustrative. Timing and geometry are simplified.

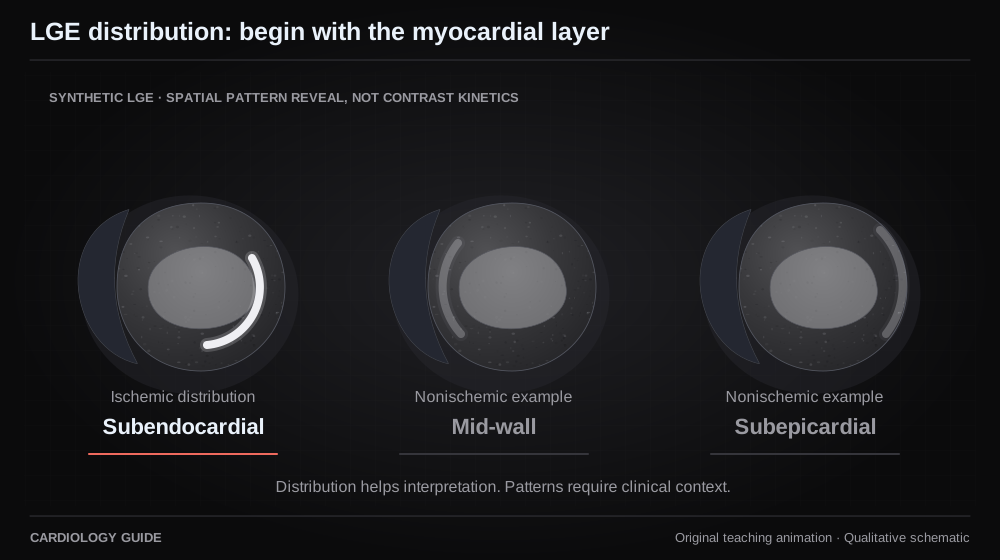
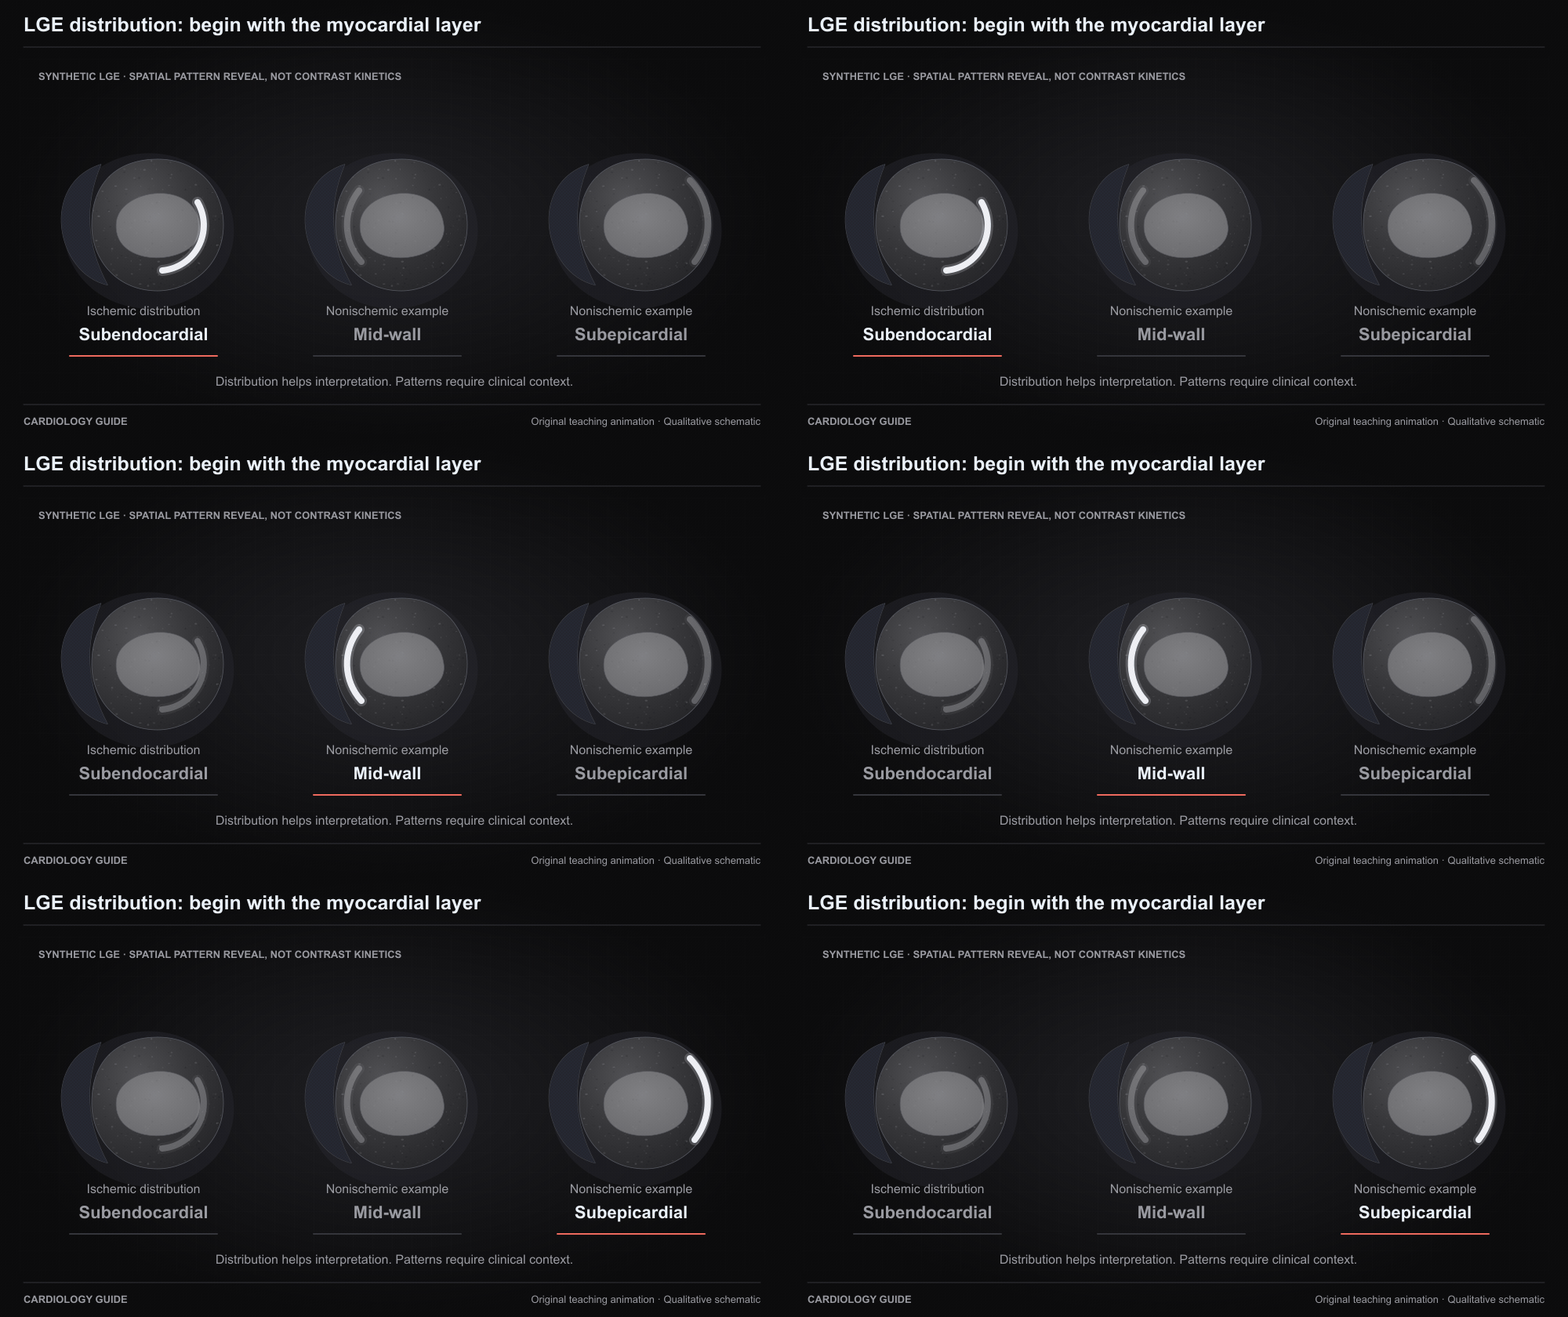
LGE distribution: begin with the myocardial layer

Synthetic short-axis tissue views compare an ischemic subendocardial pattern with example nonischemic mid-wall and subepicardial patterns. The reveal sequence teaches spatial distribution, not contrast kinetics. Patterns need clinical context and are not disease-specific.

Cardiac MRI · Myocarditis · Genetic Cardiomyopathies

Source and interpretation

SCMR · Standardized CMR interpretation and post-processing, 2020

Original qualitative teaching schematic. Motion, particles and traces are illustrative. Timing and geometry are simplified.

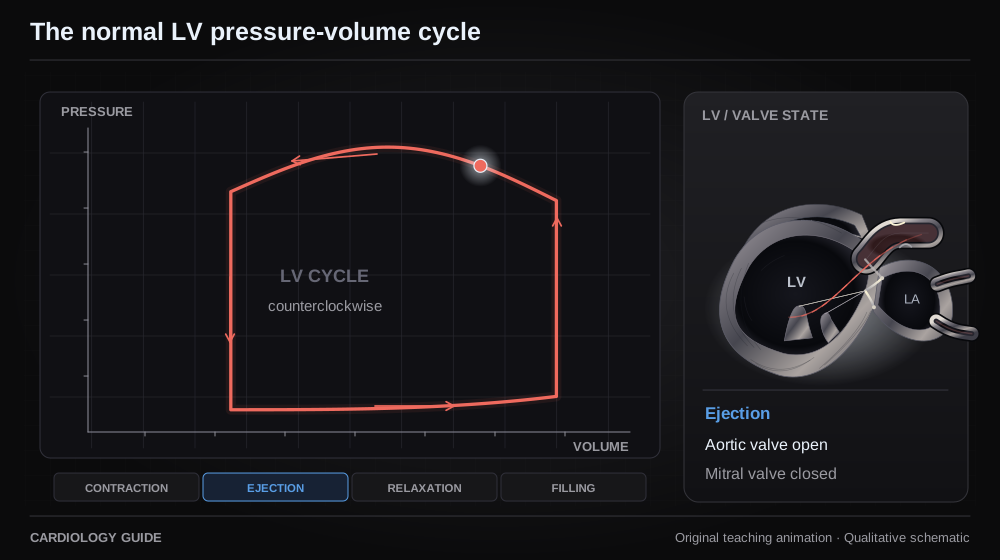
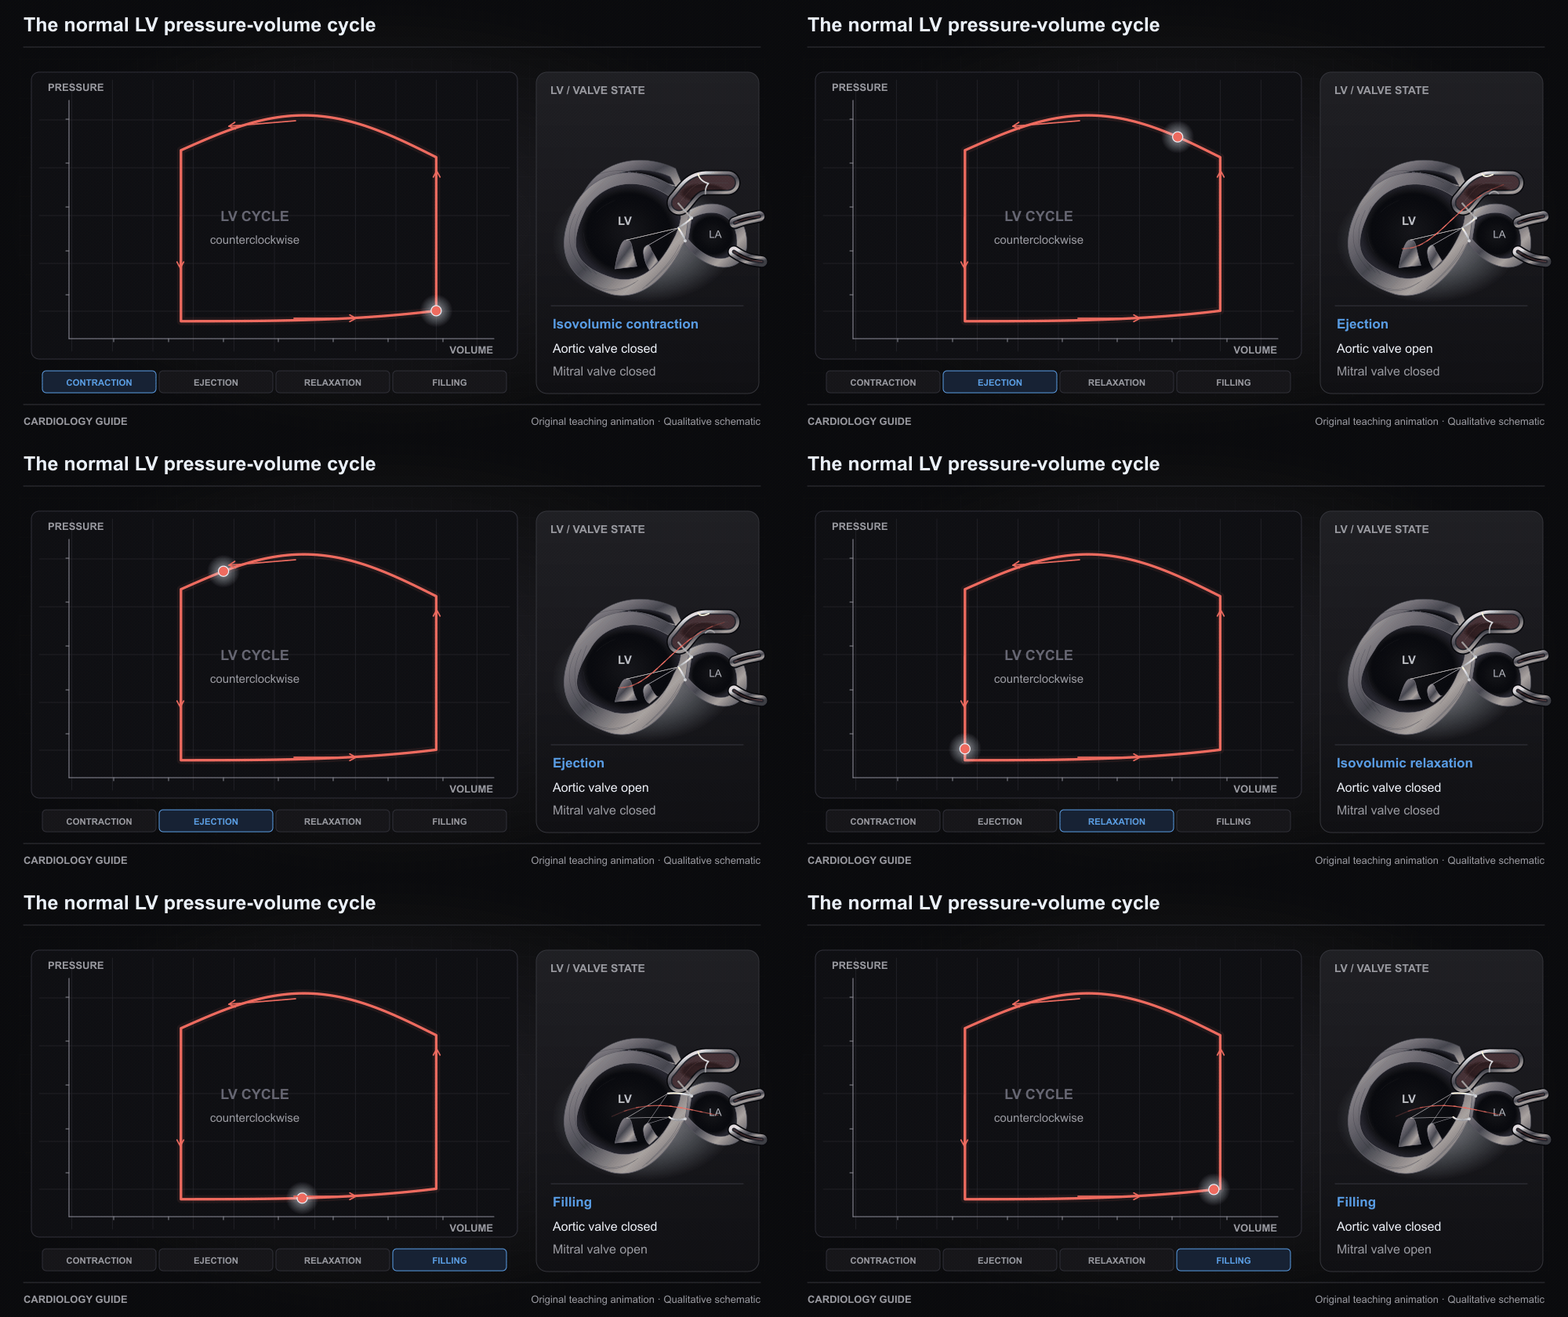
The normal LV pressure-volume cycle

A counterclockwise LV pressure-volume loop links isovolumic contraction, ejection, relaxation and filling with the valve state. Cursor timing and axes are qualitative.

Right Heart Cath & Hemodynamics · Heart Failure Comprehensive · Cardiac Catheterization Diagnostics

Source and interpretation

Burkhoff, Mirsky and Suga: pressure-volume analysis

Original qualitative teaching schematic. Motion, particles and traces are illustrative. Timing and geometry are simplified.

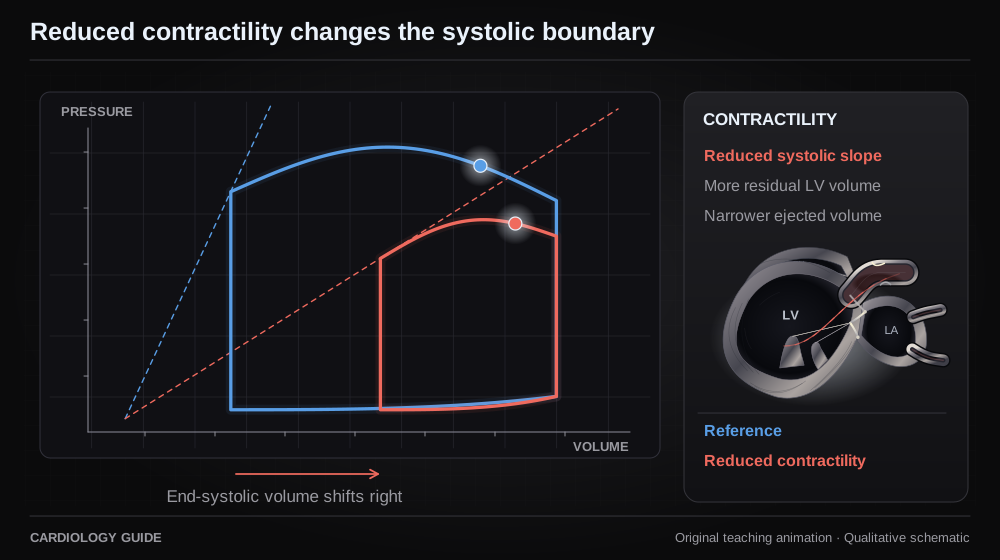
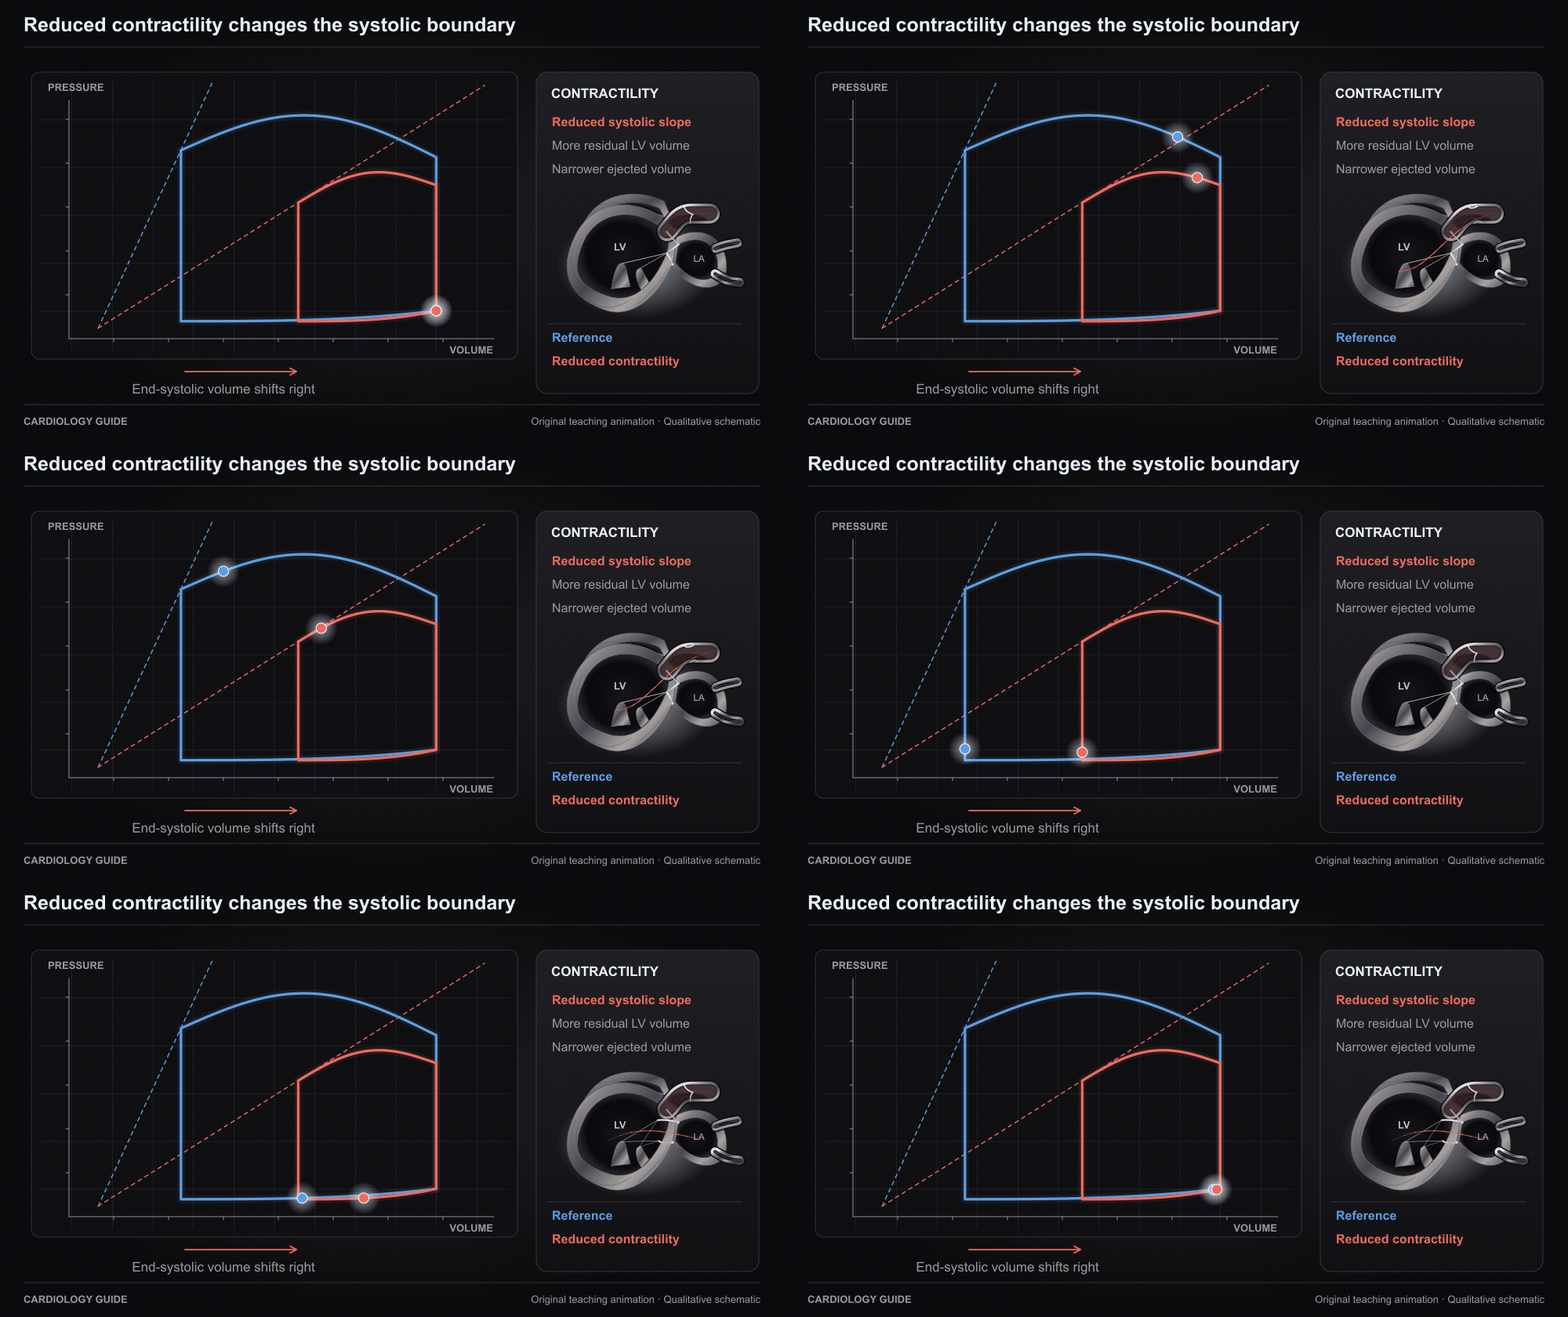
Reduced contractility changes the systolic boundary

At comparable loading, a flatter systolic pressure-volume relation leaves more end-systolic volume and a narrower loop. The comparison illustrates mechanics rather than a numerical simulation.

Heart Failure Comprehensive · Vasopressors & Inotropes · Right Heart Cath & Hemodynamics · Ischemic Cardiomyopathy

Source and interpretation

Burkhoff, Mirsky and Suga: pressure-volume analysis

Original qualitative teaching schematic. Motion, particles and traces are illustrative. Timing and geometry are simplified.

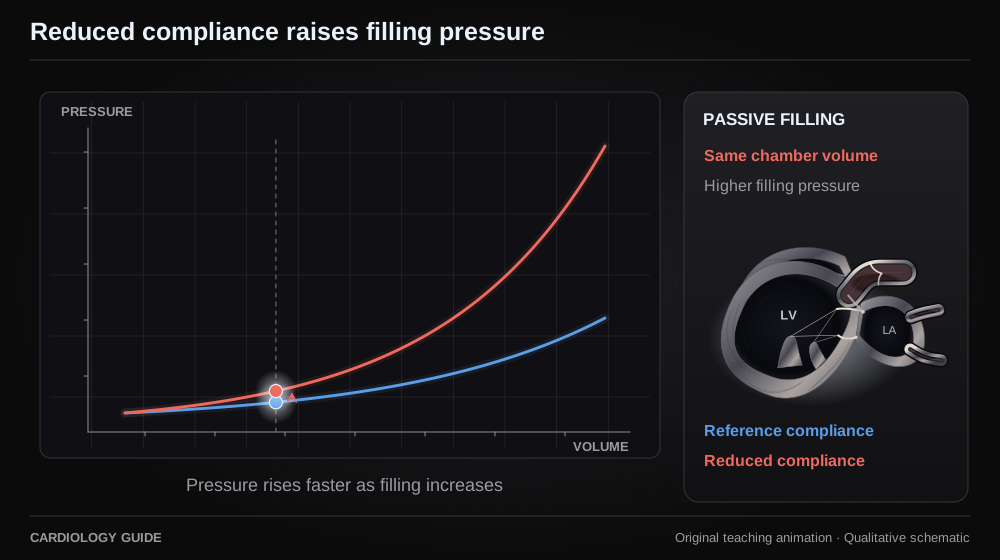
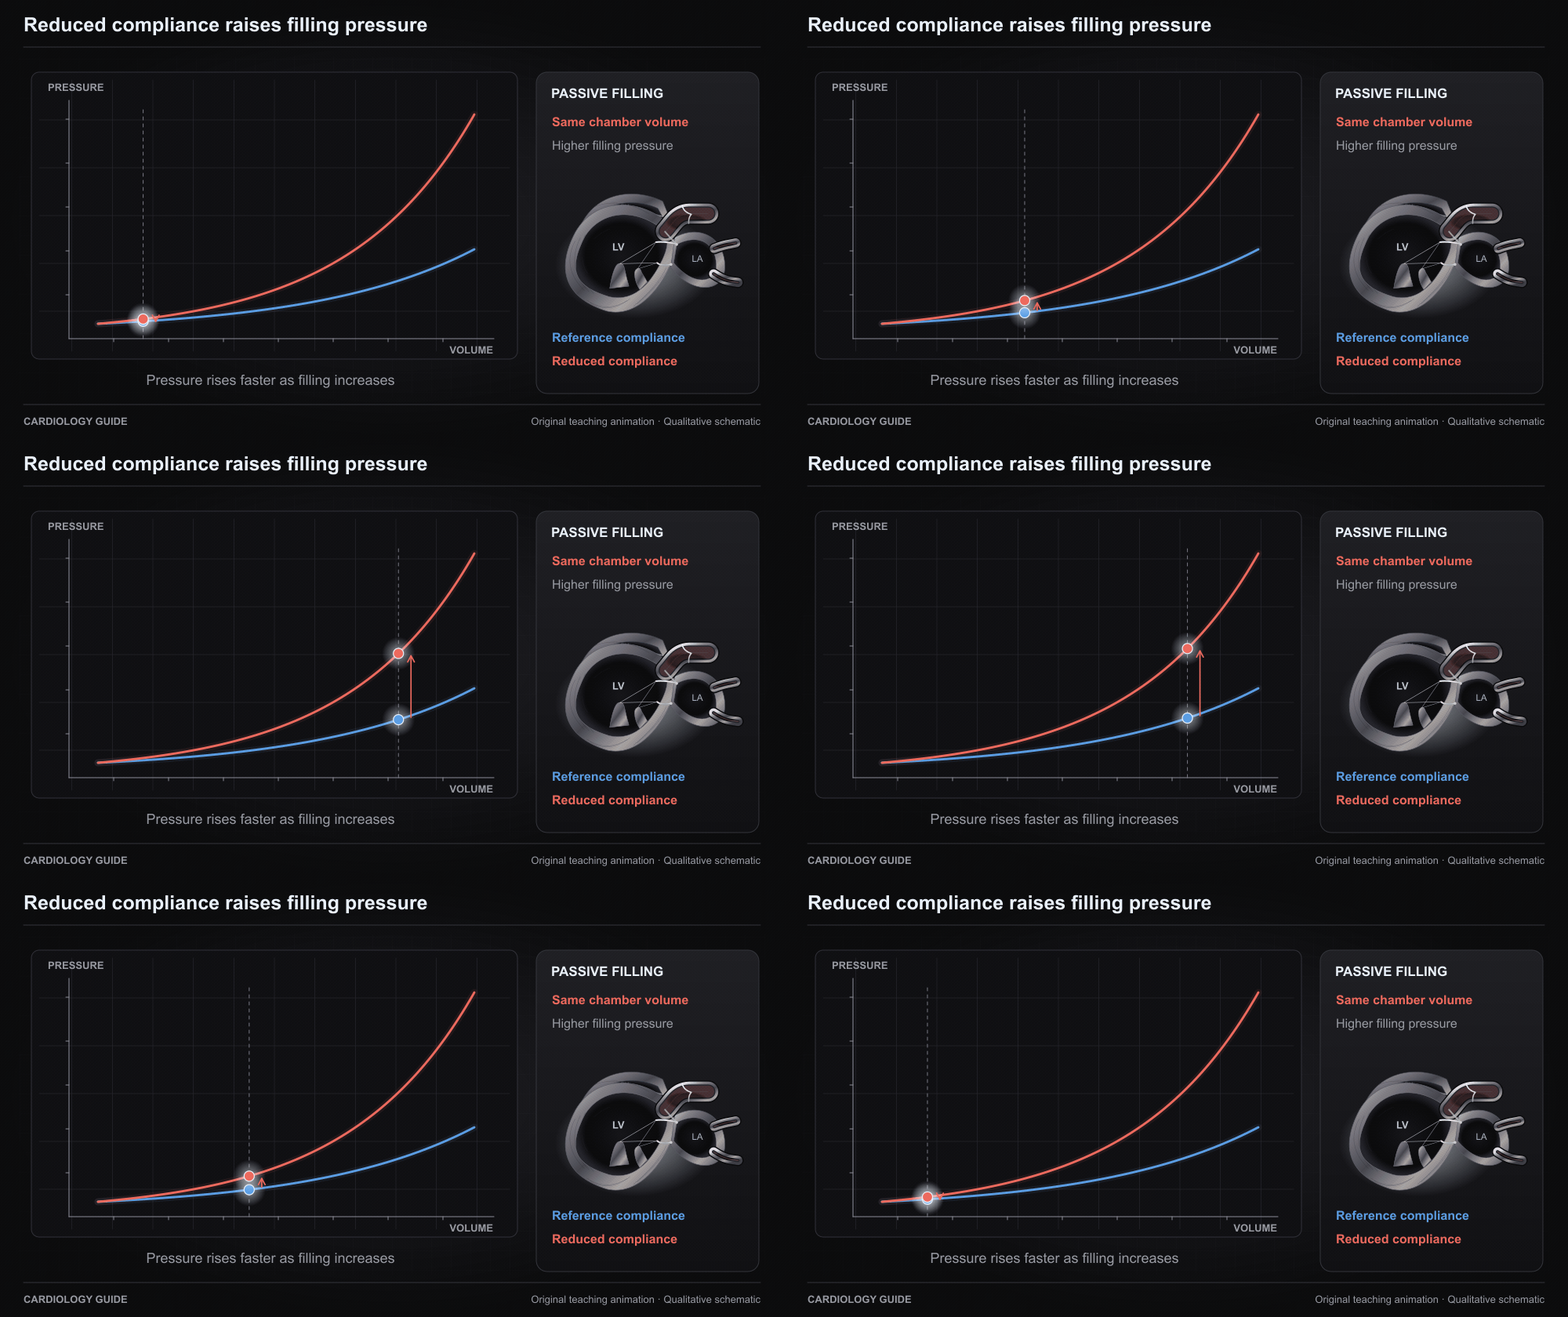
Reduced compliance raises filling pressure

The same filling volume lies at a higher pressure on a steeper passive diastolic pressure-volume relation. Chamber compliance and active relaxation are distinct concepts.

Heart Failure Comprehensive · Hypertrophic Cardiomyopathy · Cardiac Amyloidosis · Right Heart Cath & Hemodynamics

Source and interpretation

Burkhoff, Mirsky and Suga: pressure-volume analysis

Original qualitative teaching schematic. Motion, particles and traces are illustrative. Timing and geometry are simplified.

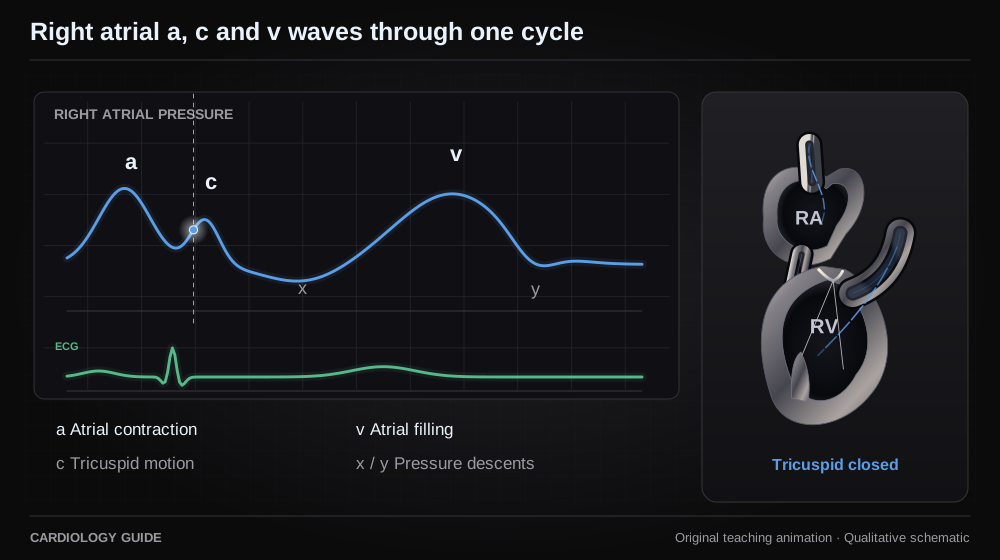
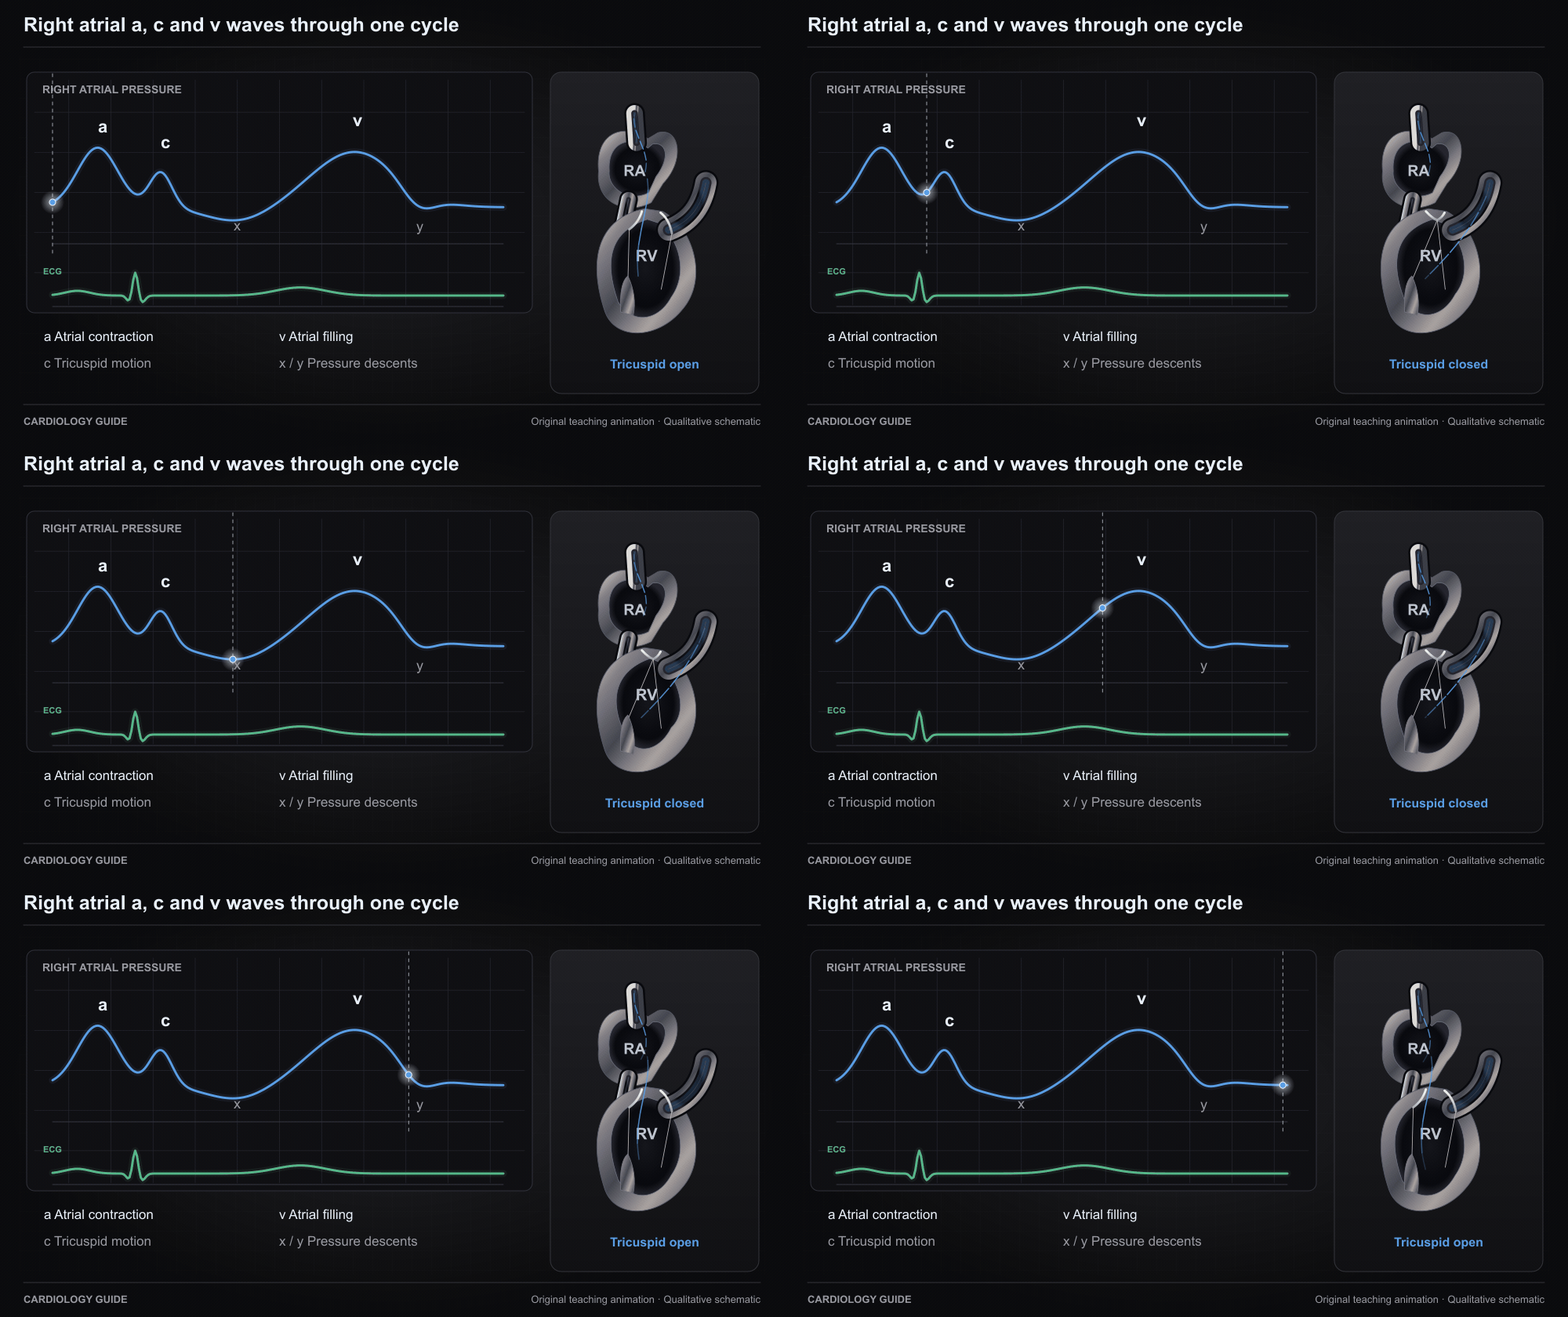
Right atrial a, c and v waves through one cycle

A synchronized right atrial waveform shows atrial contraction, early systolic tricuspid motion, atrial filling, and the x and y descents. The teaching tracing is uncalibrated.

Right Heart Cath & Hemodynamics · Bedside Cardiac Examination · Right Ventricular Failure

Source and interpretation

Stanford Medicine: venous waveform physiology

Original qualitative teaching schematic. Motion, particles and traces are illustrative. Timing and geometry are simplified.

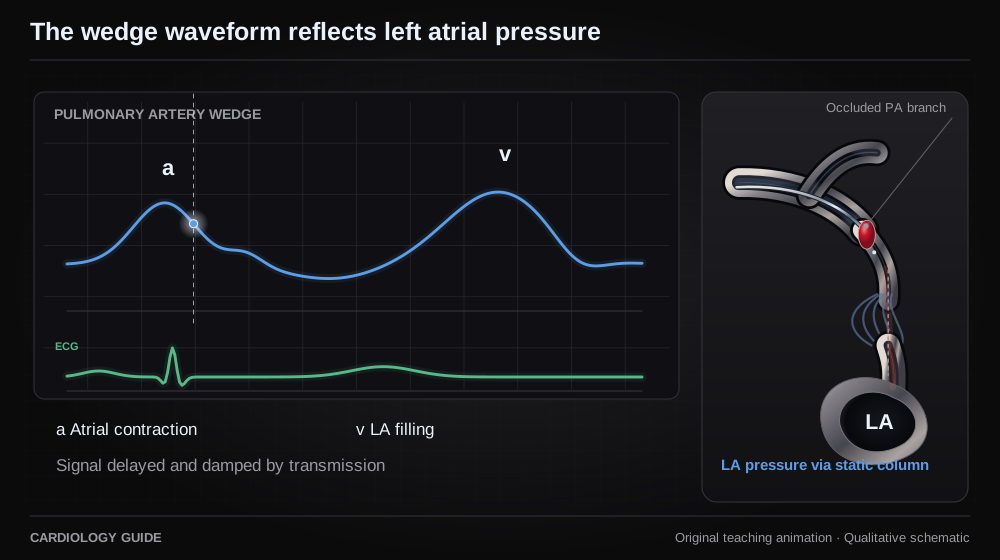
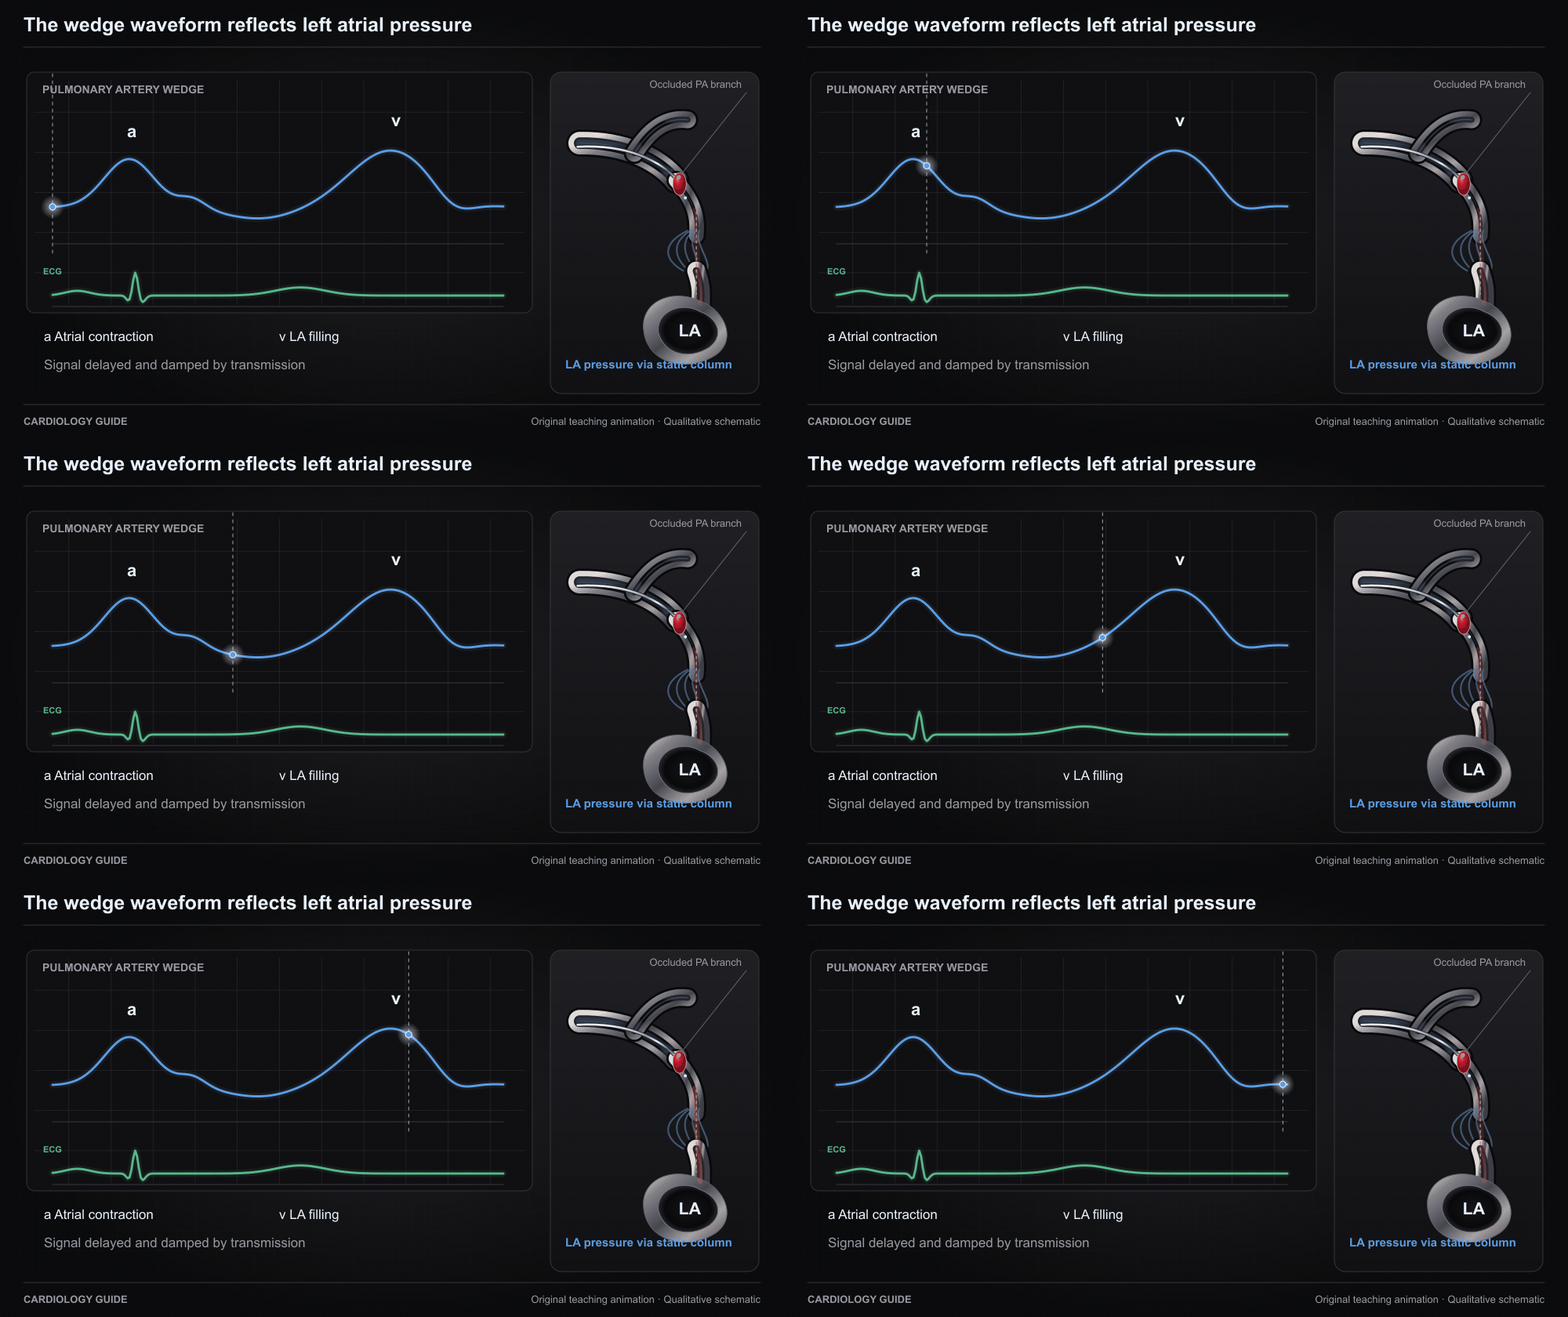
The wedge waveform reflects left atrial pressure

A damped, delayed left atrial pressure signal reaches the wedged pulmonary artery catheter through a static column. The a and v waves represent atrial contraction and filling and are not a pulmonary artery systolic waveform.

Right Heart Cath & Hemodynamics · Pulmonary Hypertension · Cardiac Catheterization Diagnostics

Source and interpretation

Forrester et al.: invasive hemodynamic subsets

Original qualitative teaching schematic. Motion, particles and traces are illustrative. Timing and geometry are simplified.

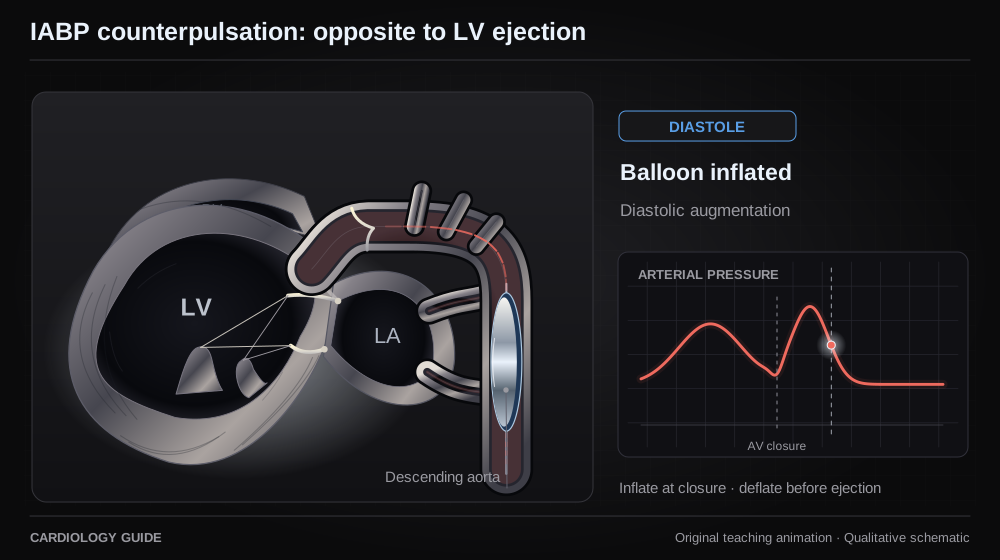
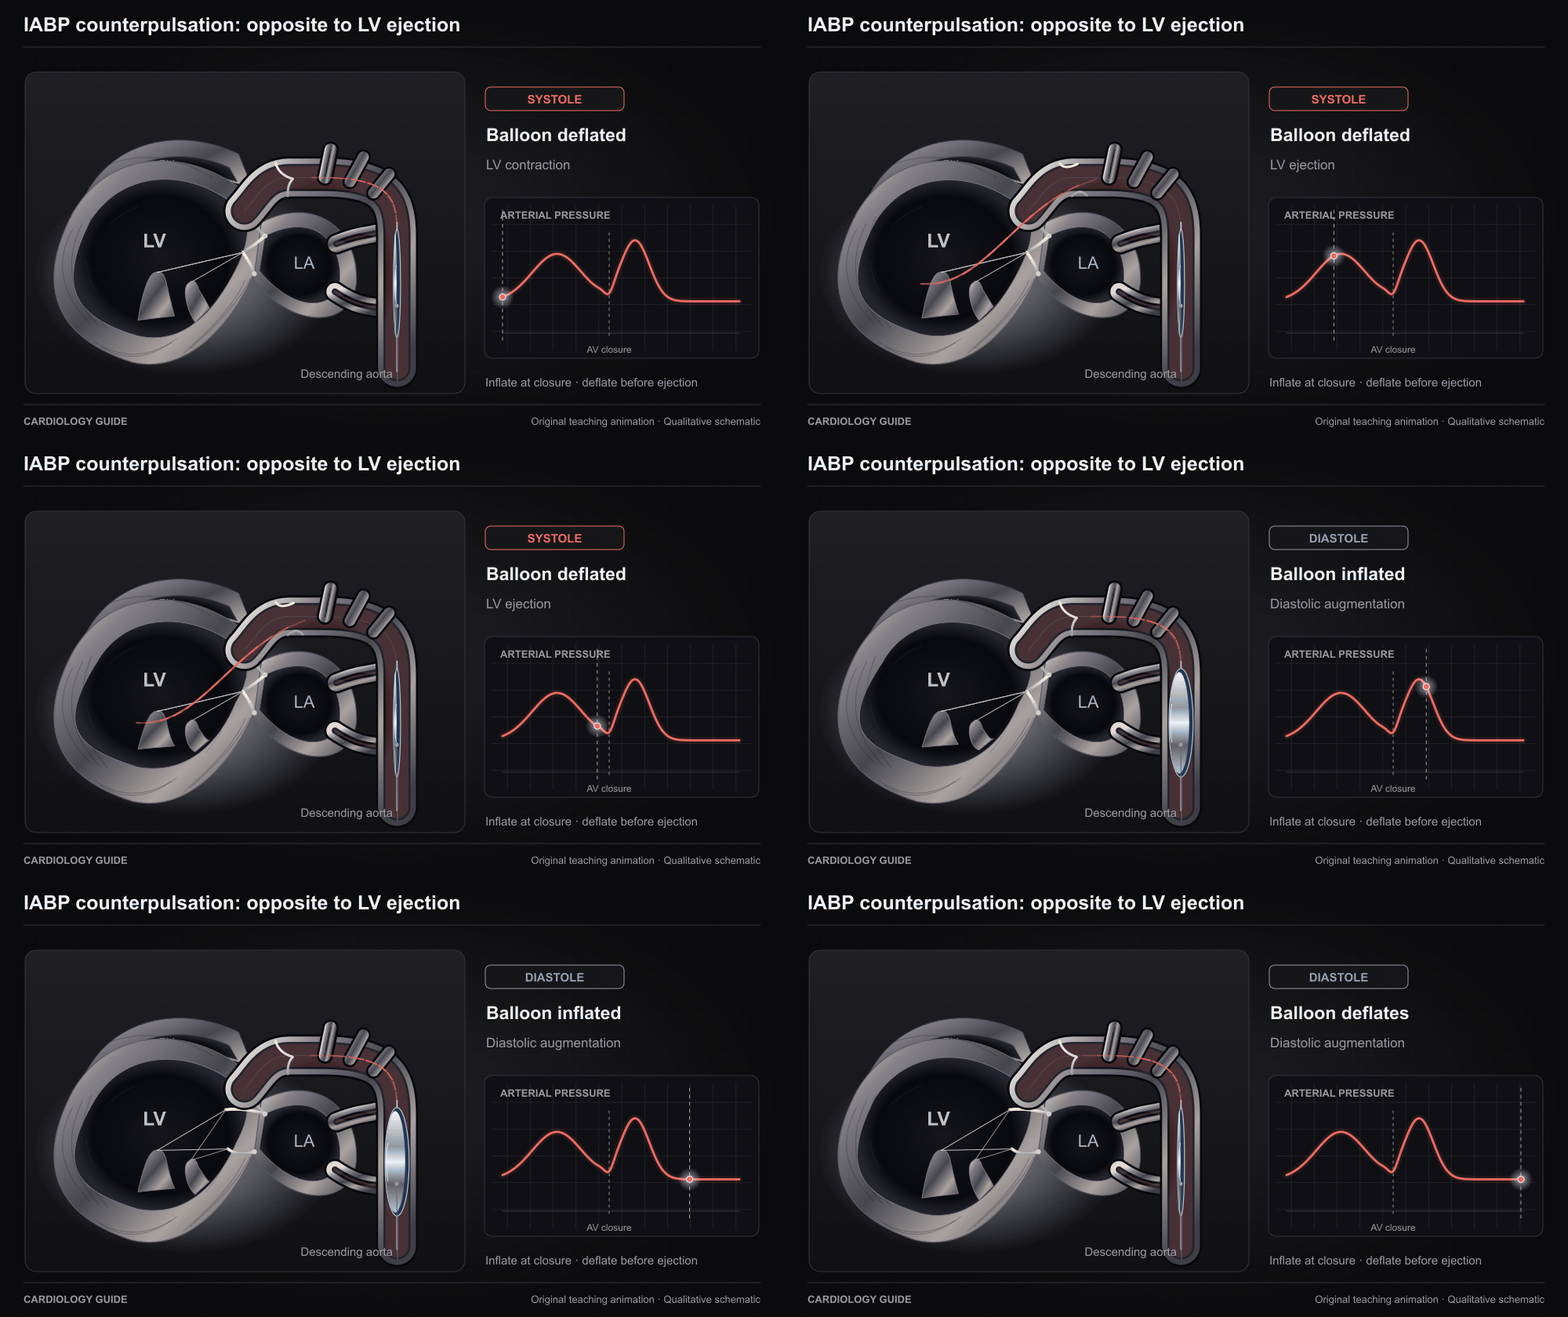
IABP counterpulsation: opposite to LV ejection

The balloon inflates at aortic valve closure in diastole and deflates before the next systolic ejection. Balloon motion, aortic valve state and the illustrative arterial tracing share a qualitative time base.

Intra-Aortic Balloon Pump · MCS Weaning & Decannulation · Right Heart Cath & Hemodynamics

Source and interpretation

Getinge: Cardiosave timing assessment

Original qualitative teaching schematic. Motion, particles and traces are illustrative. Timing and geometry are simplified.

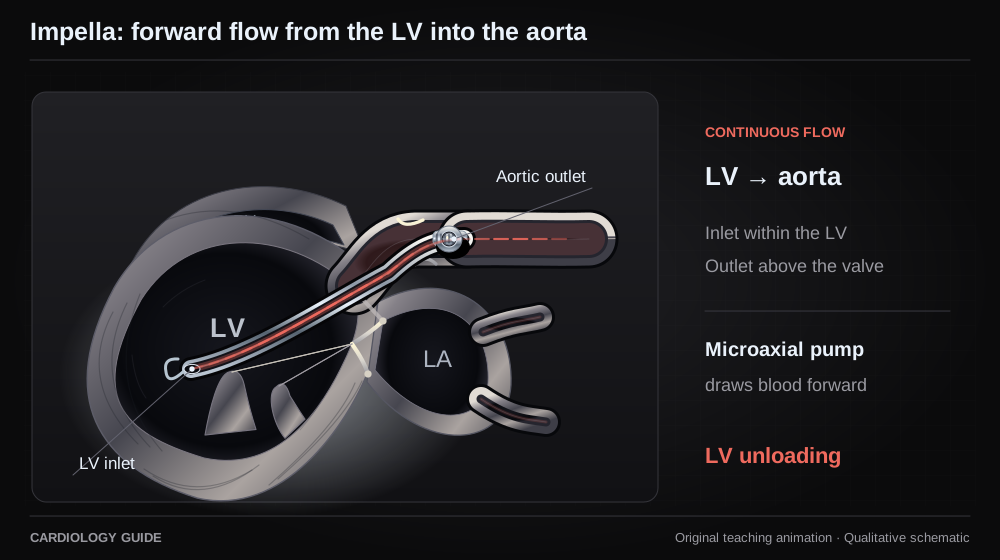
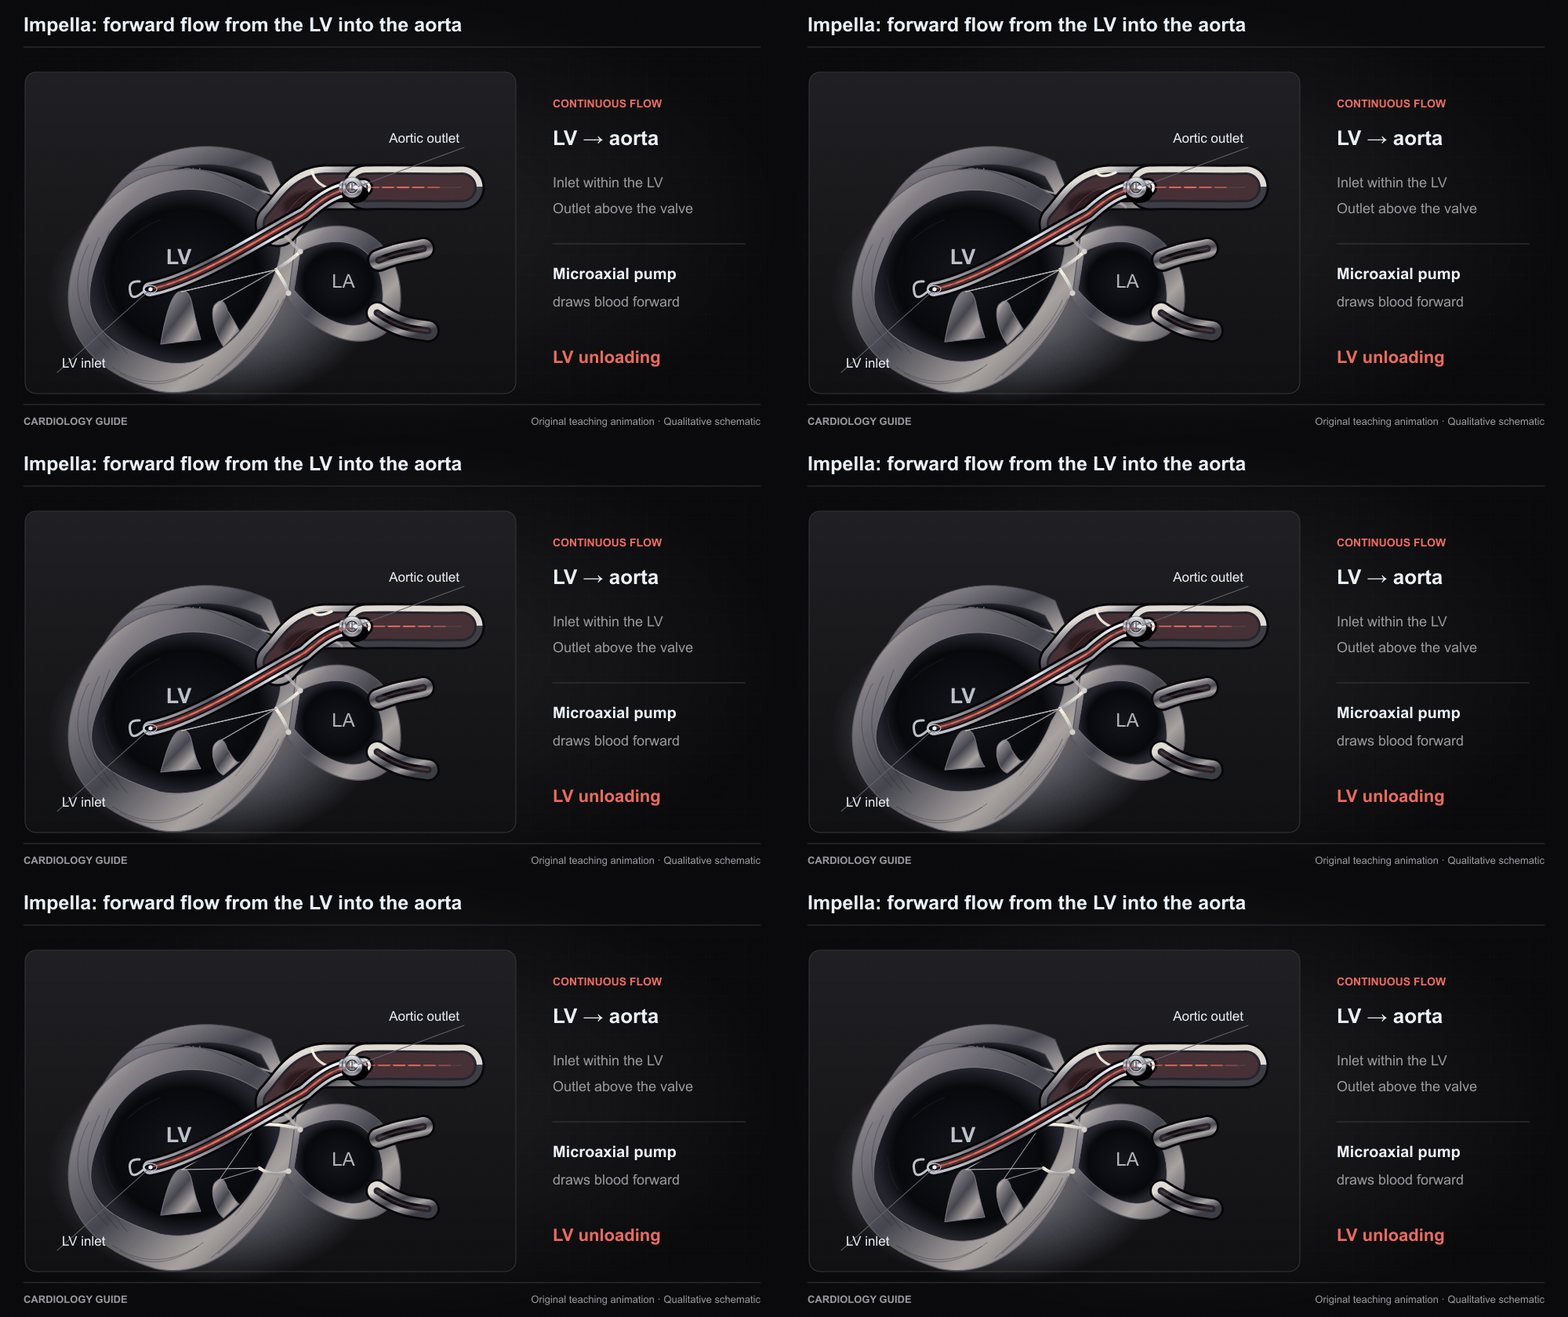
Impella: forward flow from the LV into the aorta

An original microaxial-pump schematic places the inlet inside the LV and outlet above the aortic valve. Particles move continuously forward through the cannula into the aorta, illustrating LV unloading.

Impella · MCS Weaning & Decannulation · VA ECMO

Source and interpretation

FDA: Impella instructions for use

Original qualitative teaching schematic. Motion, particles and traces are illustrative. Timing and geometry are simplified.

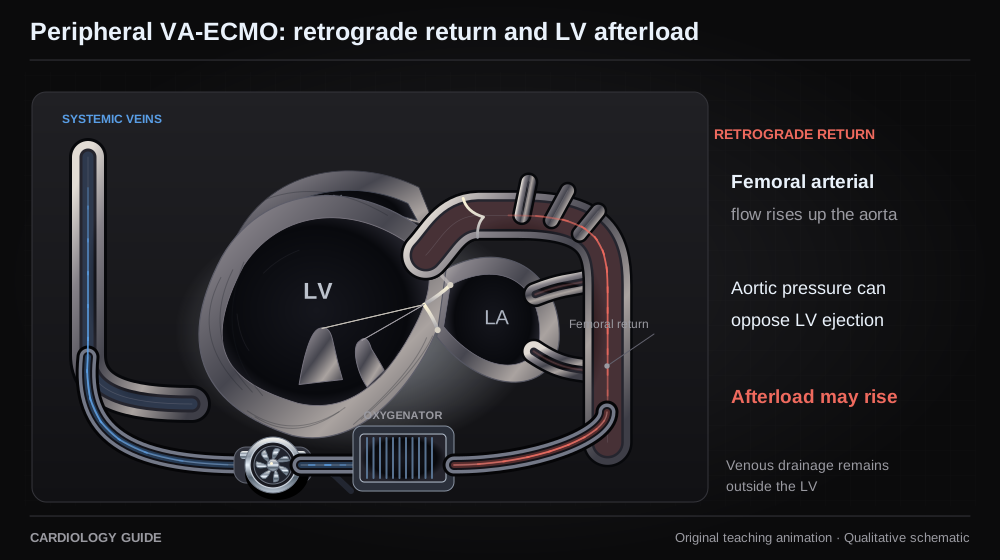
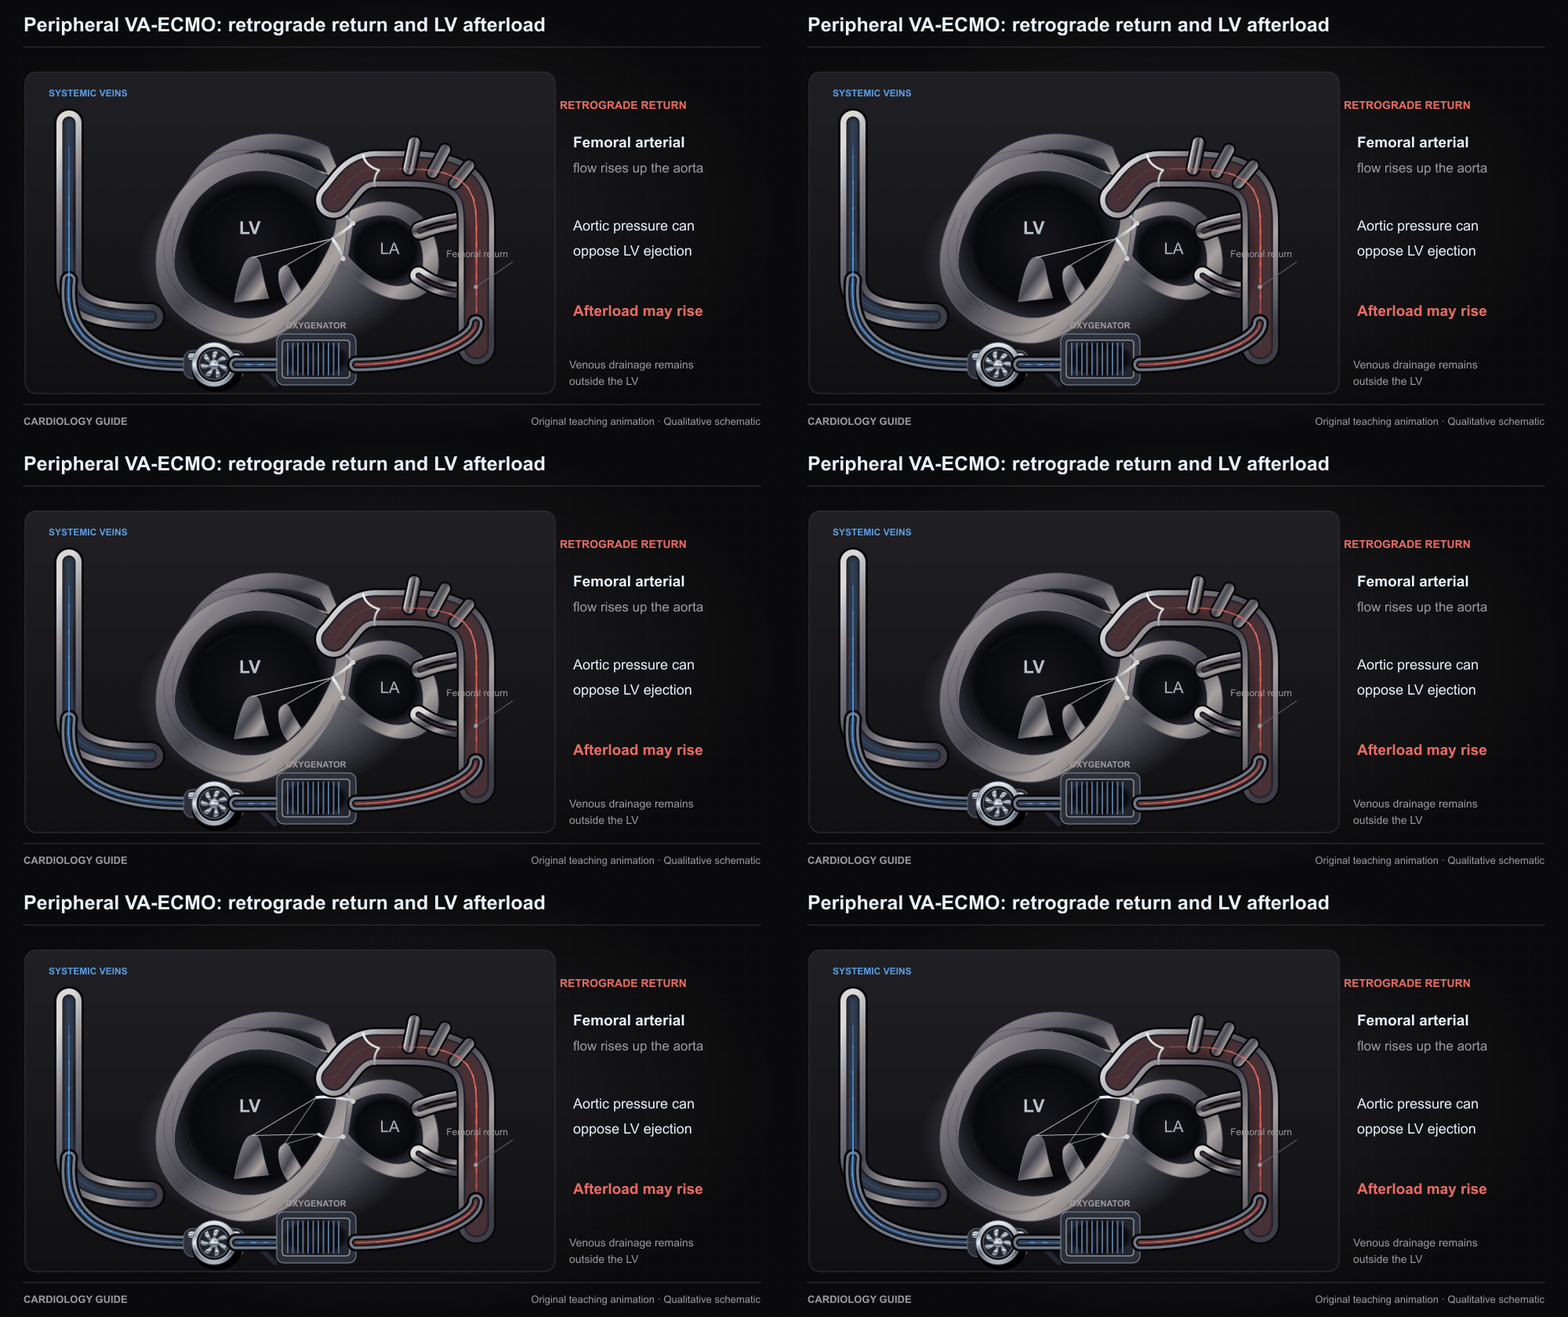
Peripheral VA-ECMO: retrograde return and LV afterload

Femoral VA-ECMO drains systemic venous blood and returns oxygenated blood retrograde through the descending aorta. Aortic pressure can oppose a poorly contractile LV, increasing afterload and impairing ejection.

VA ECMO · MCS Weaning & Decannulation · Right Ventricular Failure

Source and interpretation

ELSO: adult VA-ECMO guideline

Original qualitative teaching schematic. Motion, particles and traces are illustrative. Timing and geometry are simplified.

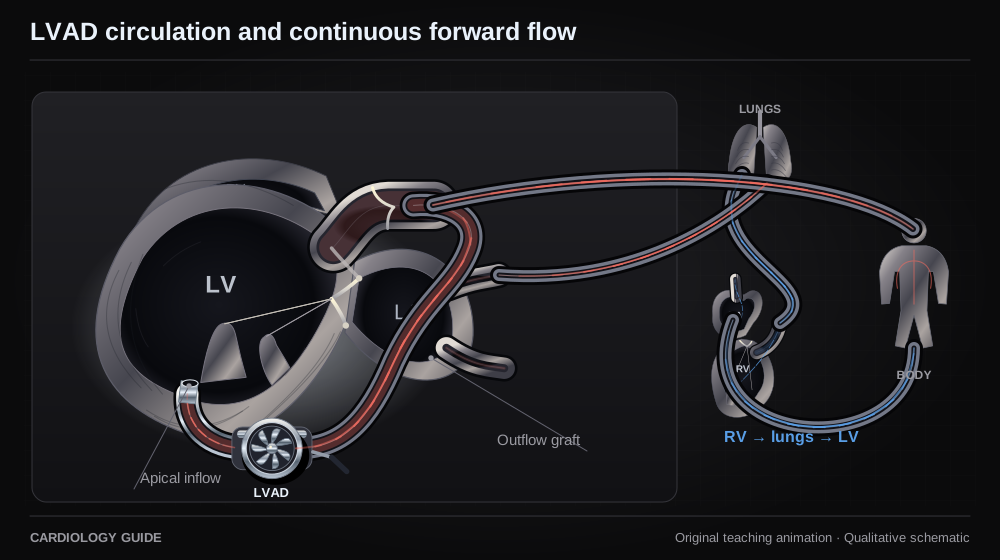
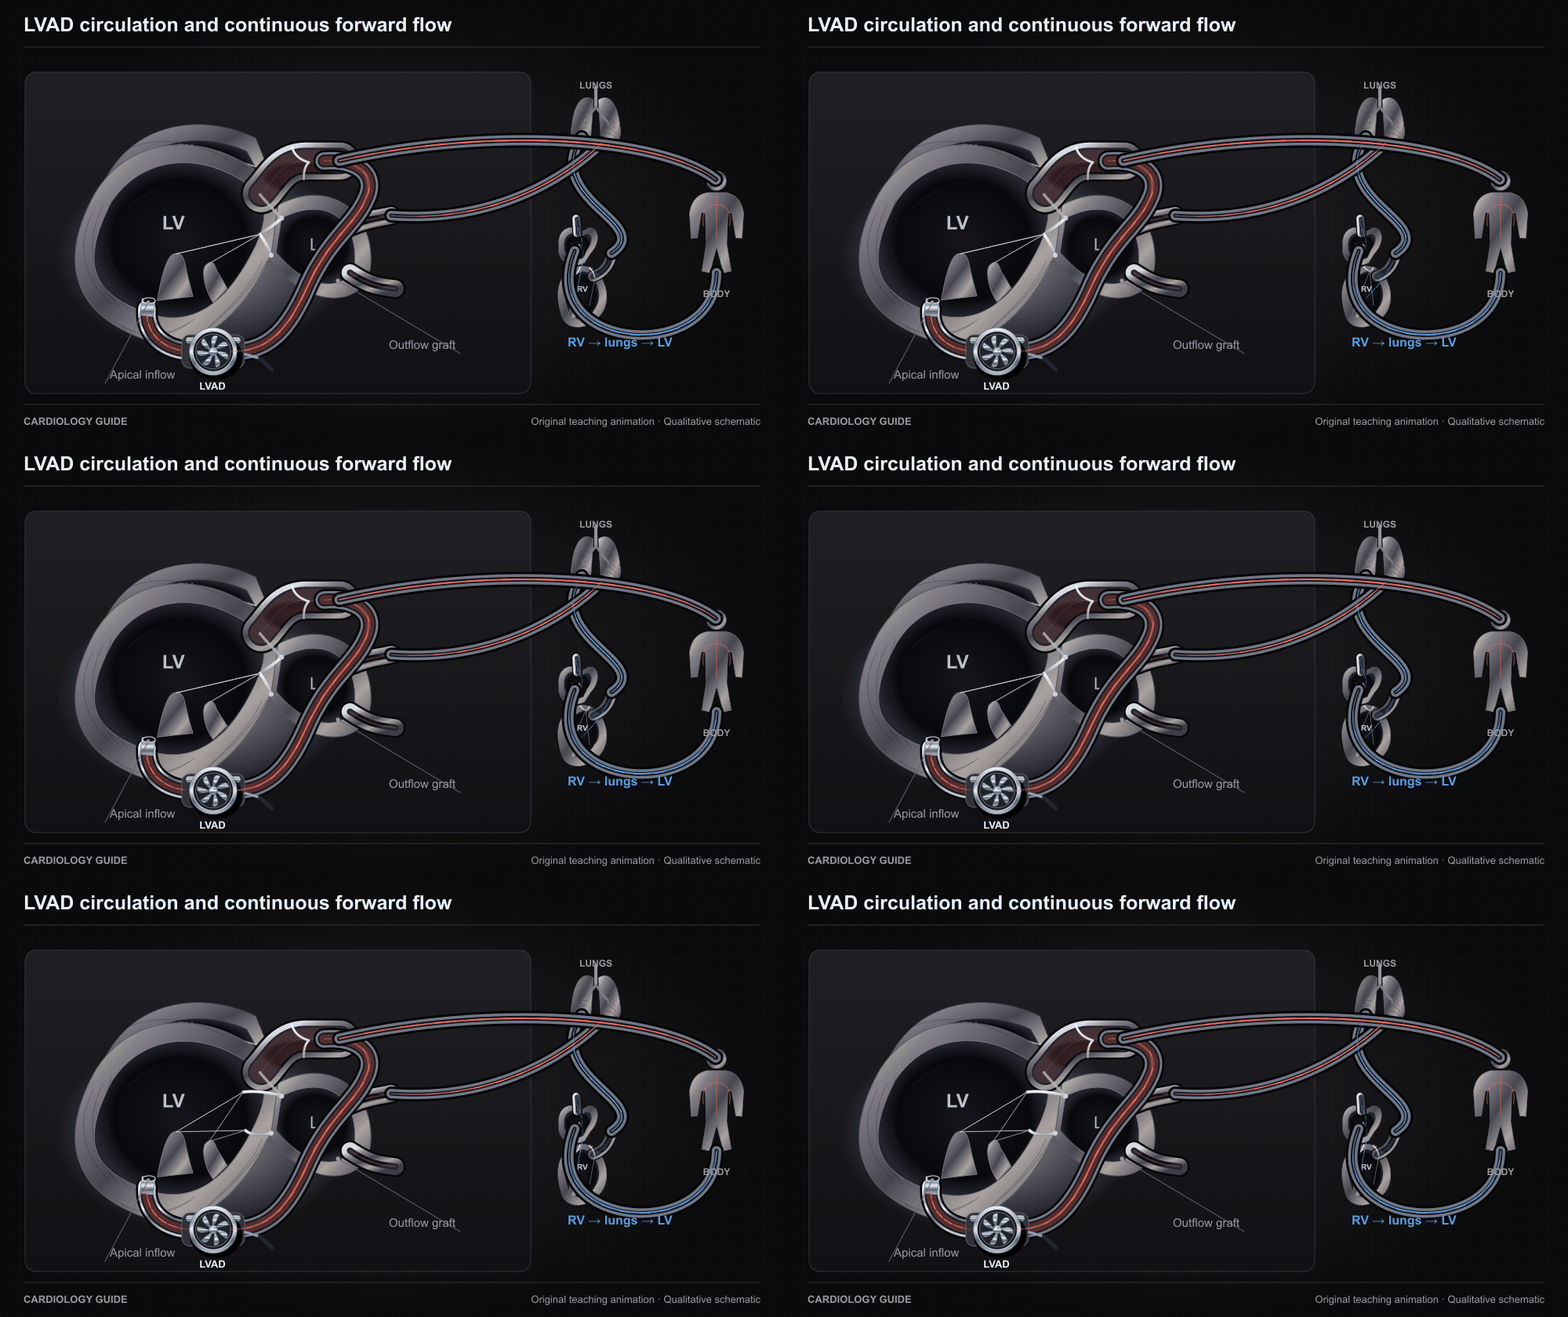
LVAD circulation and continuous forward flow

The RV and pulmonary circulation continue to supply the left heart. An apical inflow cannula sends LV blood through the assist pump and outflow graft to the aorta and systemic circulation.

Durable LVAD · Heart Failure Comprehensive · MCS Weaning & Decannulation

Source and interpretation

FDA: HeartMate 3 instructions for use

Original qualitative teaching schematic. Motion, particles and traces are illustrative. Timing and geometry are simplified.

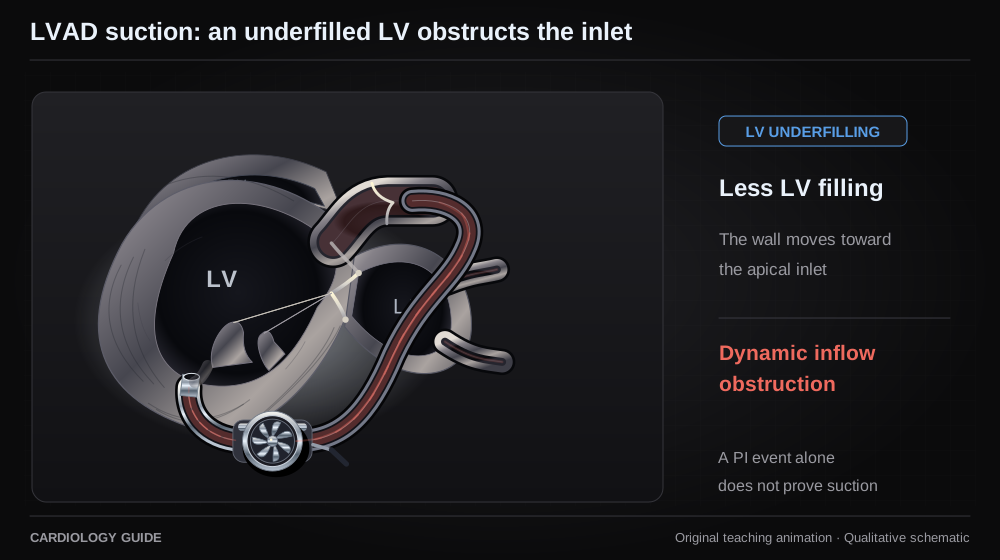
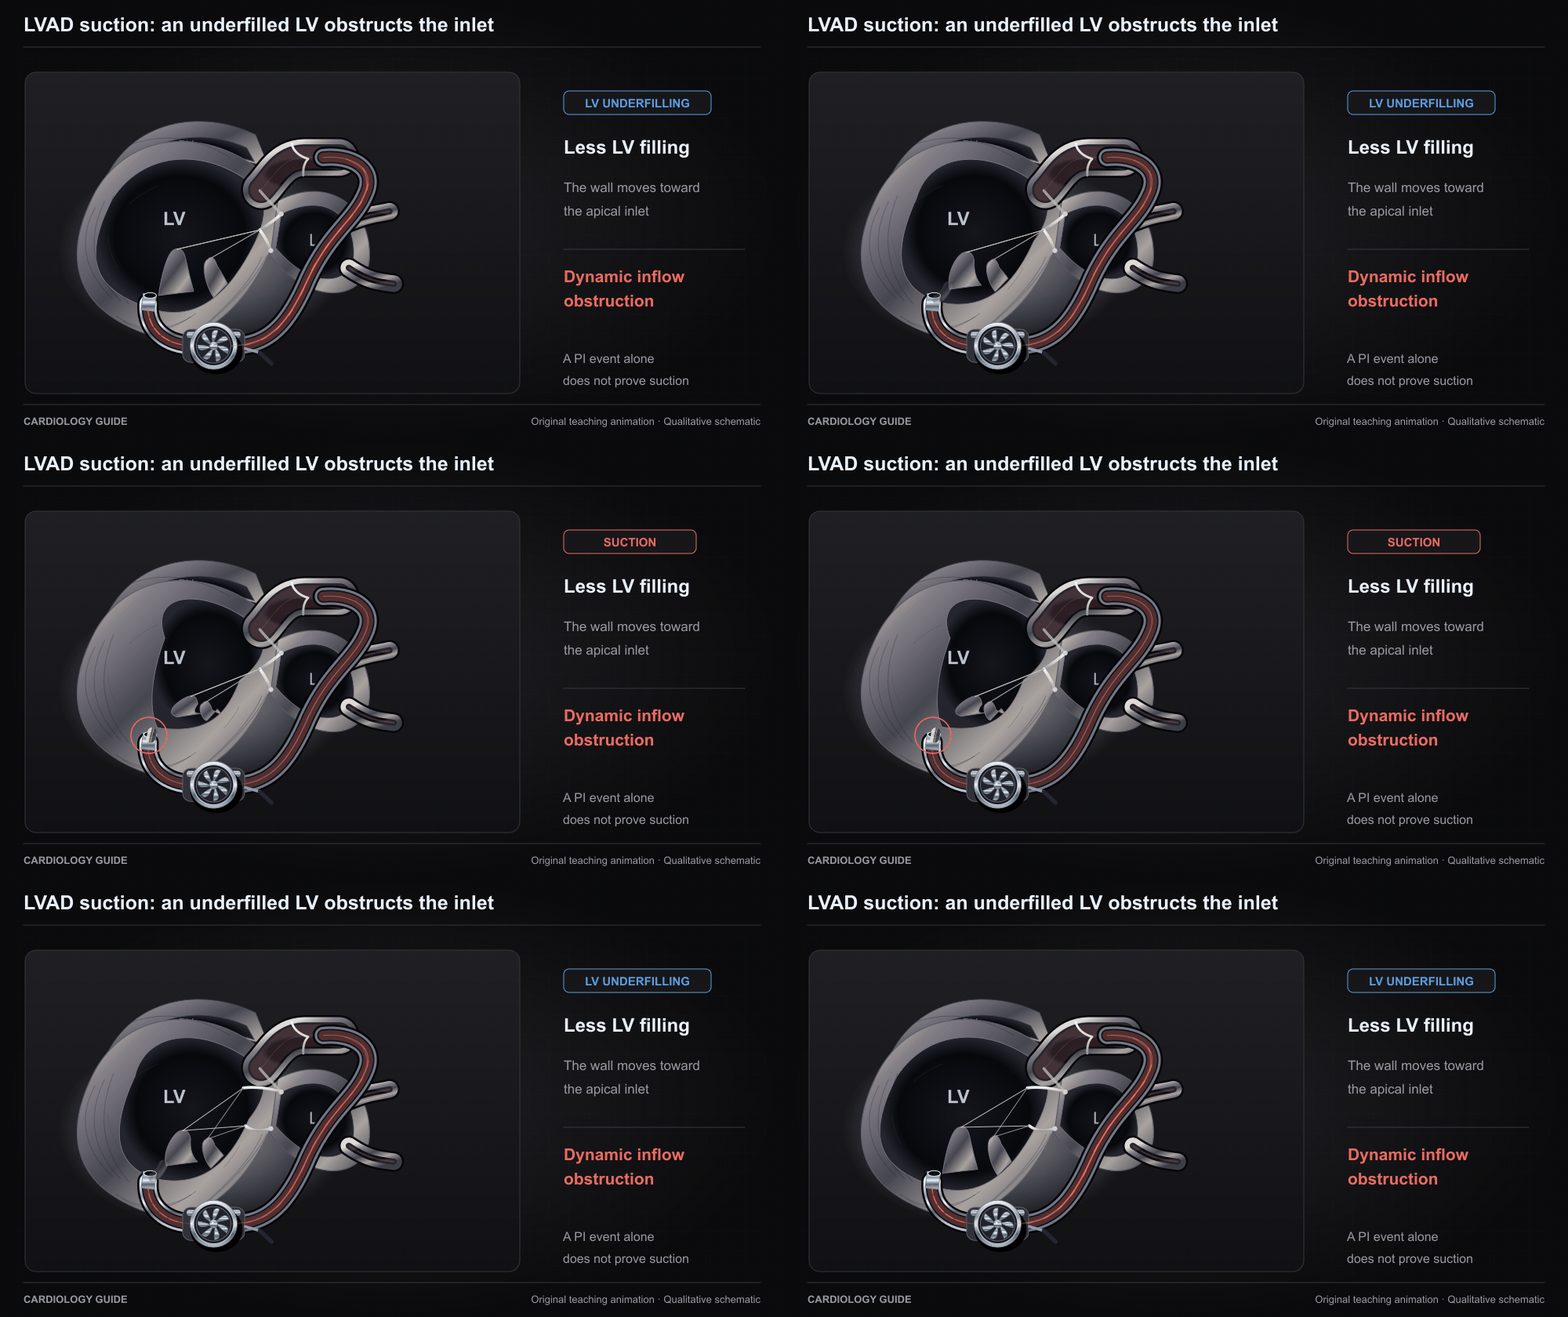
LVAD suction: an underfilled LV obstructs the inlet

As LV filling falls, a wall can approach the apical inflow cannula and dynamically obstruct flow. This qualitative example illustrates true suction. A controller PI event alone does not establish suction.

Durable LVAD · MCS Weaning & Decannulation · Right Ventricular Failure

Source and interpretation

ASE: LVAD imaging and suction physiology

Original qualitative teaching schematic. Motion, particles and traces are illustrative. Timing and geometry are simplified.

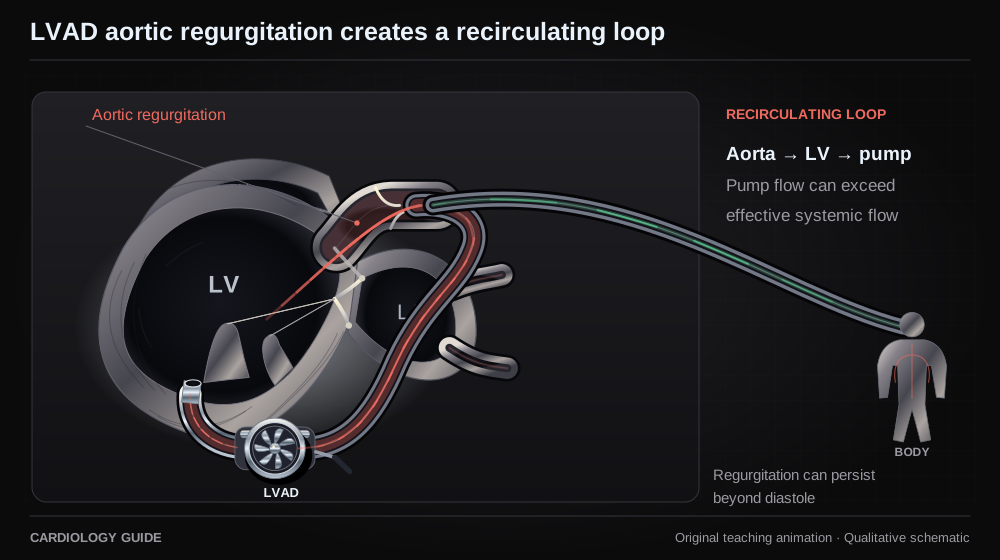
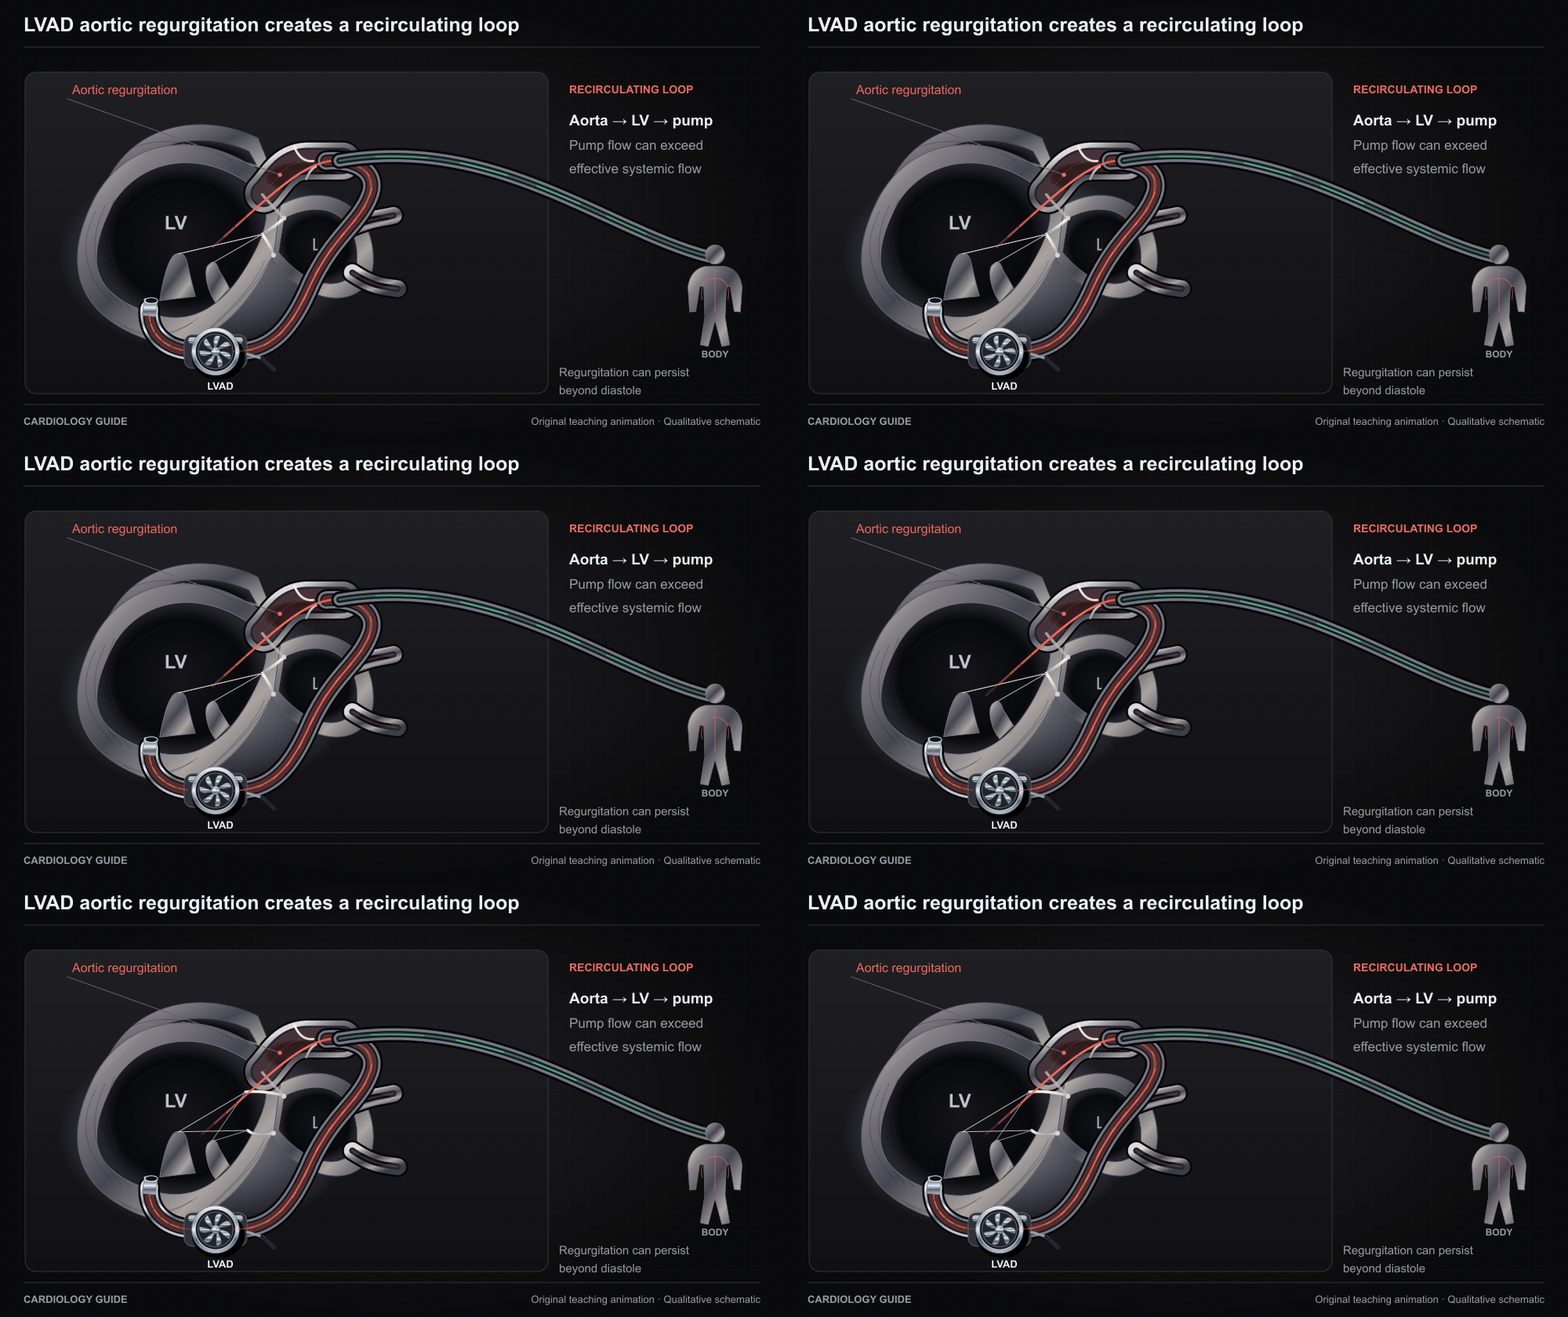
LVAD aortic regurgitation creates a recirculating loop

Part of LVAD output can return through an incompetent aortic valve into the LV and be pumped again. Pump flow and net systemic output can diverge. Regurgitation during LVAD support can extend beyond diastole.

Durable LVAD · Structural & Valvular Heart Guide · Right Heart Cath & Hemodynamics

Source and interpretation

Primary LVAD cases: regurgitation across the cardiac cycle

Original qualitative teaching schematic. Motion, particles and traces are illustrative. Timing and geometry are simplified.

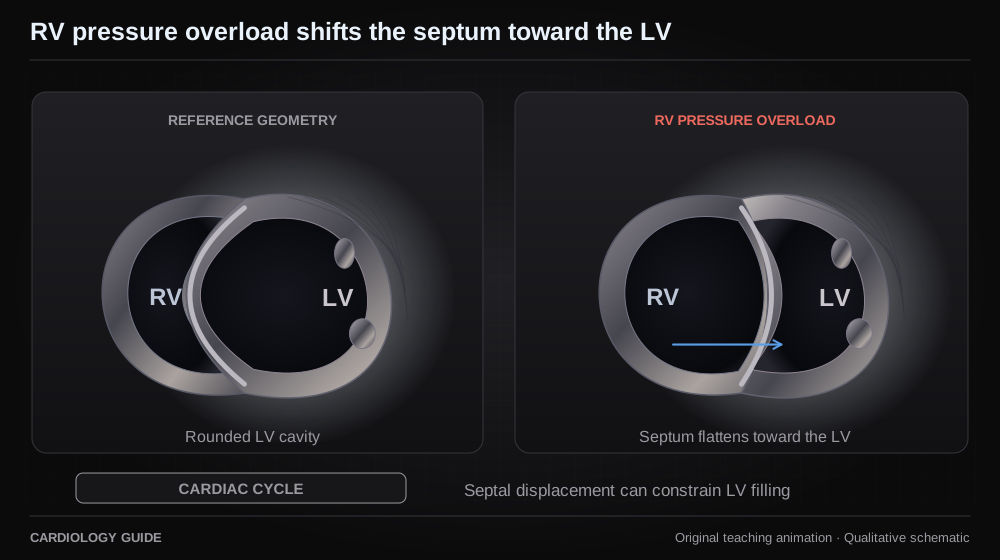
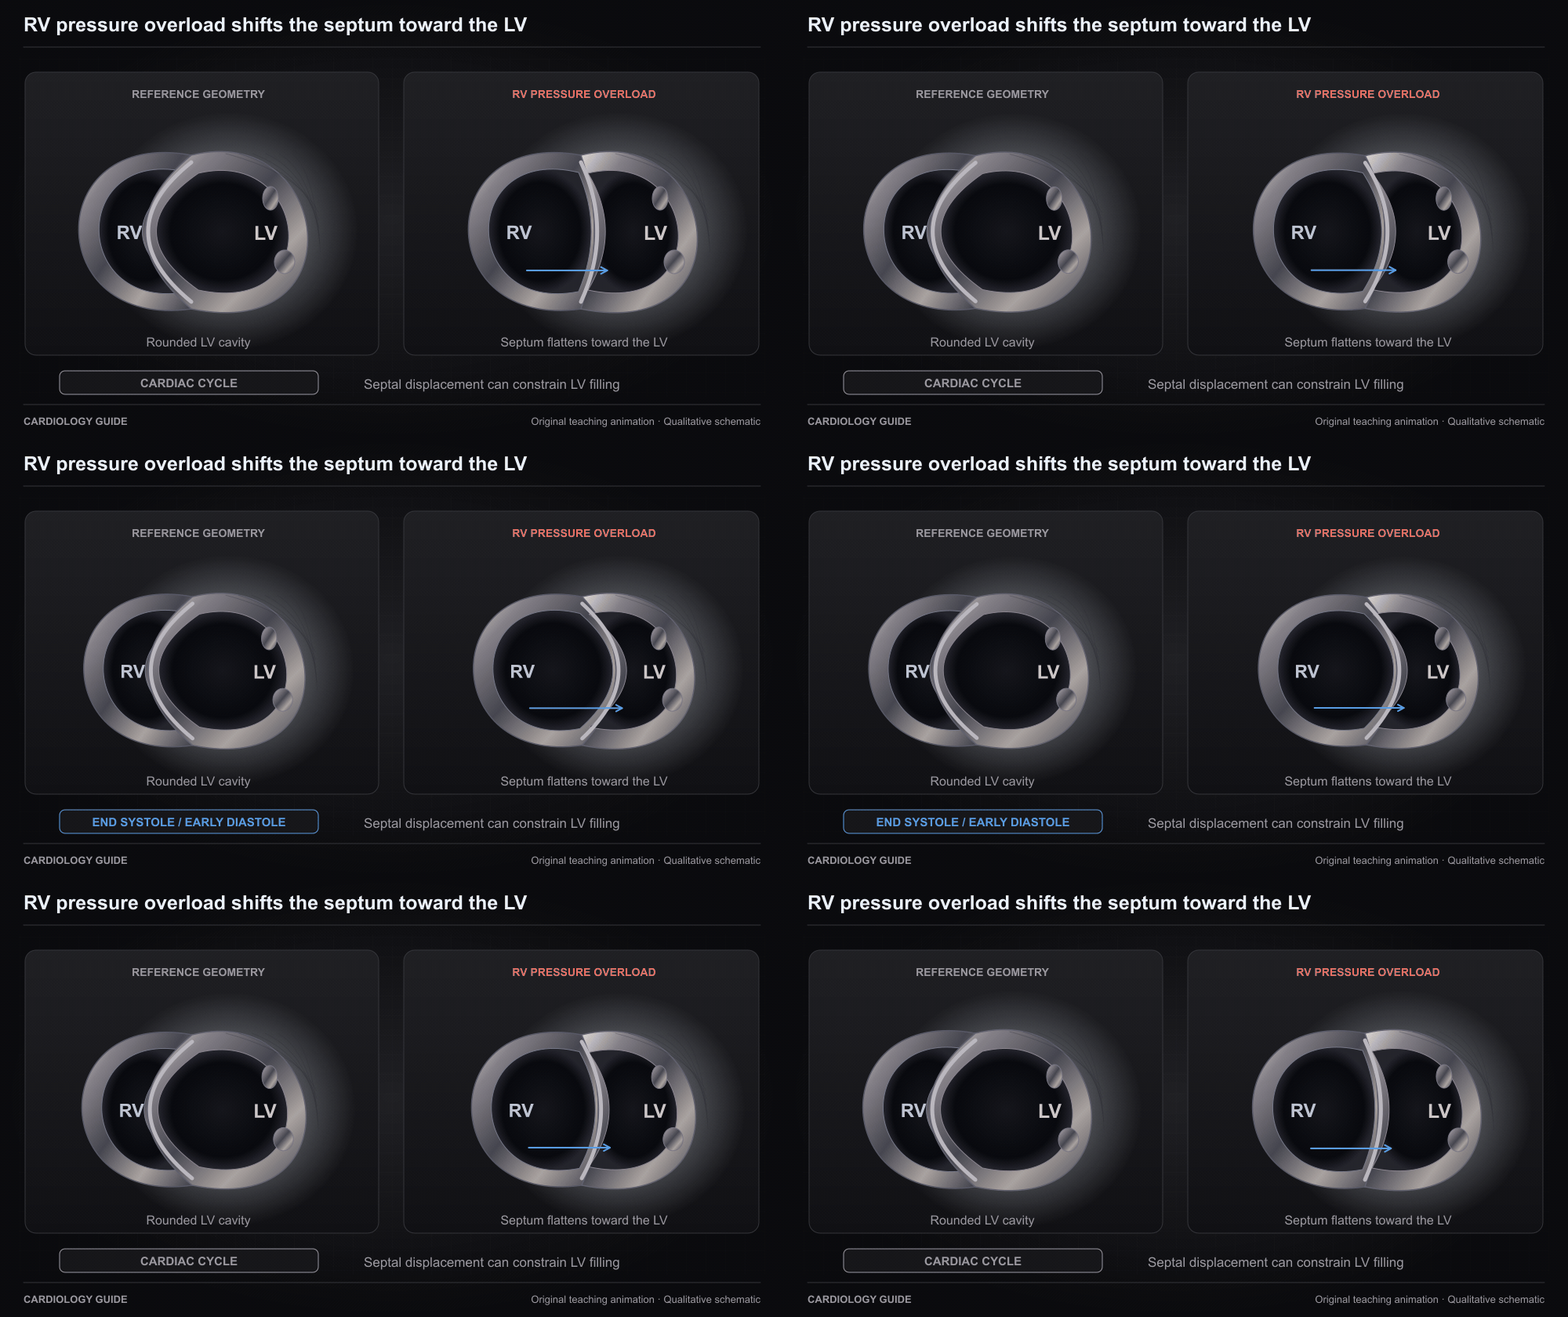
RV pressure overload shifts the septum toward the LV

A short-axis teaching comparison shows RV pressure overload flattening and displacing the interventricular septum toward the LV, most apparent near end systole and early diastole. This can constrain LV filling.

Right Ventricular Failure · Pulmonary Hypertension · Echo Guide — Physics, Diastology & Valve Quantitation · Pulmonary Embolism & VTE

Source and interpretation

ASE: right heart and pulmonary hypertension guideline

Original qualitative teaching schematic. Motion, particles and traces are illustrative. Timing and geometry are simplified.

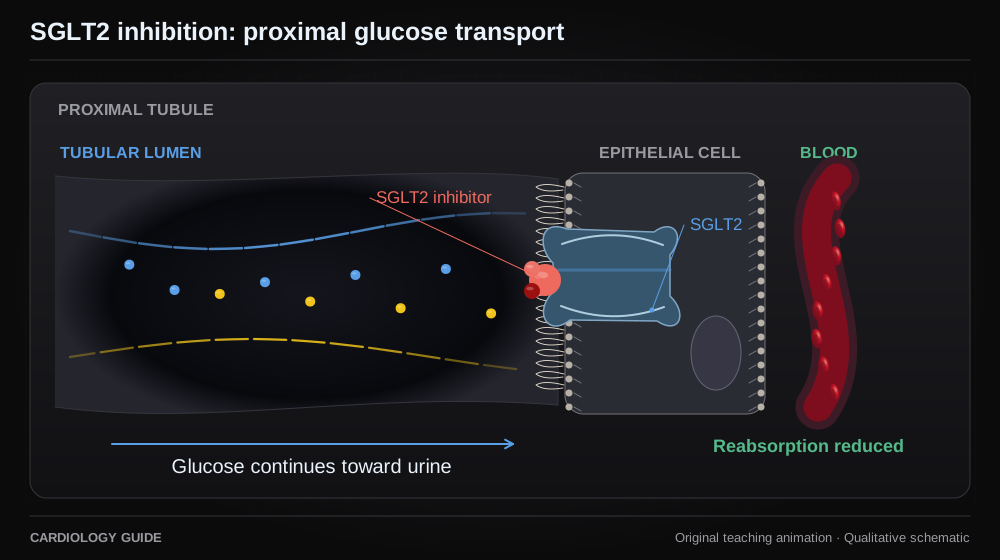
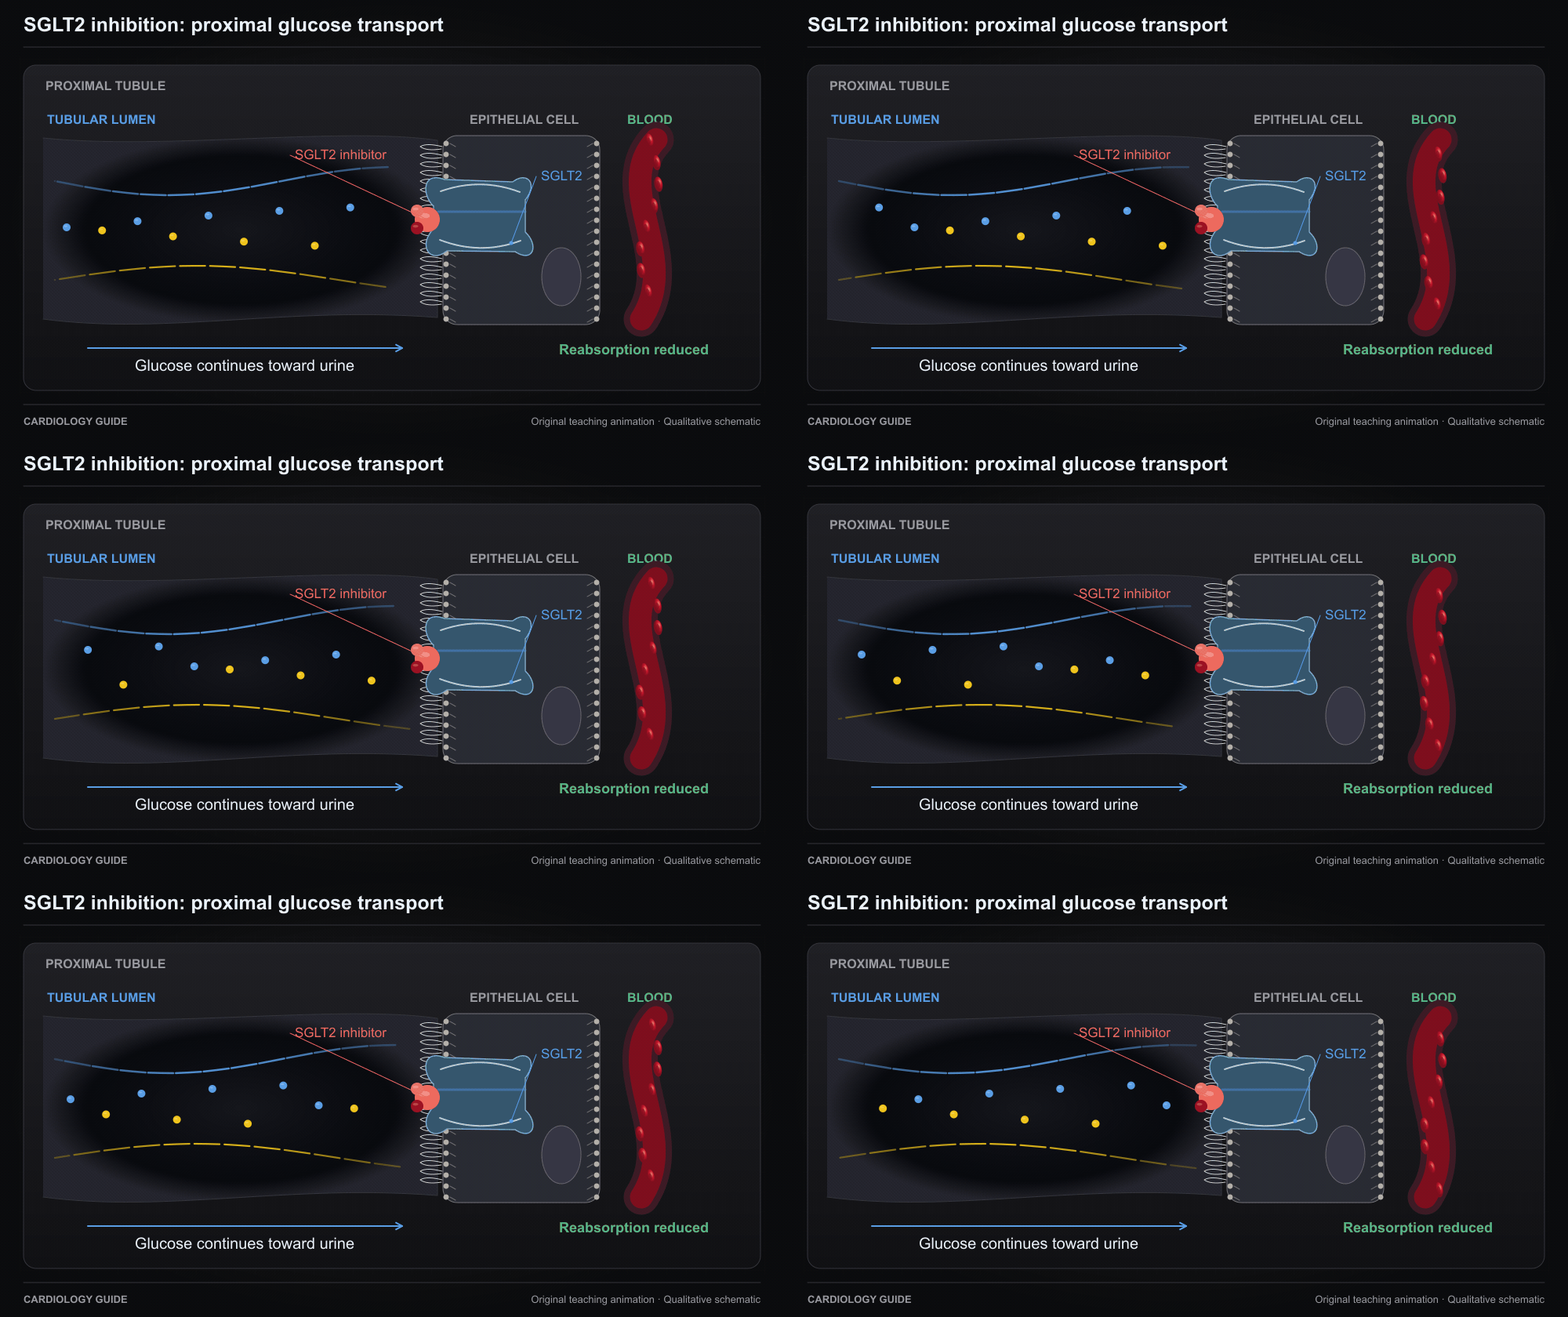
SGLT2 inhibition: proximal glucose transport

SGLT2 inhibition reduces proximal tubular glucose reabsorption. This schematic does not explain the entire mechanism of cardiovascular benefit.

Cardiology Pharmacology · SGLT2 medicines for heart failure — patient handout · Heart Failure Comprehensive

Source and interpretation

FDA prescribing information: mechanism of action

Original qualitative teaching schematic. Motion, particles and traces are illustrative. Timing and geometry are simplified.

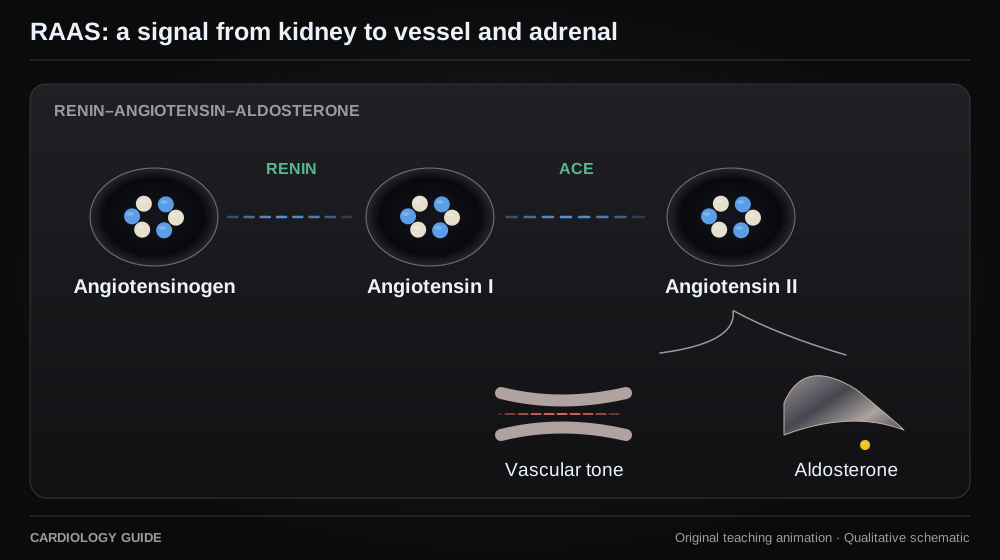
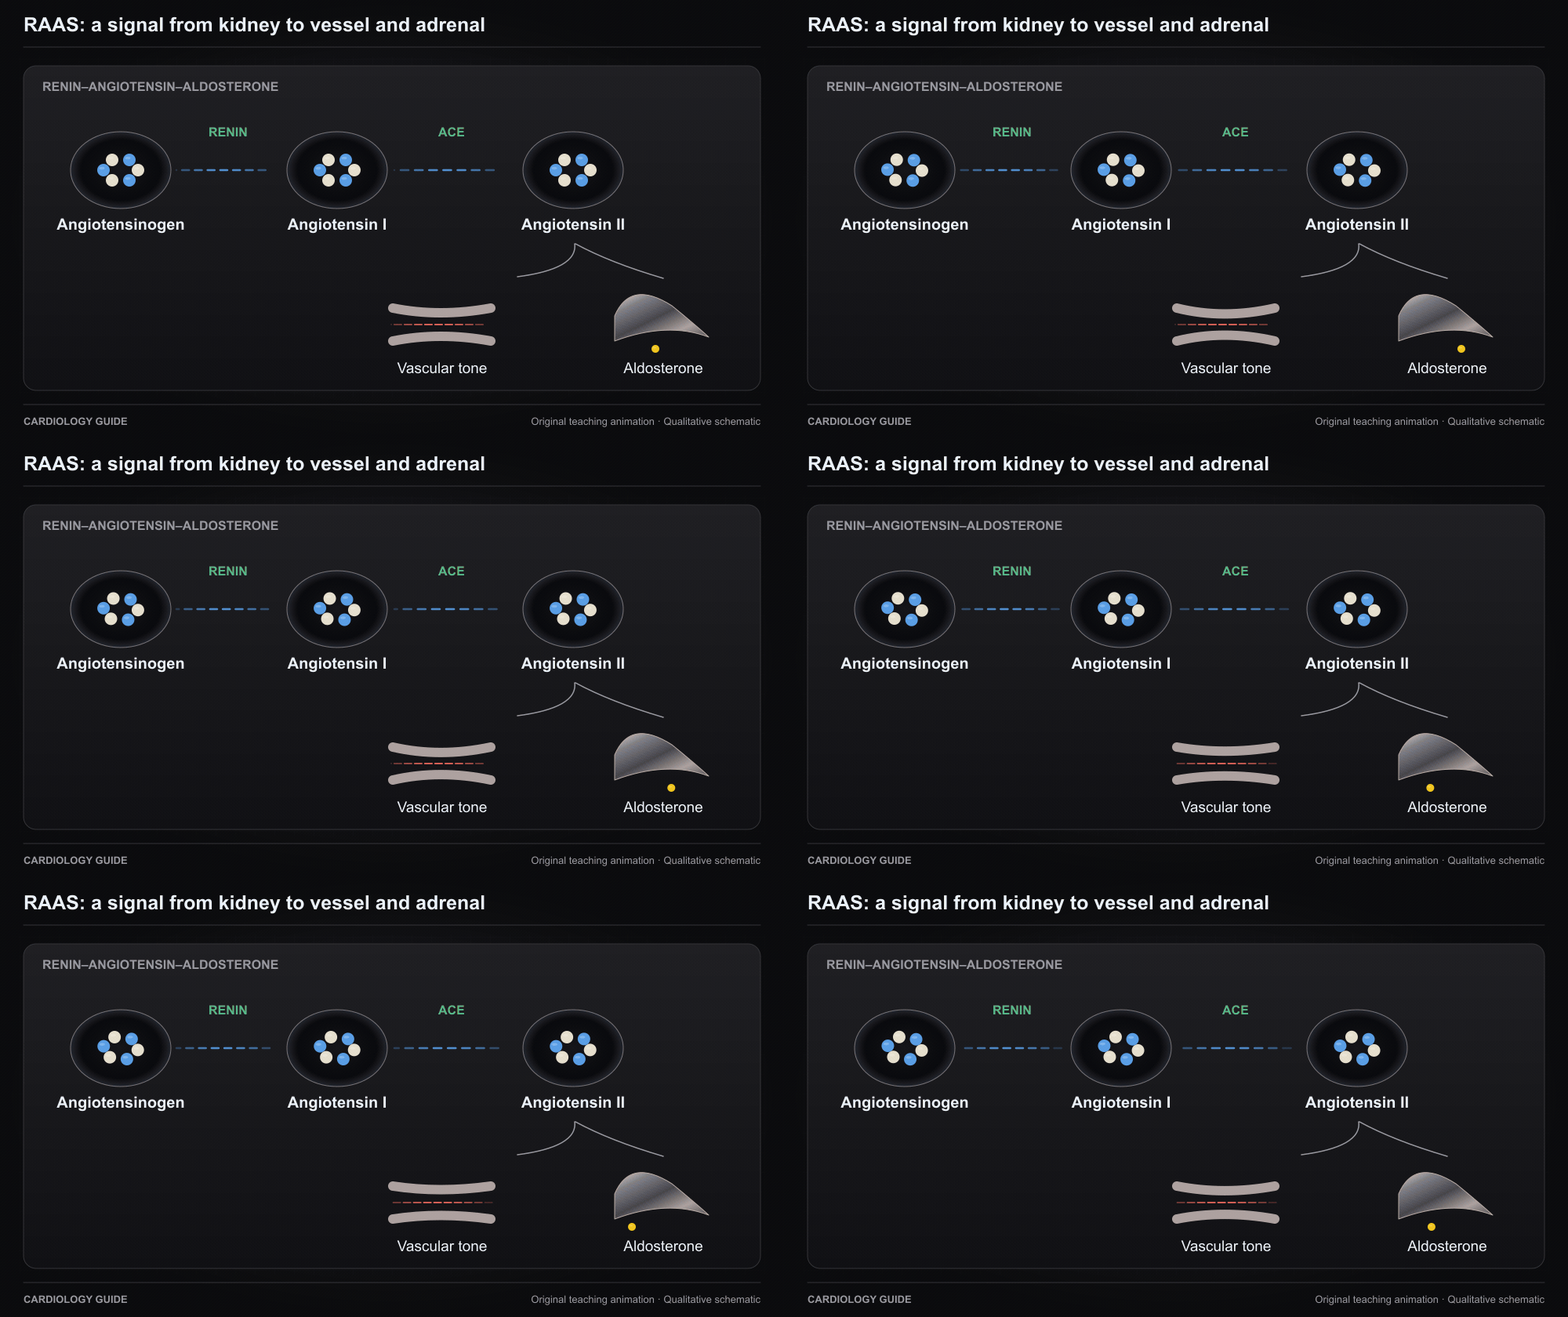
RAAS: a signal from kidney to vessel and adrenal

Renin begins a cascade producing angiotensin II. Angiotensin II activates vascular and adrenal pathways. This is signaling, not the physical path of one molecule.

Cardiology Pharmacology · Heart Failure Comprehensive · Hypertensive Emergencies

Source and interpretation

FDA Entresto prescribing information

Original qualitative teaching schematic. Motion, particles and traces are illustrative. Timing and geometry are simplified.

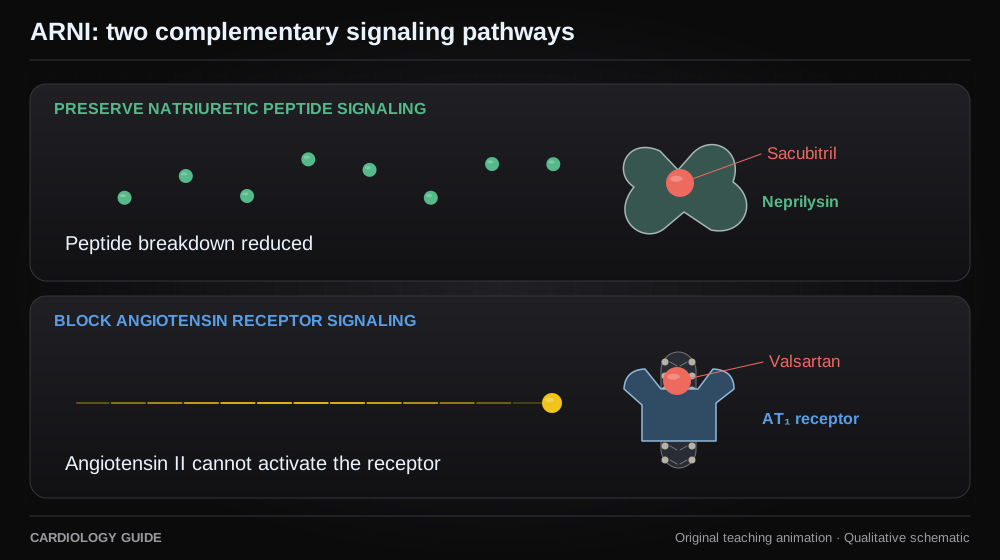
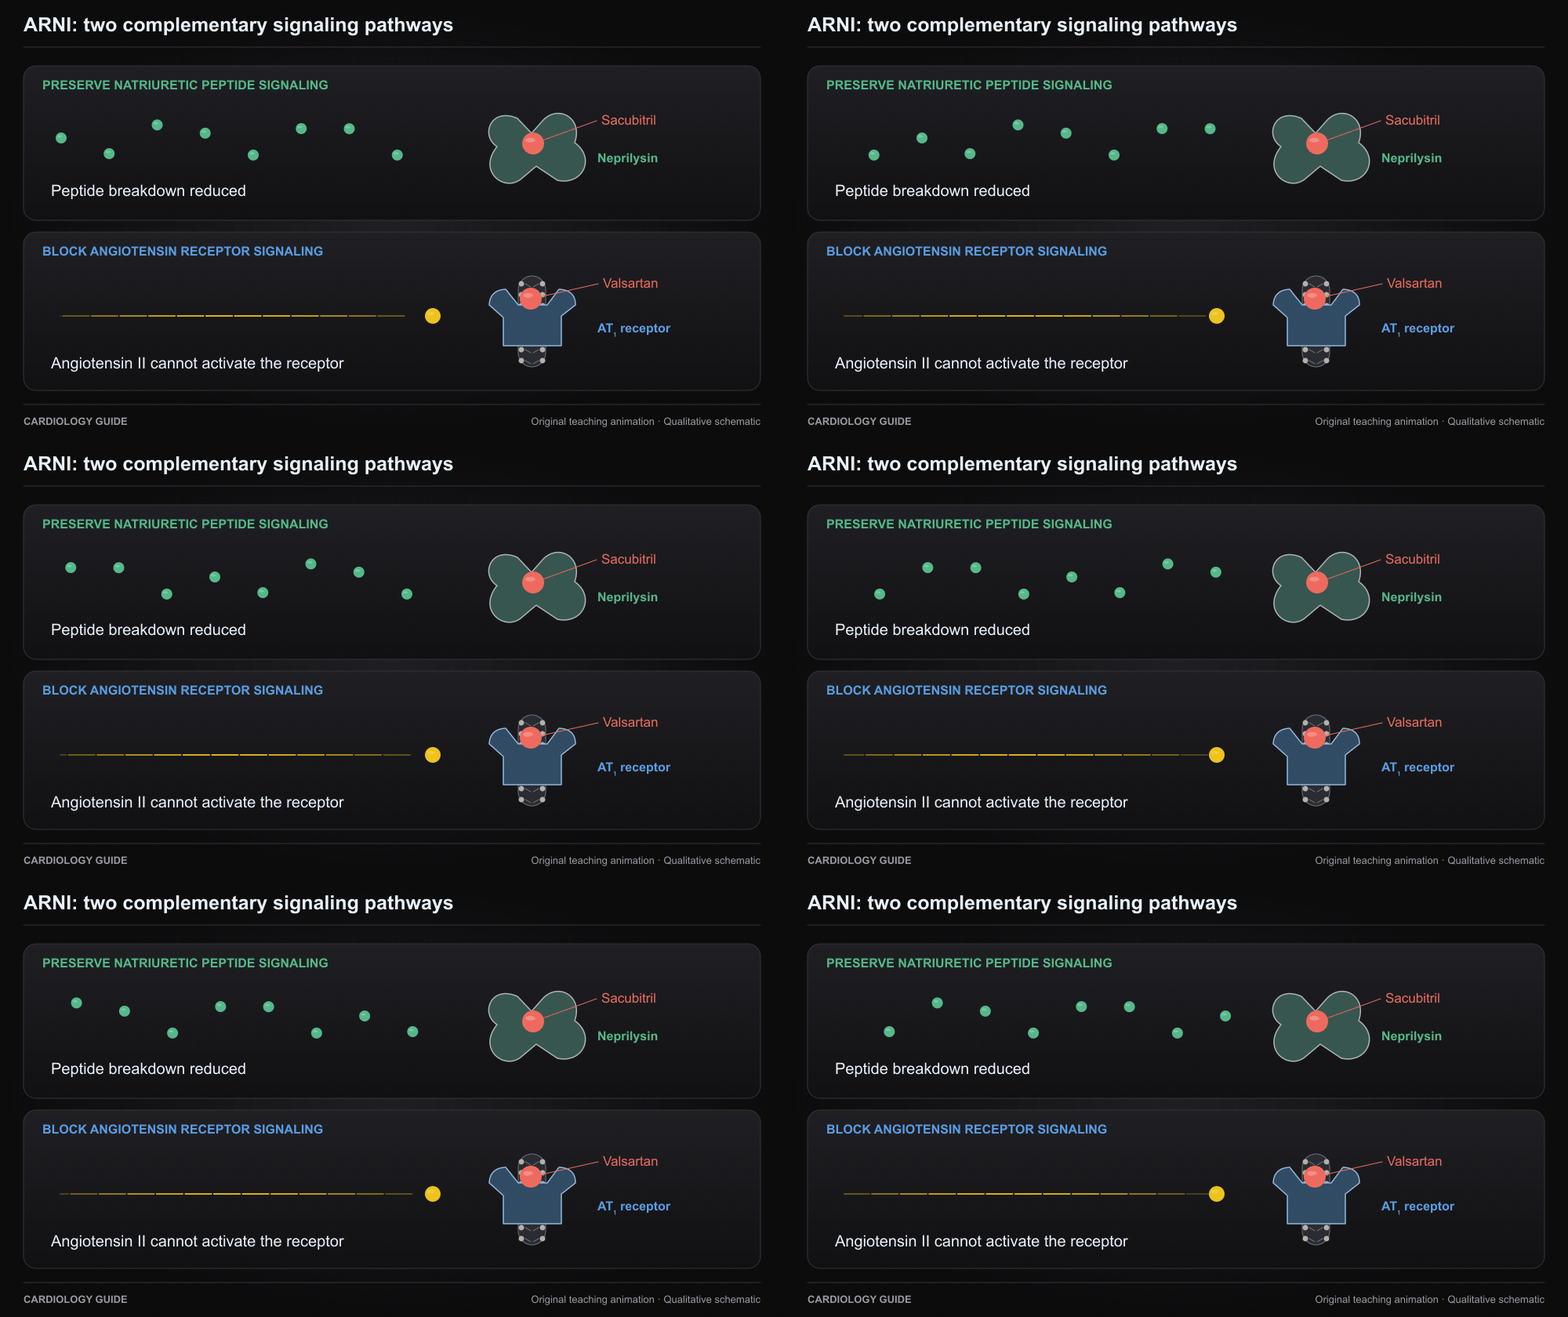
ARNI: two complementary signaling pathways

Sacubitril inhibits neprilysin through its active metabolite. Valsartan blocks the AT1 receptor. The loop separates peptide preservation from angiotensin receptor blockade.

Cardiology Pharmacology · Heart Failure Comprehensive · Sacubitril/valsartan (Entresto) — patient handout

Source and interpretation

FDA Entresto prescribing information

Original qualitative teaching schematic. Motion, particles and traces are illustrative. Timing and geometry are simplified.

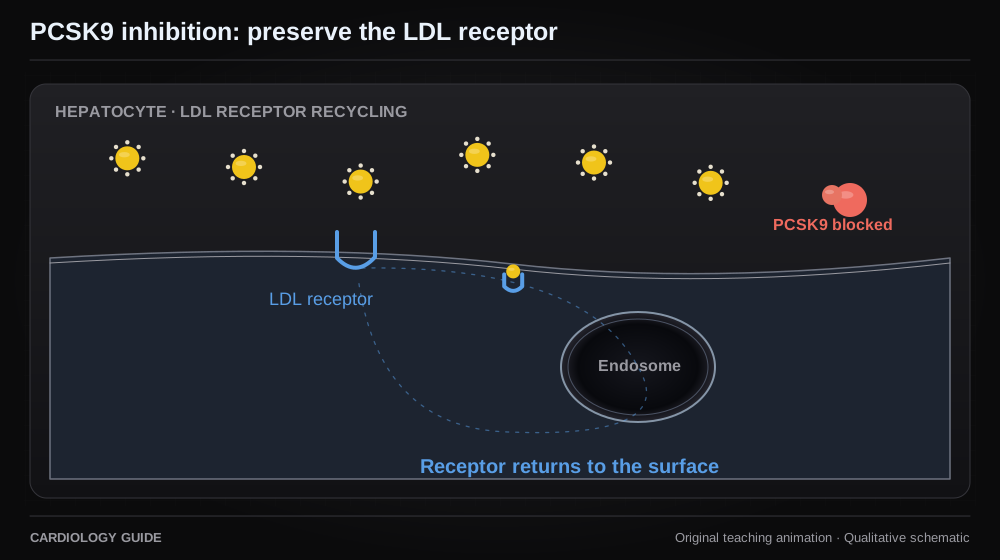
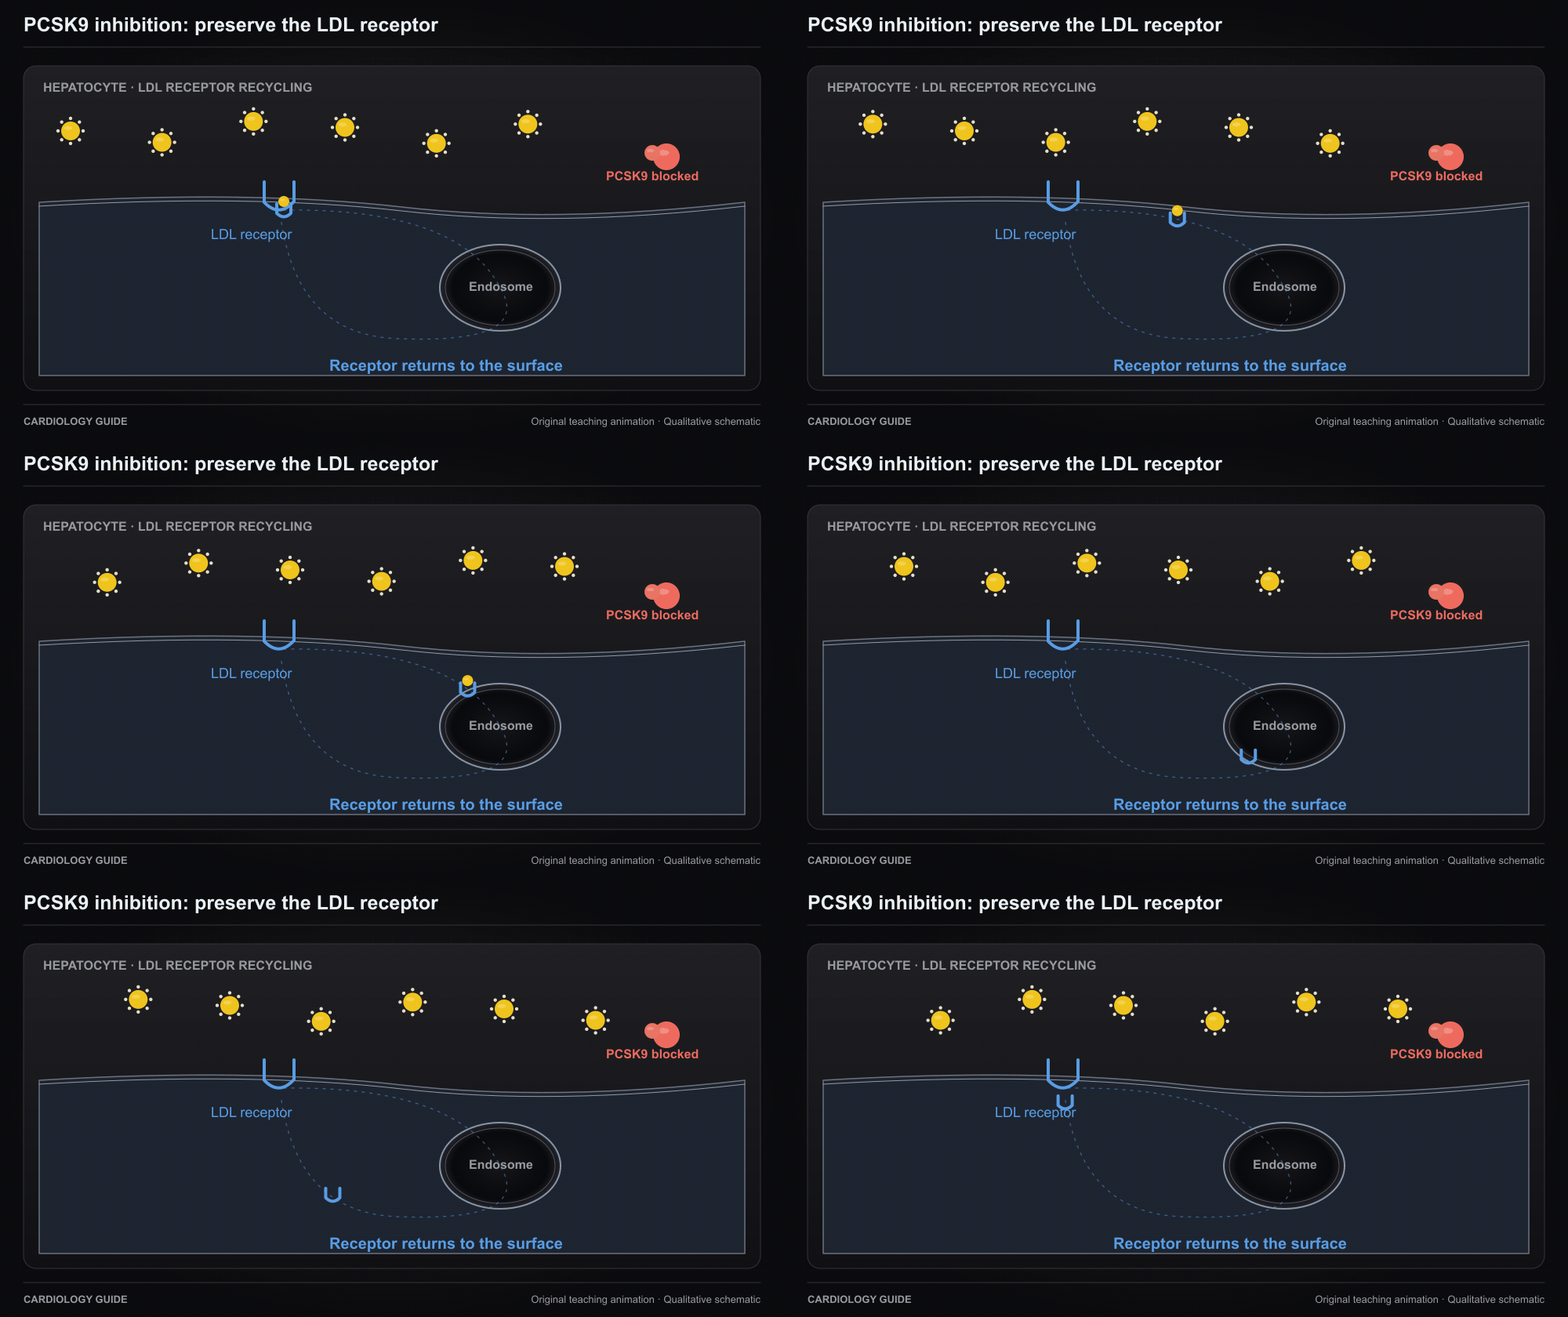
PCSK9 inhibition: preserve the LDL receptor

Blocking PCSK9 binding reduces LDL receptor degradation and supports receptor recycling. The surface and endosomal compartments are simplified.

Cardiology Pharmacology · Statins: Evidence, Safety & Prevention · Cardiovascular Prevention

Source and interpretation

FDA Repatha prescribing information, 2026

Original qualitative teaching schematic. Motion, particles and traces are illustrative. Timing and geometry are simplified.

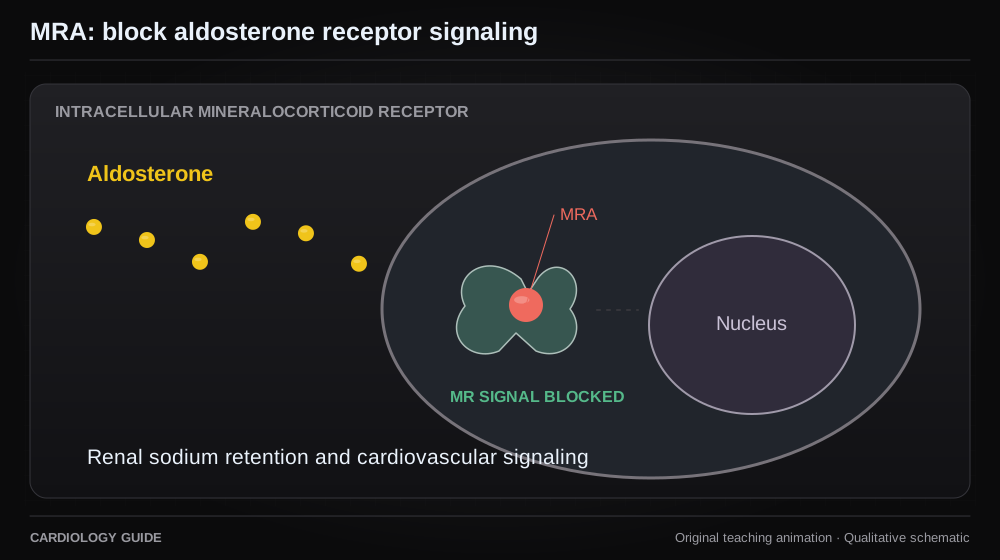
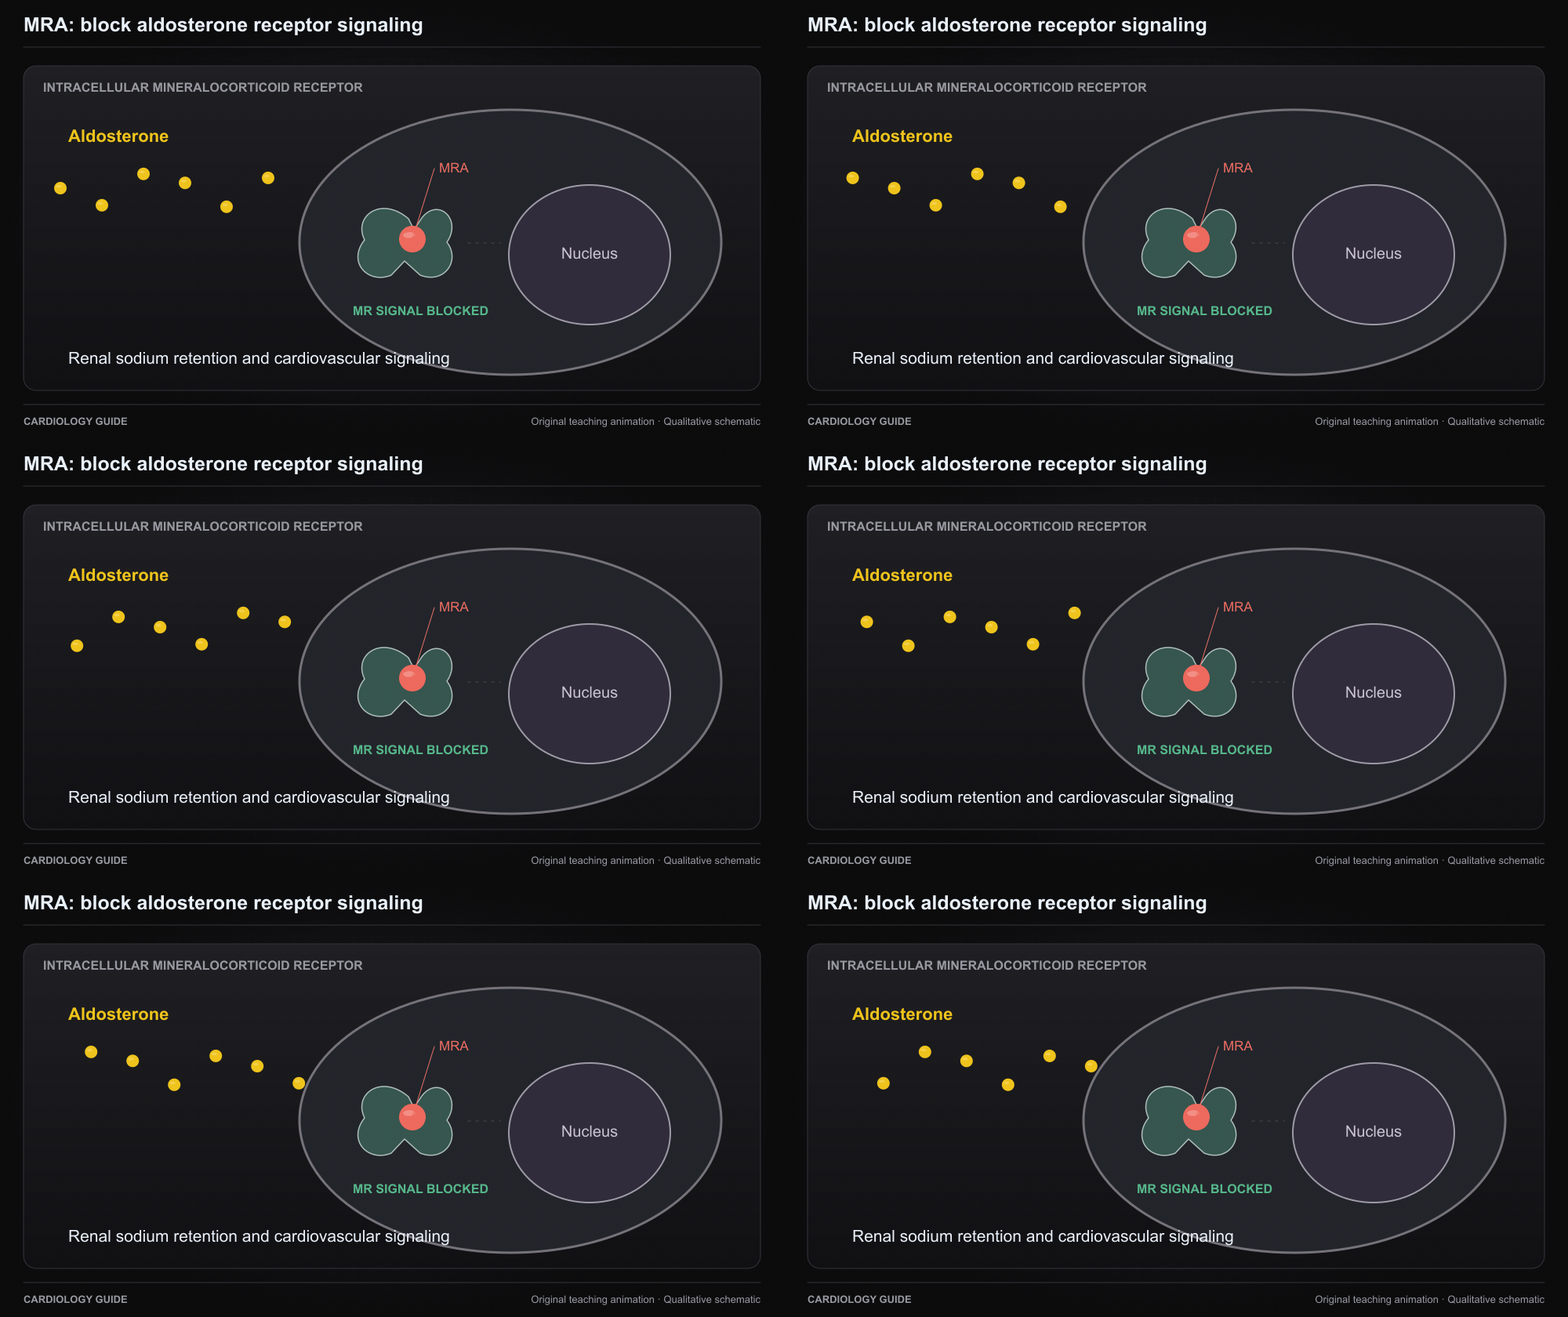
MRA: block aldosterone receptor signaling

Mineralocorticoid receptor antagonists block aldosterone receptor signaling. The kidney and cardiovascular effects are represented as pathways, not measured effects.

Cardiology Pharmacology · MRAs for reduced ejection fraction — patient handout · MRAs for HFpEF / mildly reduced EF — patient handout · Heart Failure Comprehensive

Source and interpretation

FDA spironolactone prescribing information

Original qualitative teaching schematic. Motion, particles and traces are illustrative. Timing and geometry are simplified.

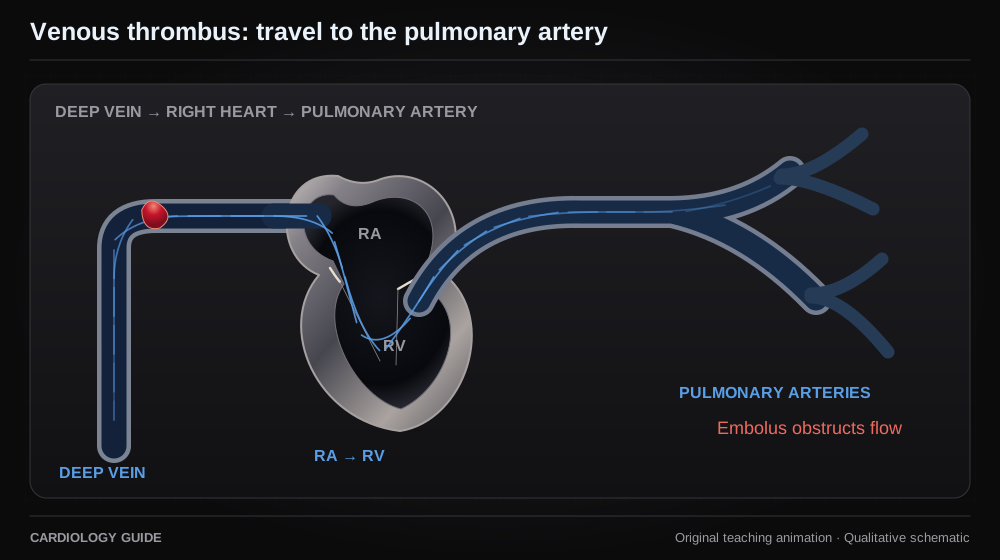
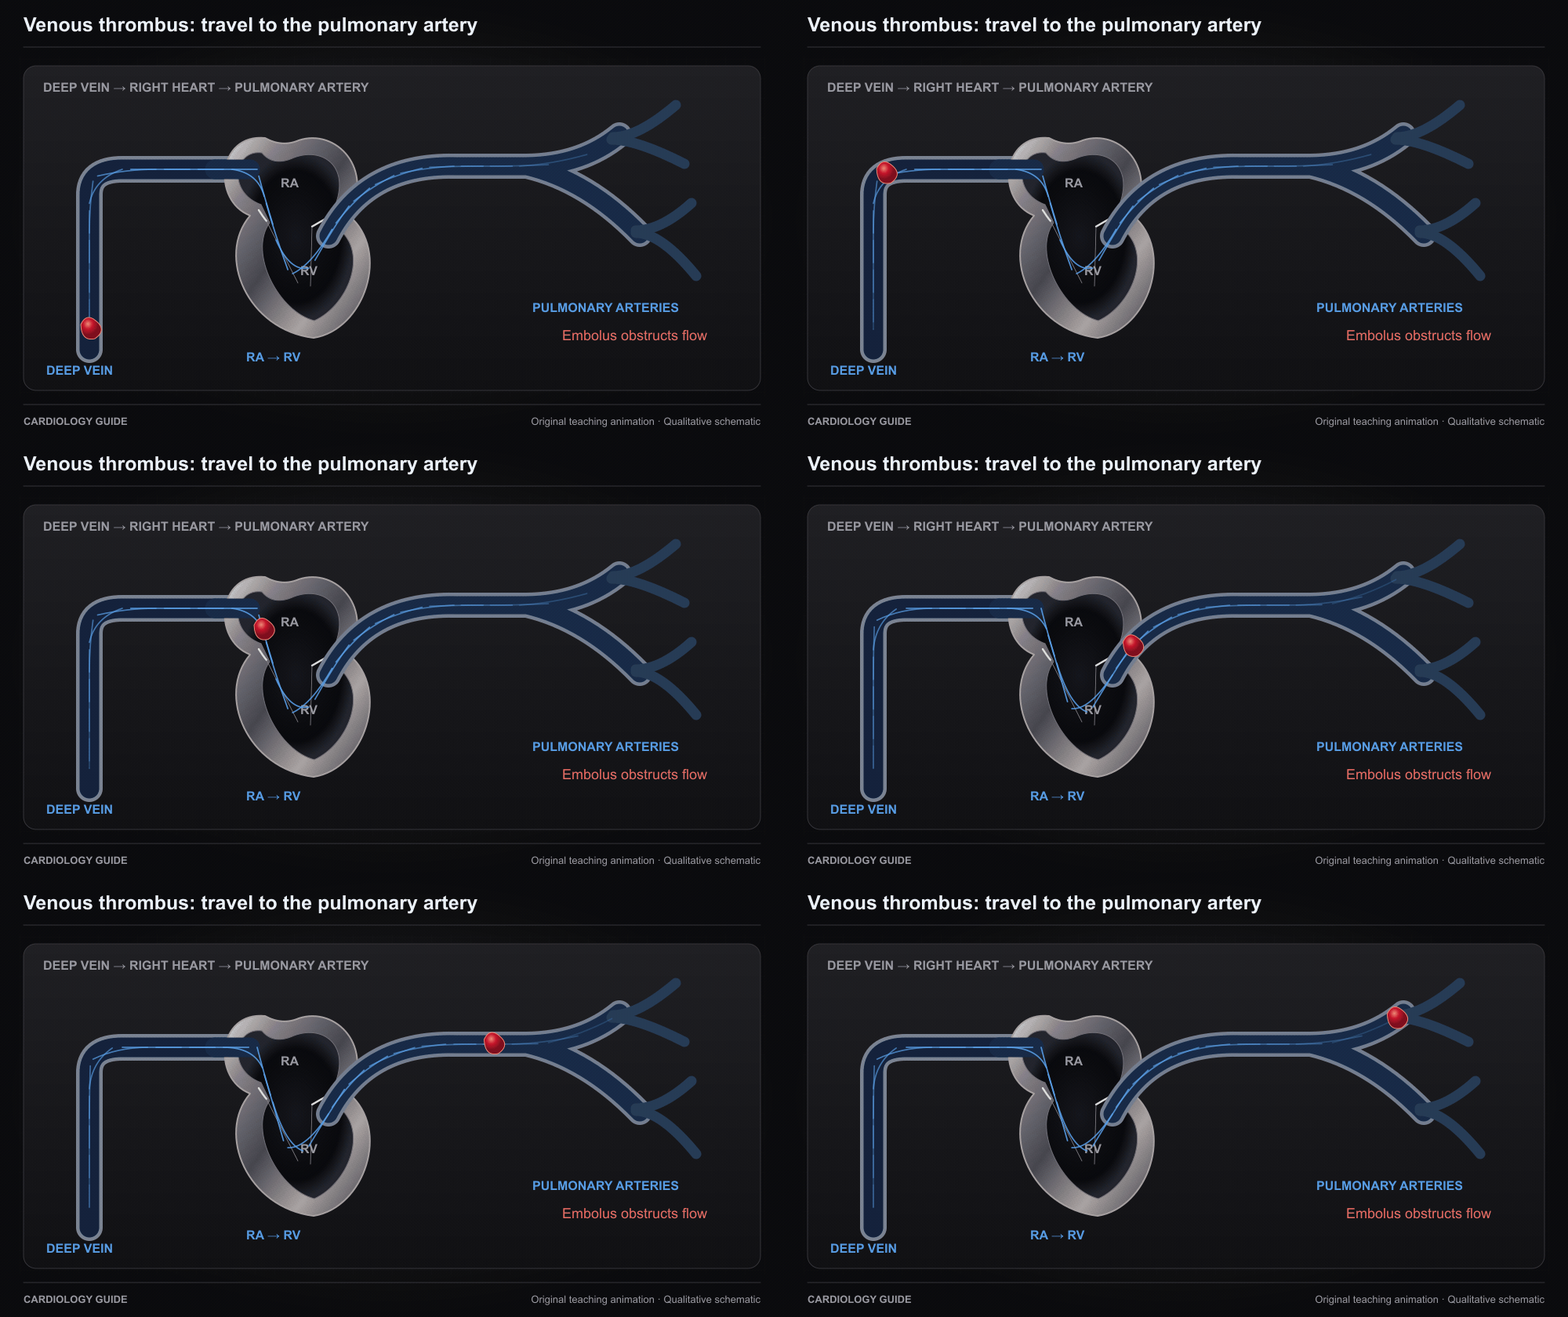
Venous thrombus: travel to the pulmonary artery

An embolus can detach from a deep-vein thrombus and pass through the right heart to a pulmonary artery. Schematic route, without a time or size scale.

Pulmonary Embolism & VTE · Thrombosis, Embolism & Bleeding · Vascular Medicine

Source and interpretation

ESC pulmonary embolism guideline

Original qualitative teaching schematic. Motion, particles and traces are illustrative. Timing and geometry are simplified.

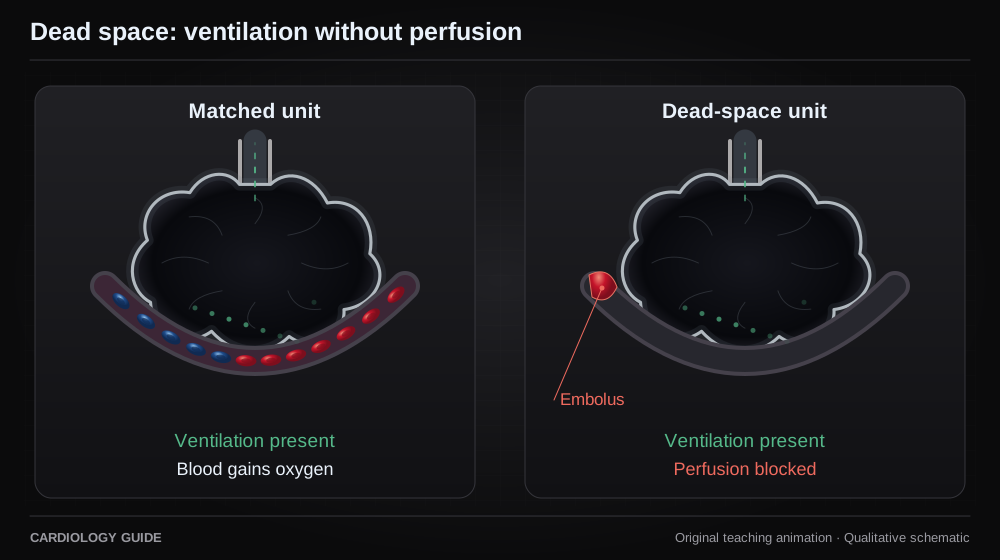
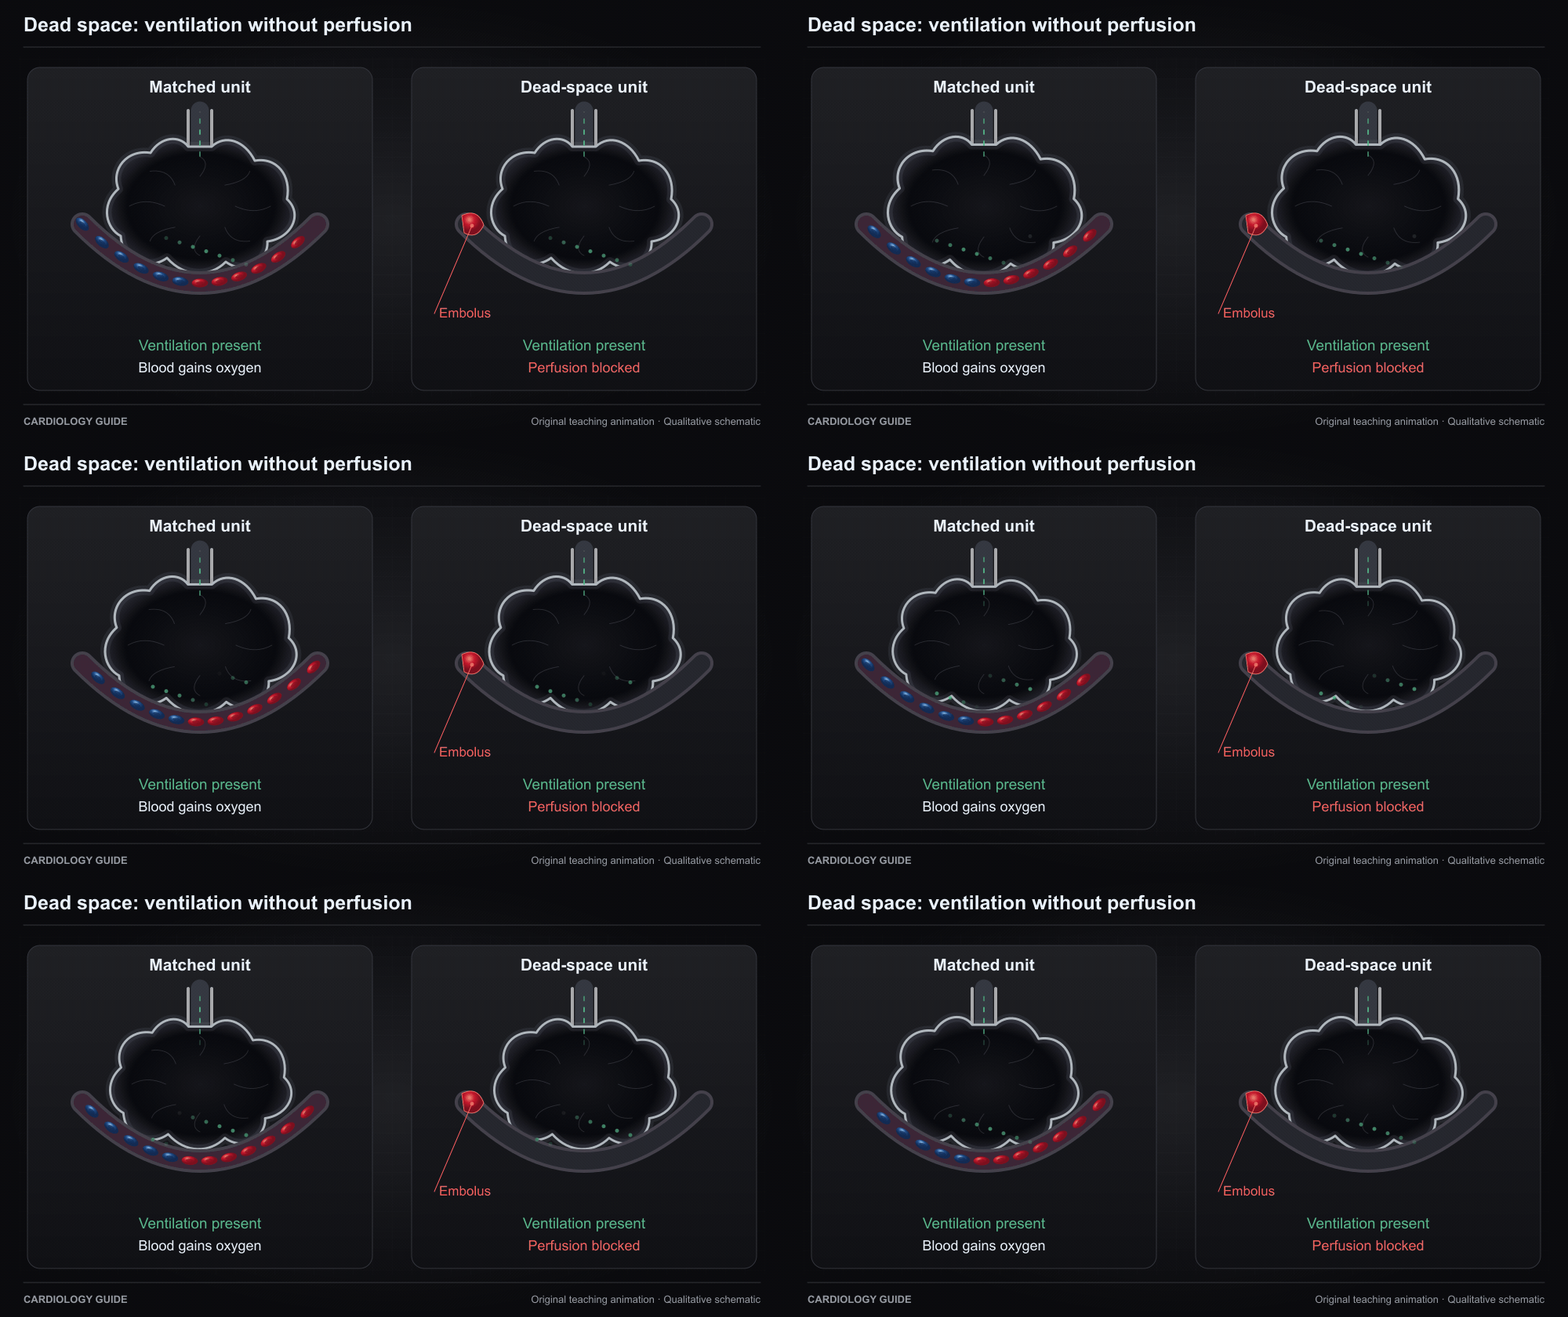
Dead space: ventilation without perfusion

A ventilated alveolus loses effective capillary perfusion downstream from obstruction. Real pulmonary embolism also redistributes flow and creates other V/Q abnormalities.

Pulmonary Embolism & VTE · Ventilator Management · Control of Breathing and Dyspnea

Source and interpretation

ESC pulmonary embolism guideline

Original qualitative teaching schematic. Motion, particles and traces are illustrative. Timing and geometry are simplified.

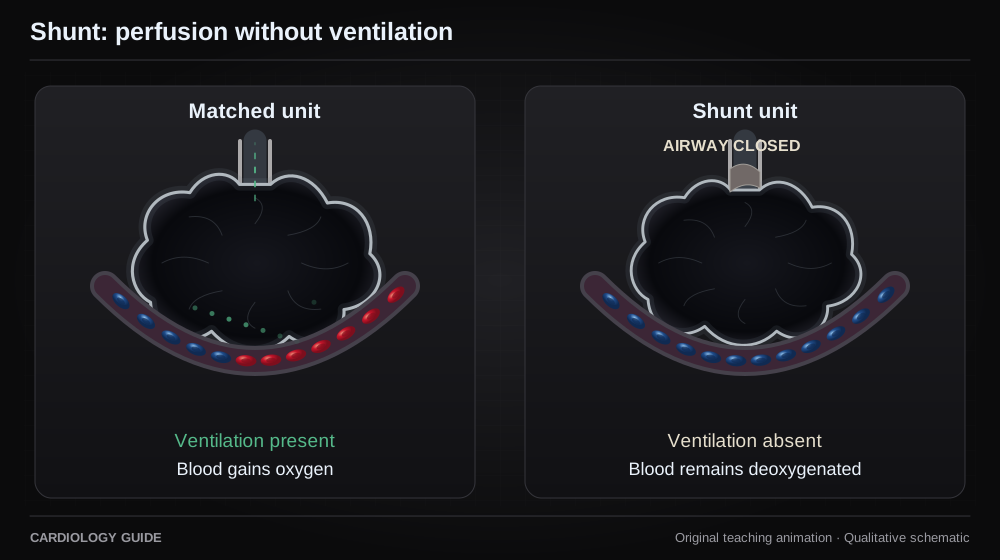
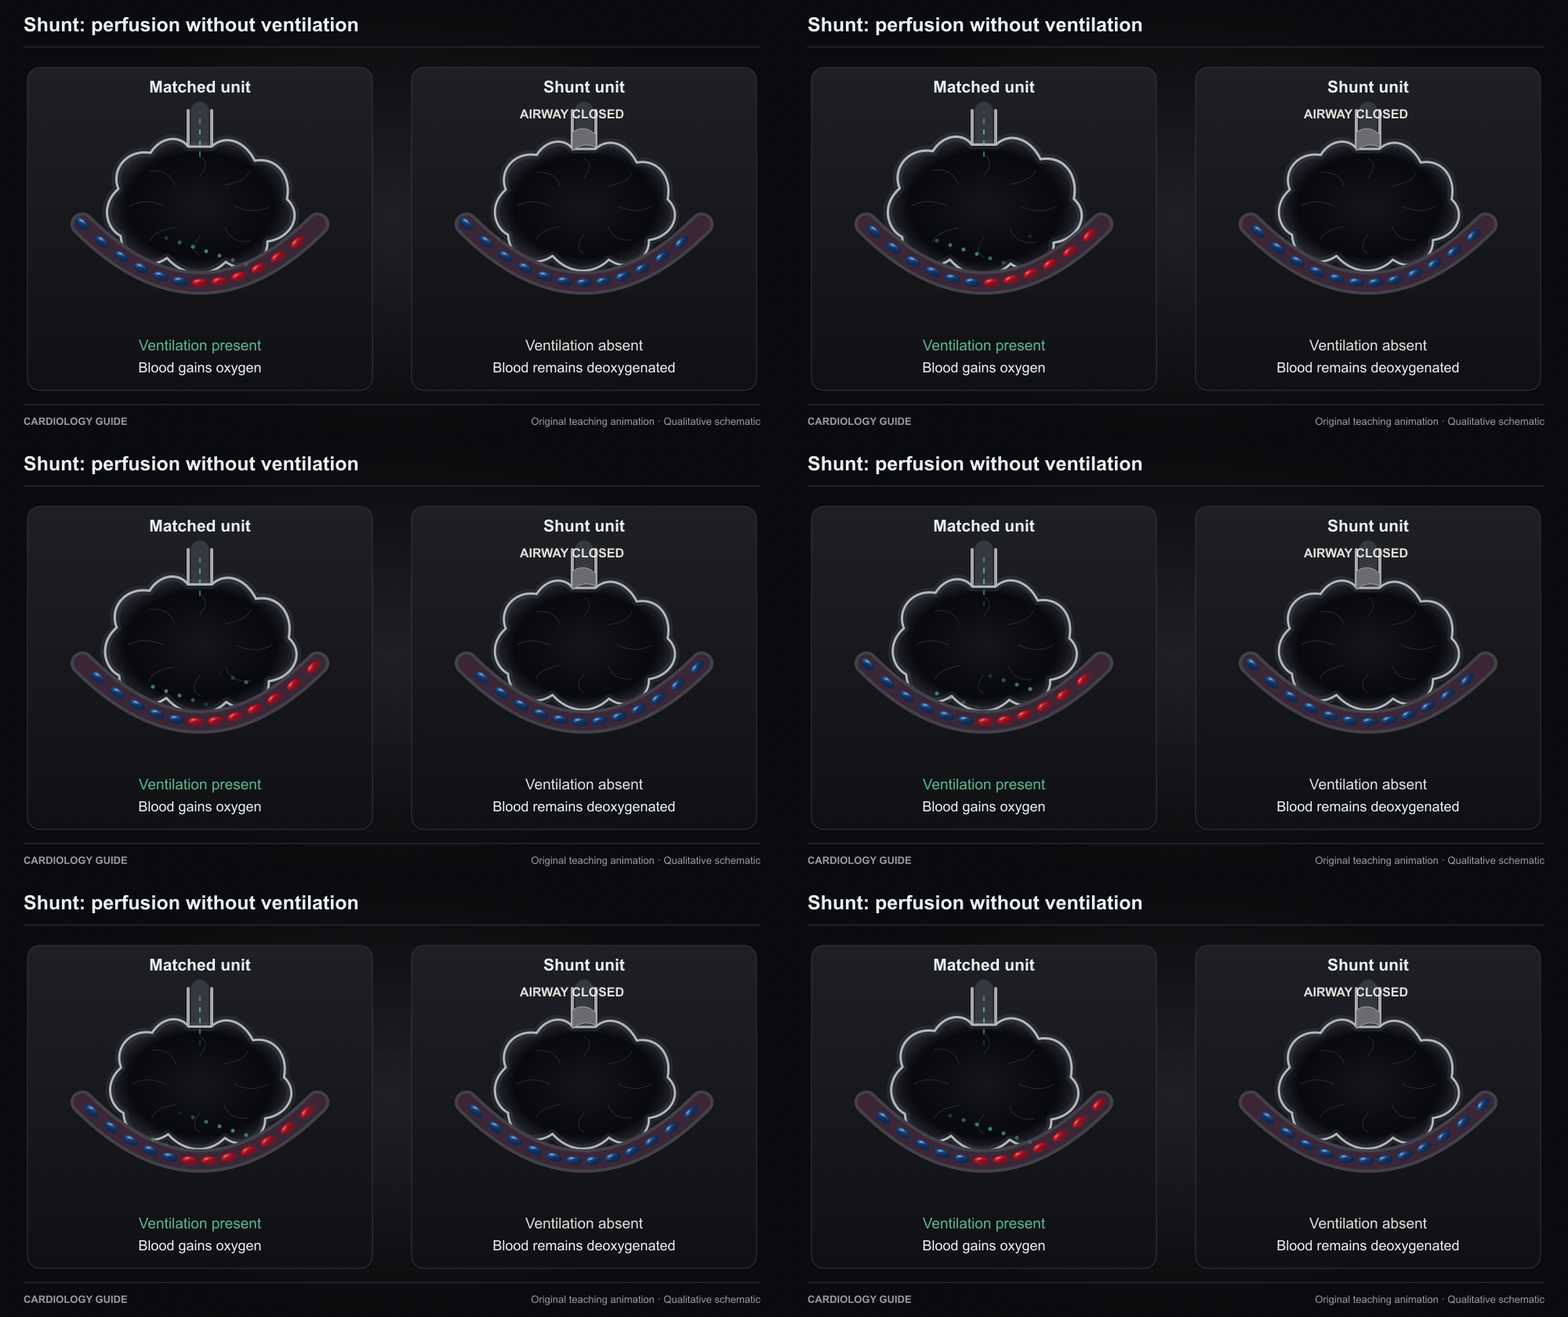
Shunt: perfusion without ventilation

Blood crosses an unventilated lung unit without gaining oxygen there. The diagram isolates a shunt mechanism and does not show the entire cause of hypoxemia.

Ventilator Management · Control of Breathing and Dyspnea

Source and interpretation

Riley and Cournand: ideal alveolar air and ventilation-perfusion relationships

Original qualitative teaching schematic. Motion, particles and traces are illustrative. Timing and geometry are simplified.

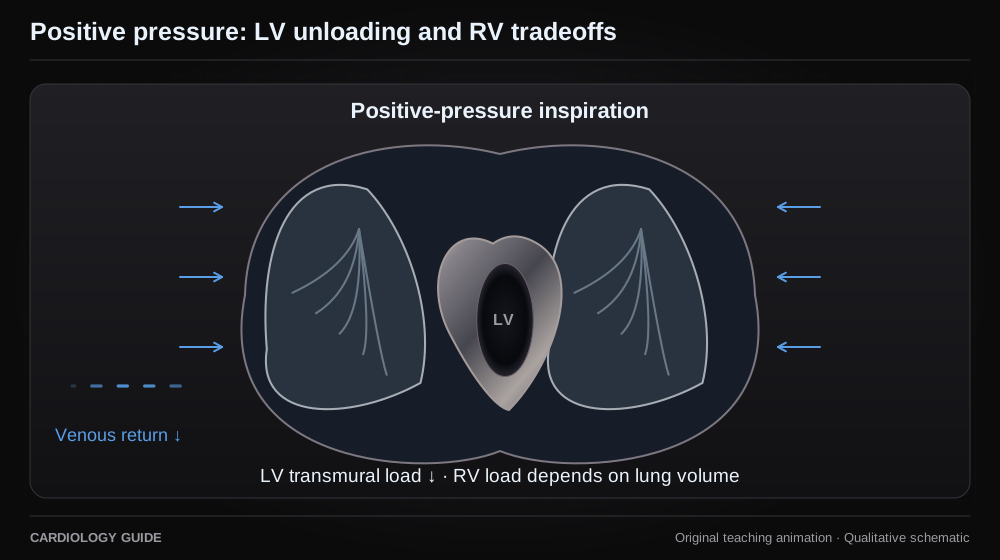
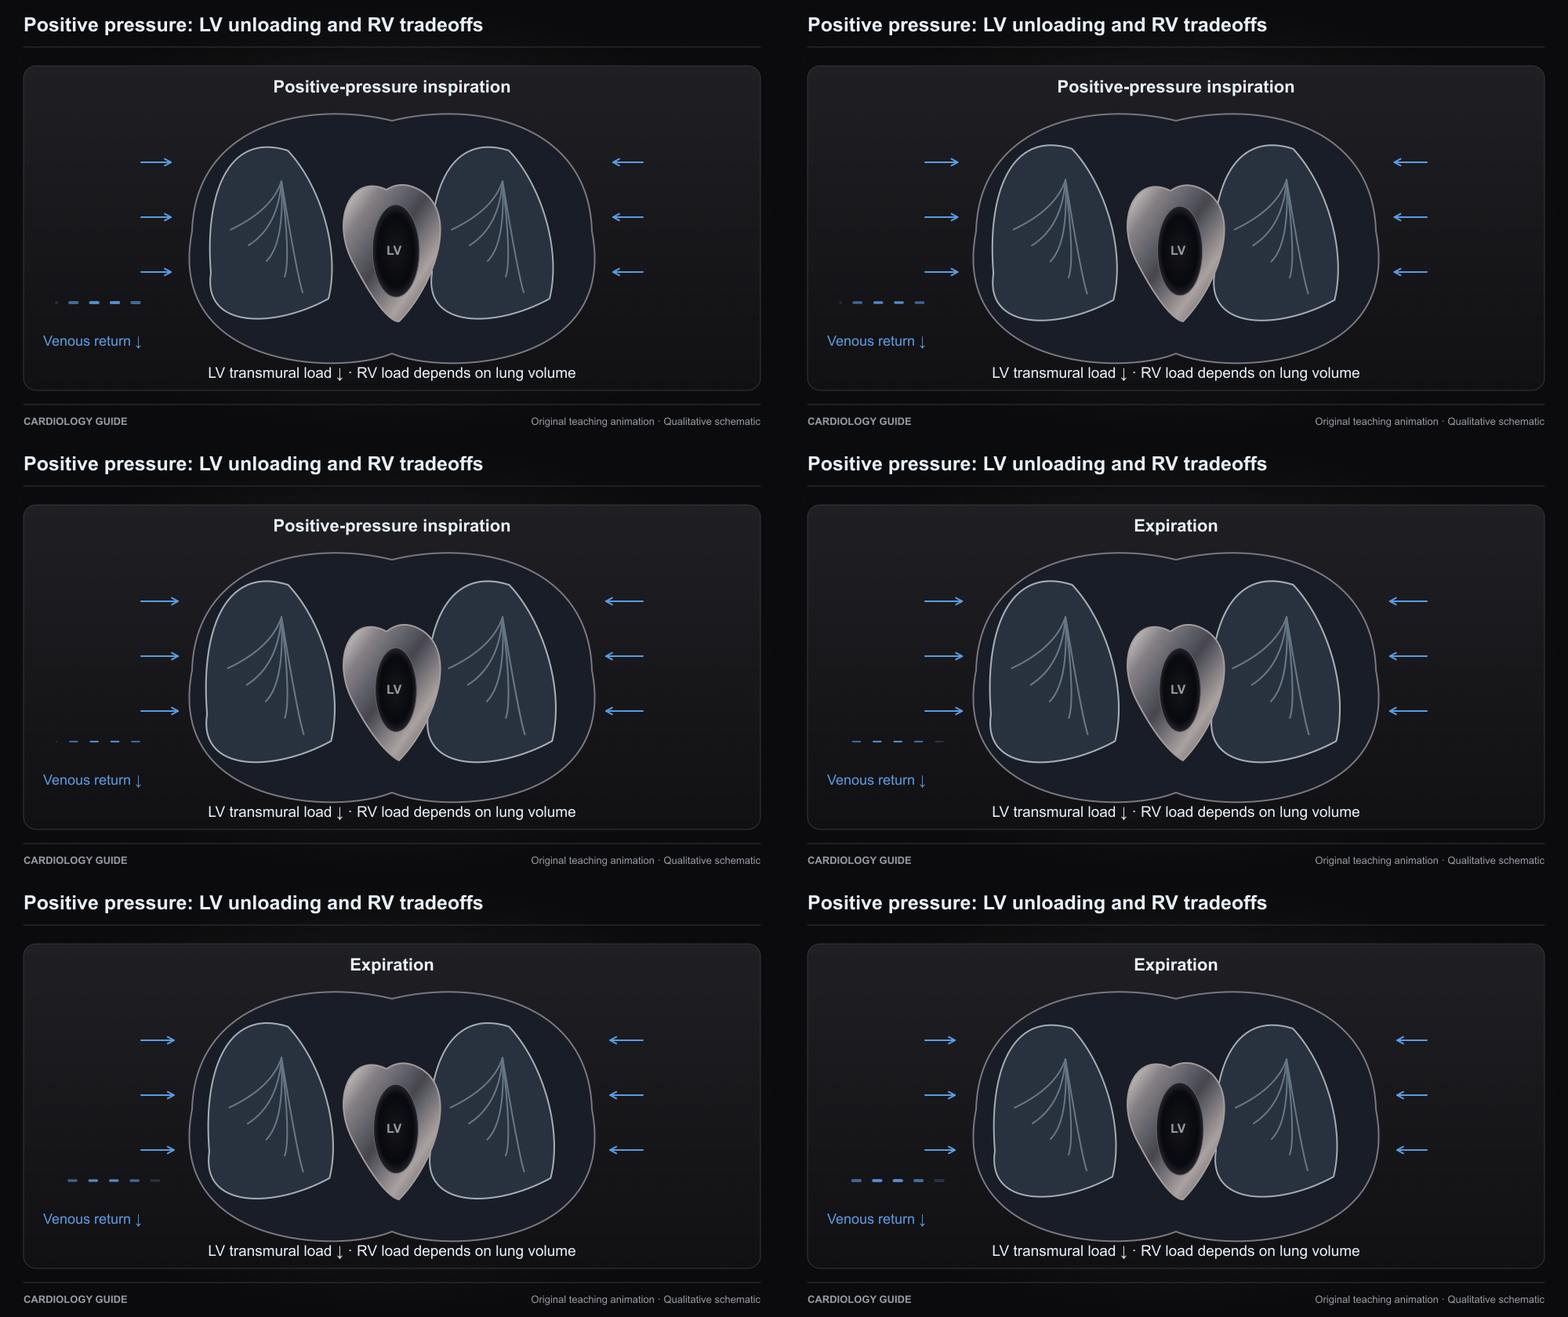
Positive pressure: LV unloading and RV tradeoffs

Rising intrathoracic pressure can reduce LV transmural afterload and the venous-return gradient. Lung overdistension can raise RV afterload. These effects are context dependent.

Ventilator Management · Heart Failure Comprehensive · Right Ventricular Failure

Source and interpretation

Pinsky et al. Augmentation of cardiac function by elevation of intrathoracic pressure

Original qualitative teaching schematic. Motion, particles and traces are illustrative. Timing and geometry are simplified.

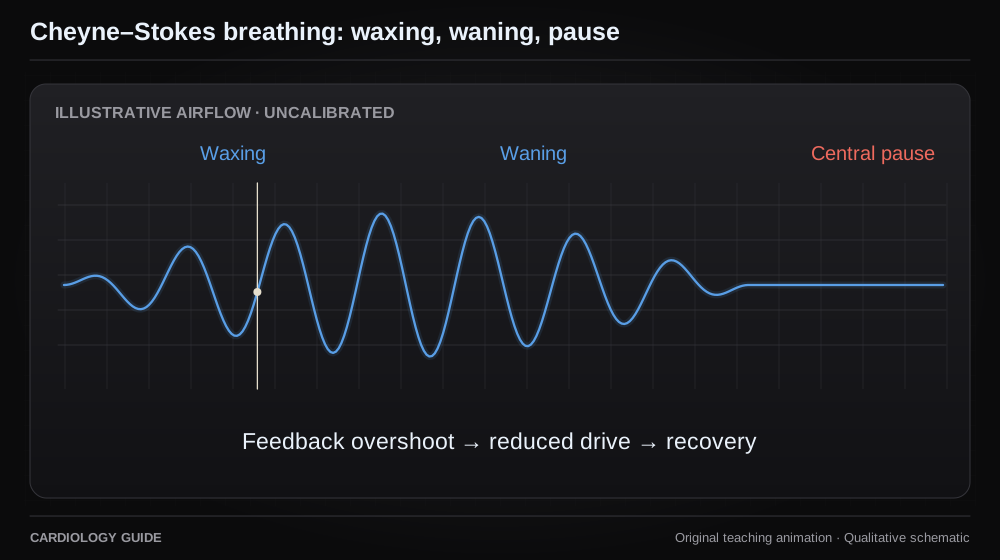
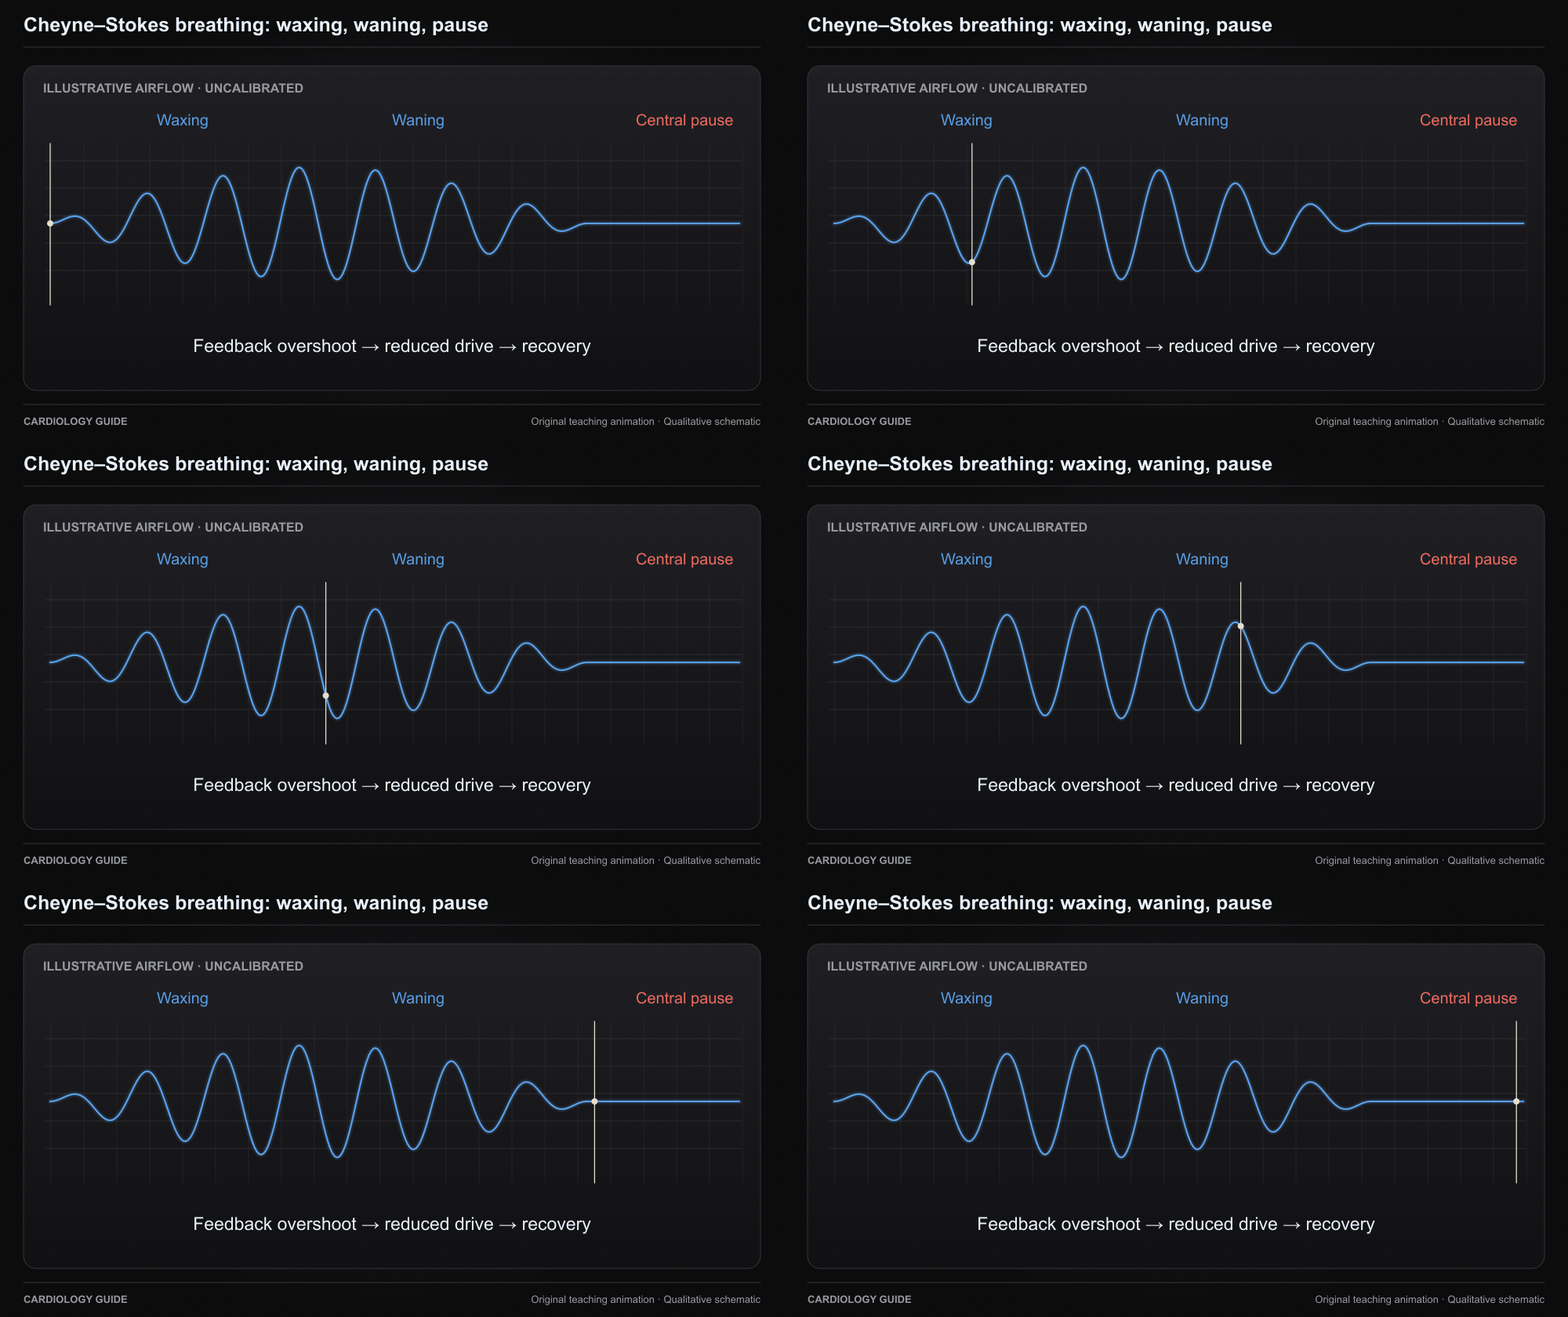
Cheyne–Stokes breathing: waxing, waning, pause

The airflow envelope waxes and wanes around central pauses. Delayed feedback and ventilatory instability contribute in heart failure. The cursor has no calibrated time scale.

Control of Breathing and Dyspnea · Heart Failure Comprehensive

Source and interpretation

Lorenzi-Filho et al. Effects of CO₂ and oxygen on Cheyne–Stokes respiration

Original qualitative teaching schematic. Motion, particles and traces are illustrative. Timing and geometry are simplified.

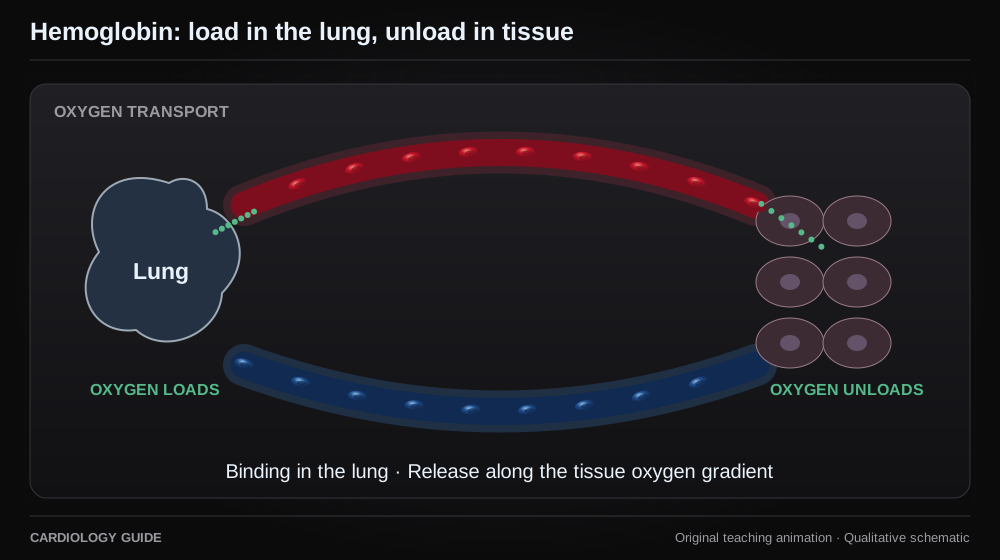
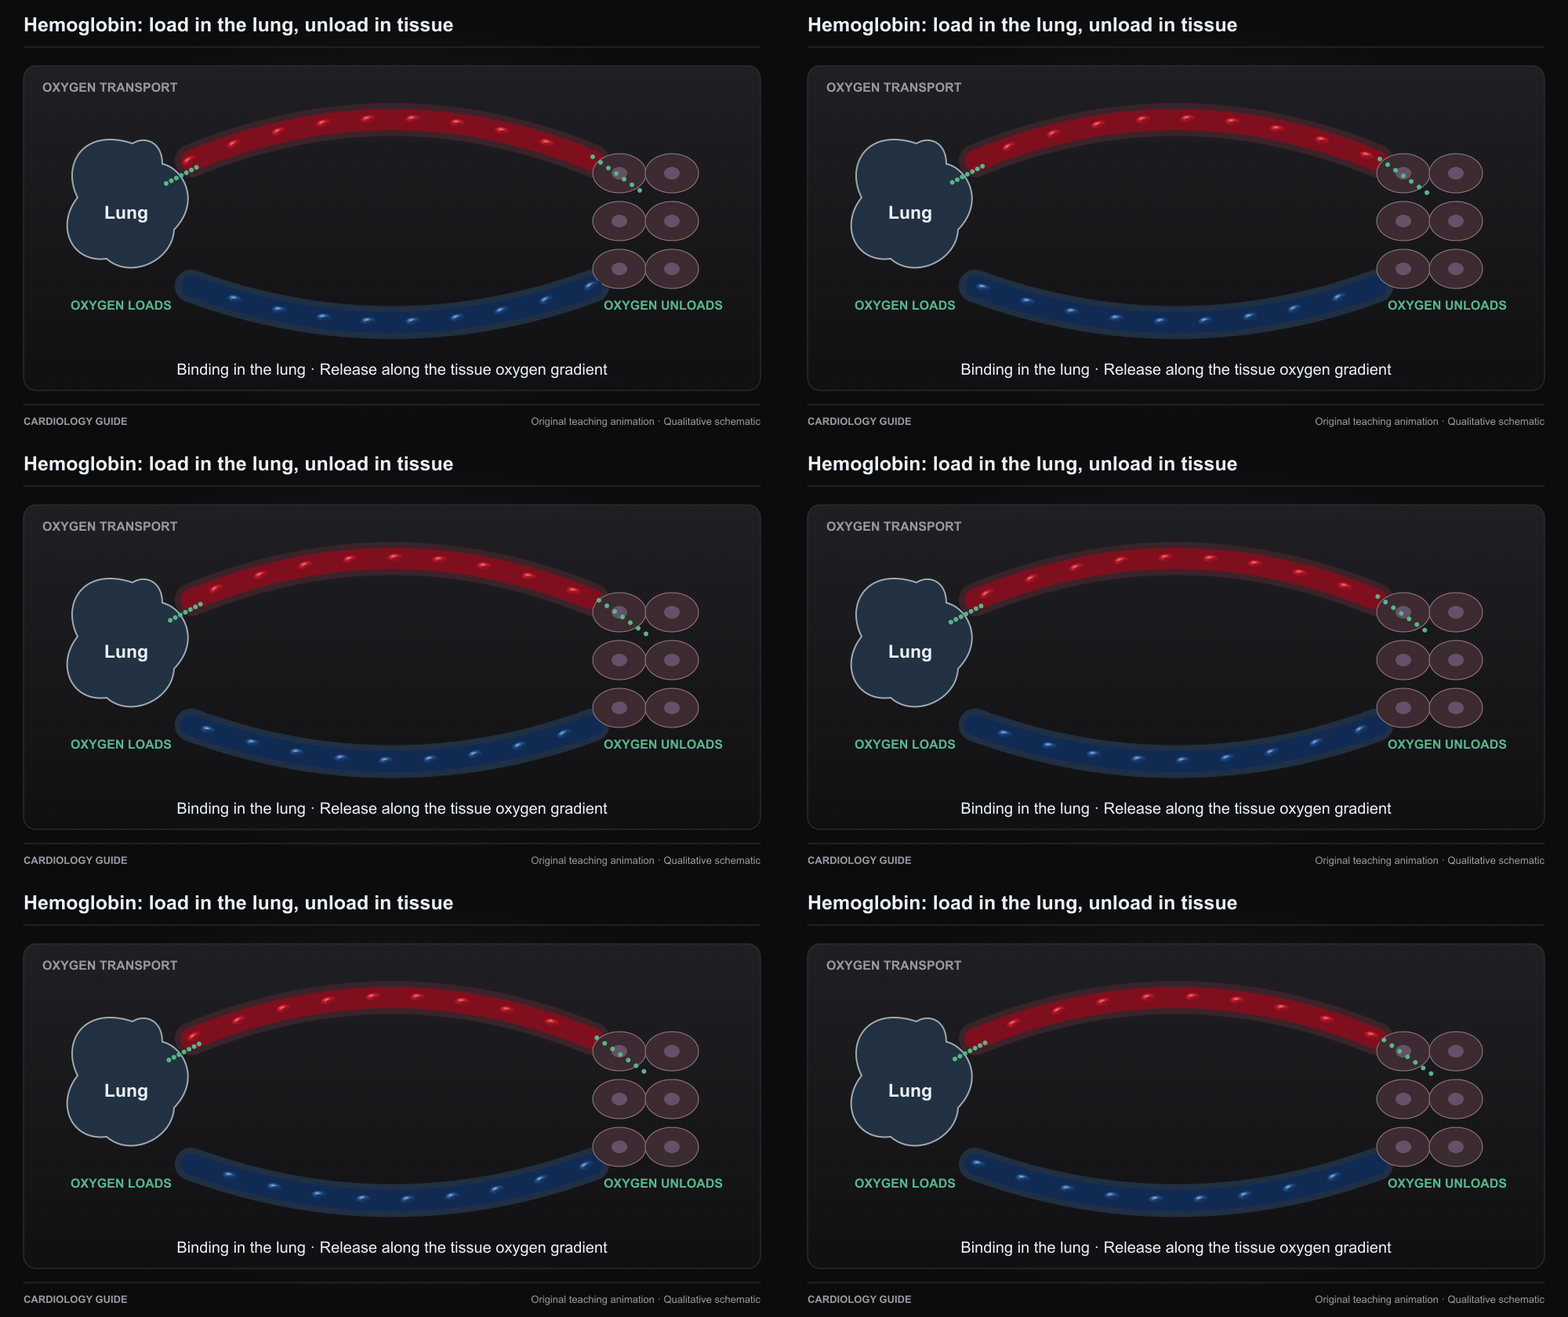
Hemoglobin: load in the lung, unload in tissue

Hemoglobin binds oxygen in the lung and releases it along the tissue oxygen gradient. The dots are qualitative and do not depict a measured oxygen content or saturation.

Cardiopulmonary Exercise Testing · Ventilator Management · Control of Breathing and Dyspnea

Source and interpretation

Severinghaus: equations for human blood oxygen dissociation computations

Original qualitative teaching schematic. Motion, particles and traces are illustrative. Timing and geometry are simplified.