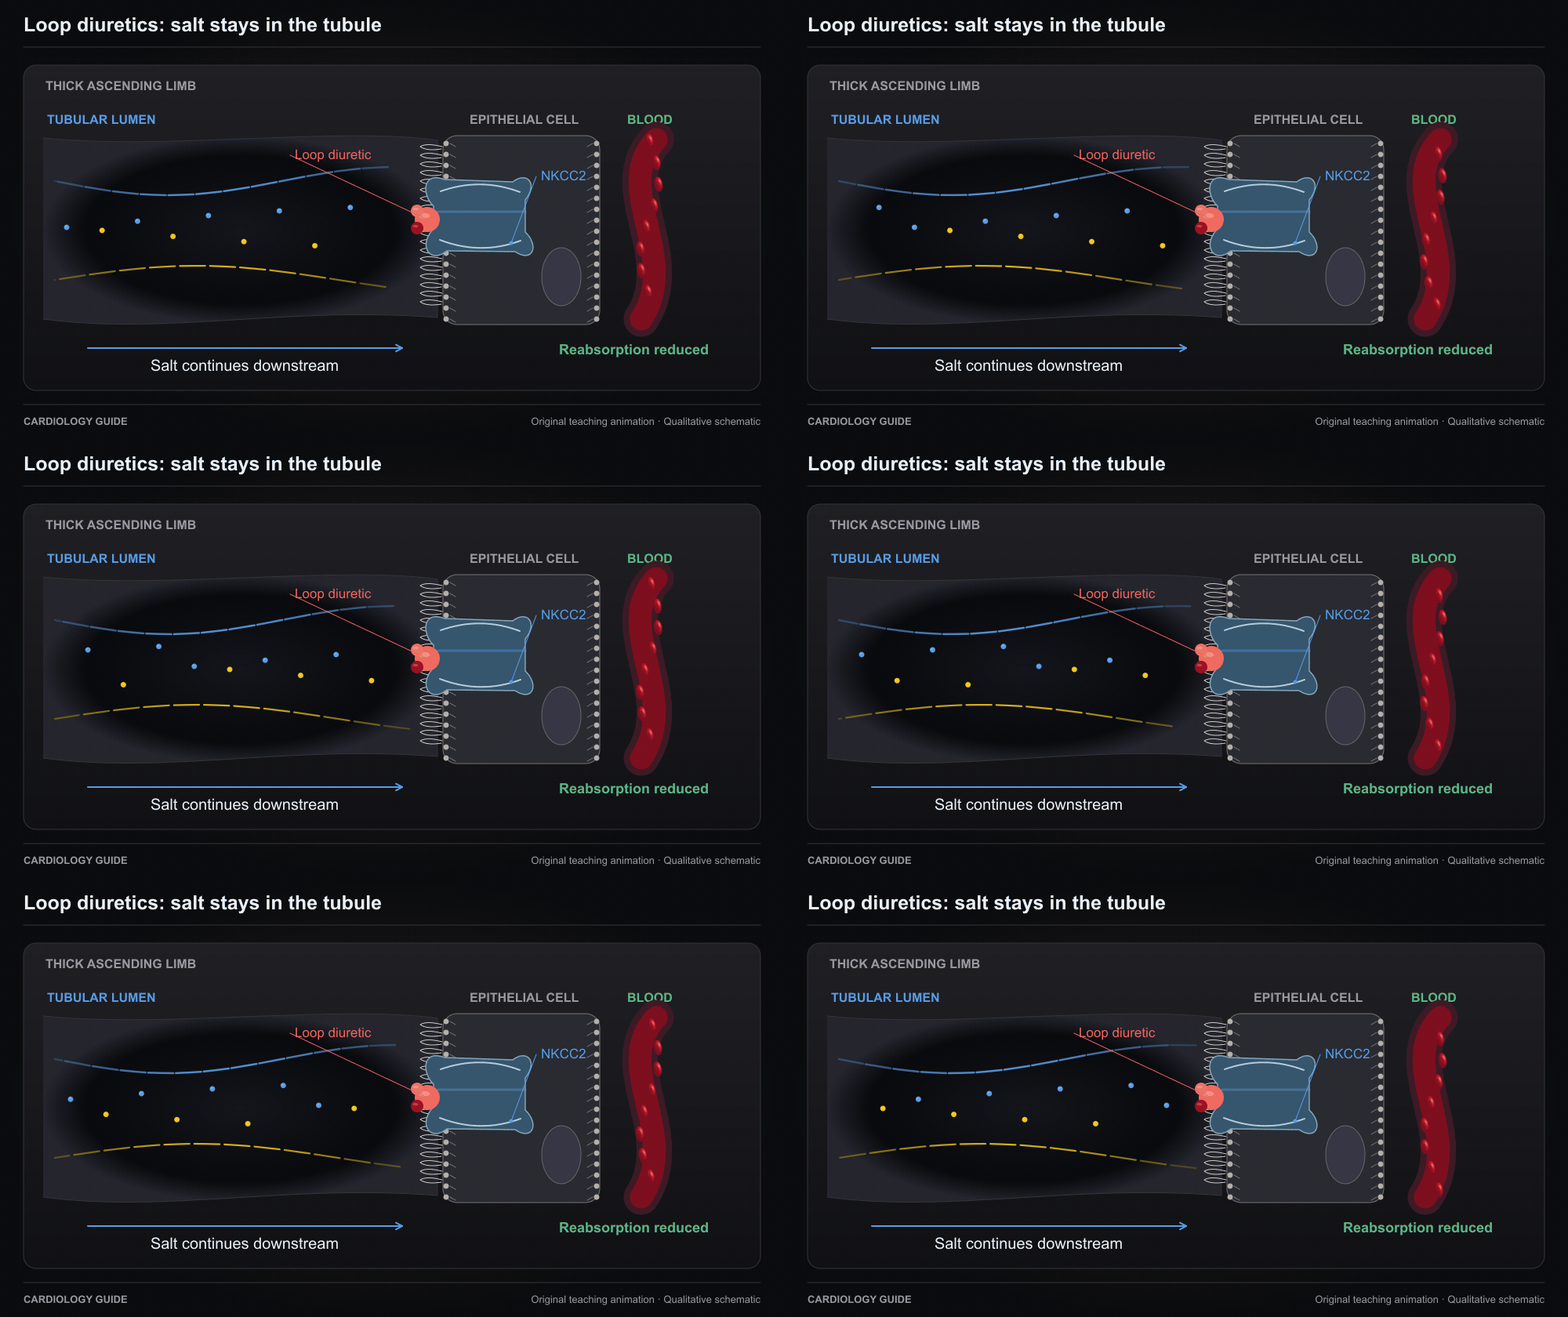
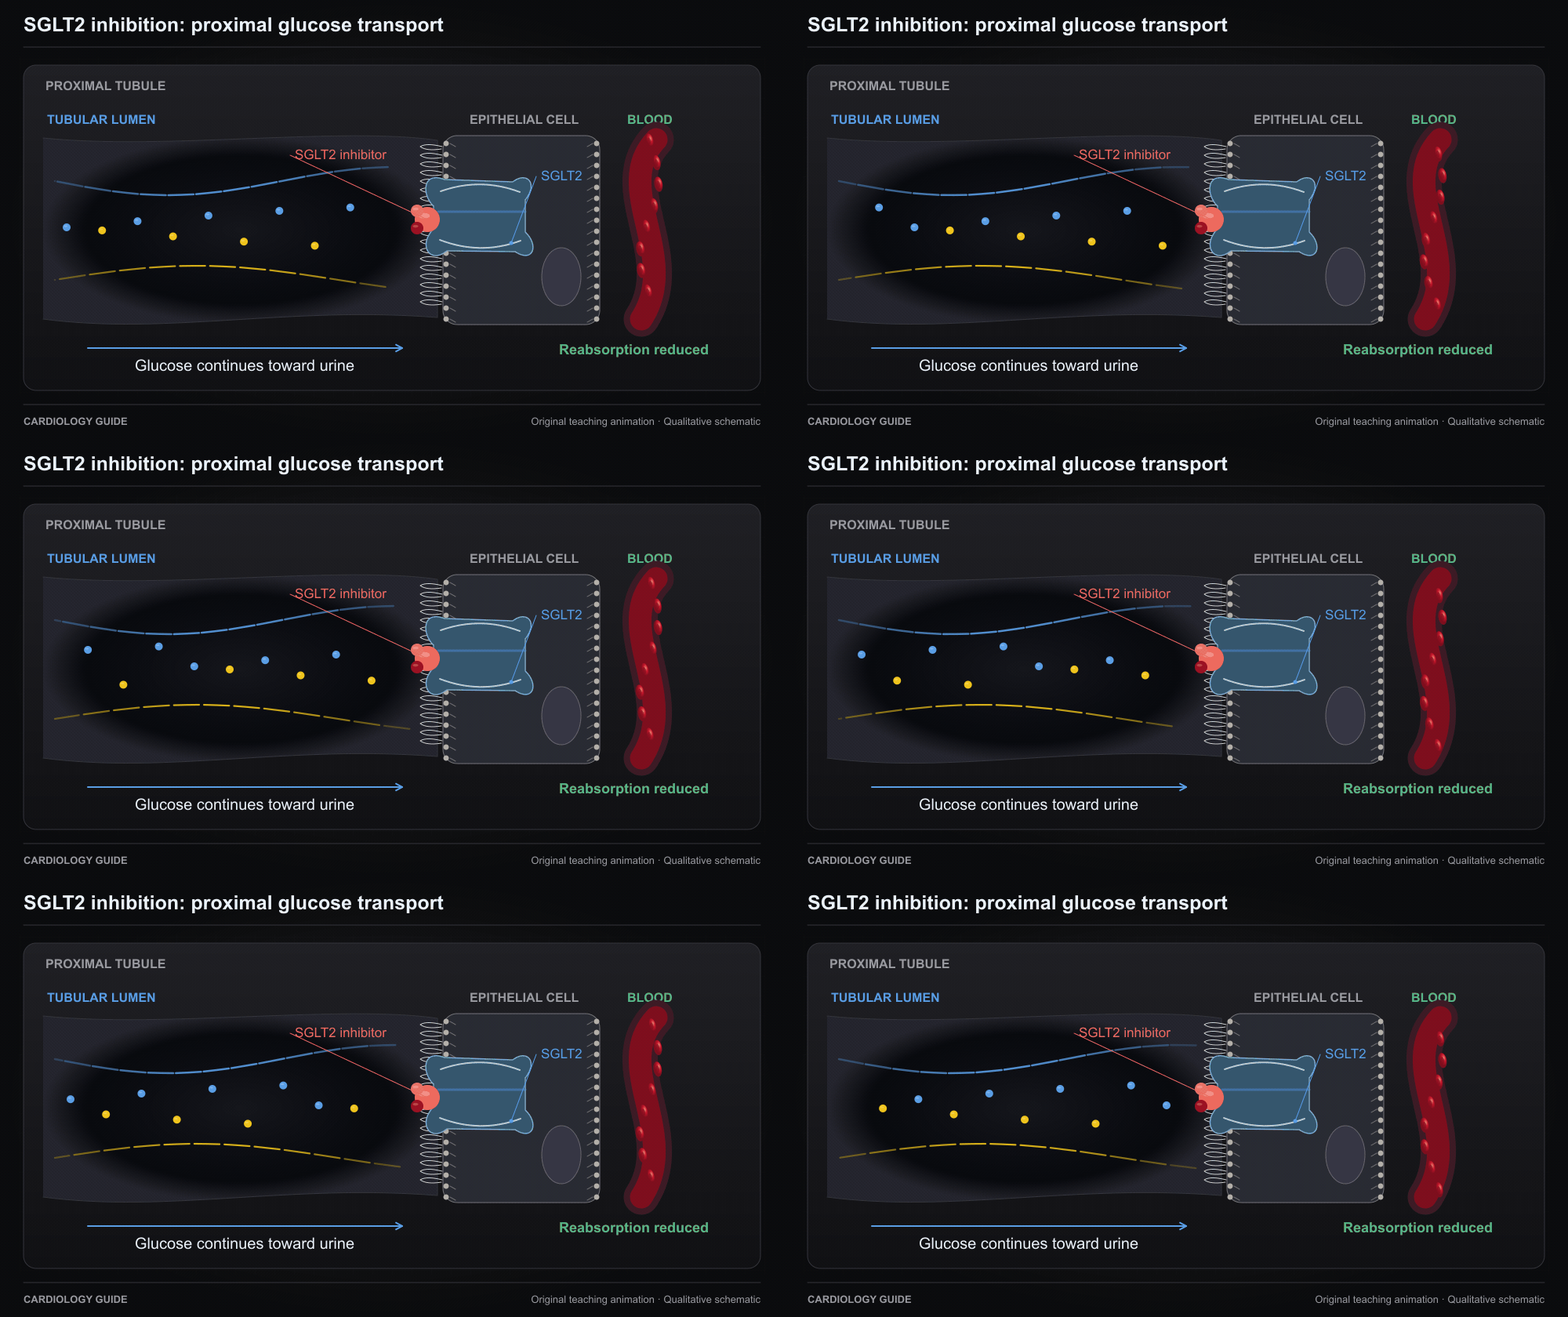
48 original teaching loops for 42 guides. Loops play automatically. Expand a loop for a closer view or slower playback.
Qualitative schematics with simplified anatomy and timing. Sources and interpretation accompany each loop. Download a video, GIF or scalable SVG for teaching.
48 animations
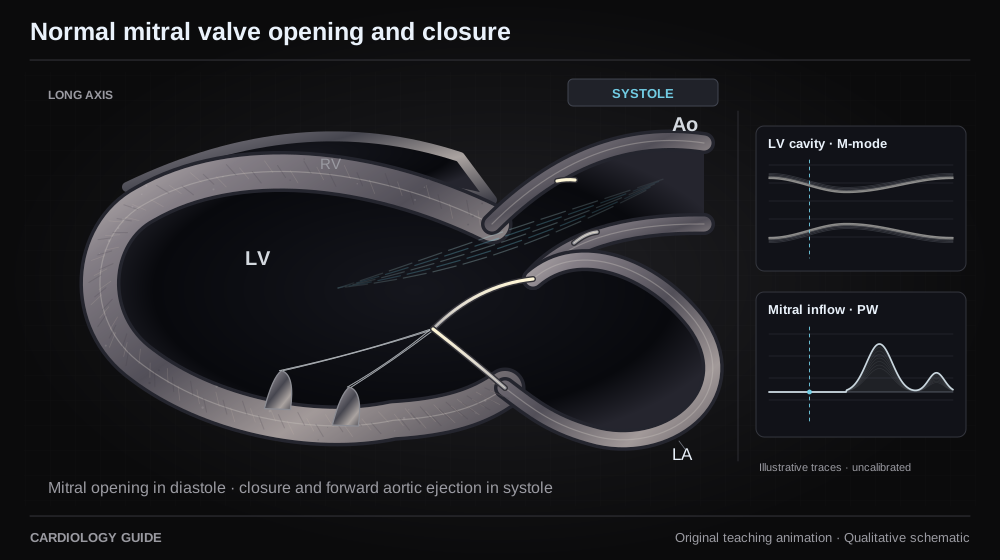
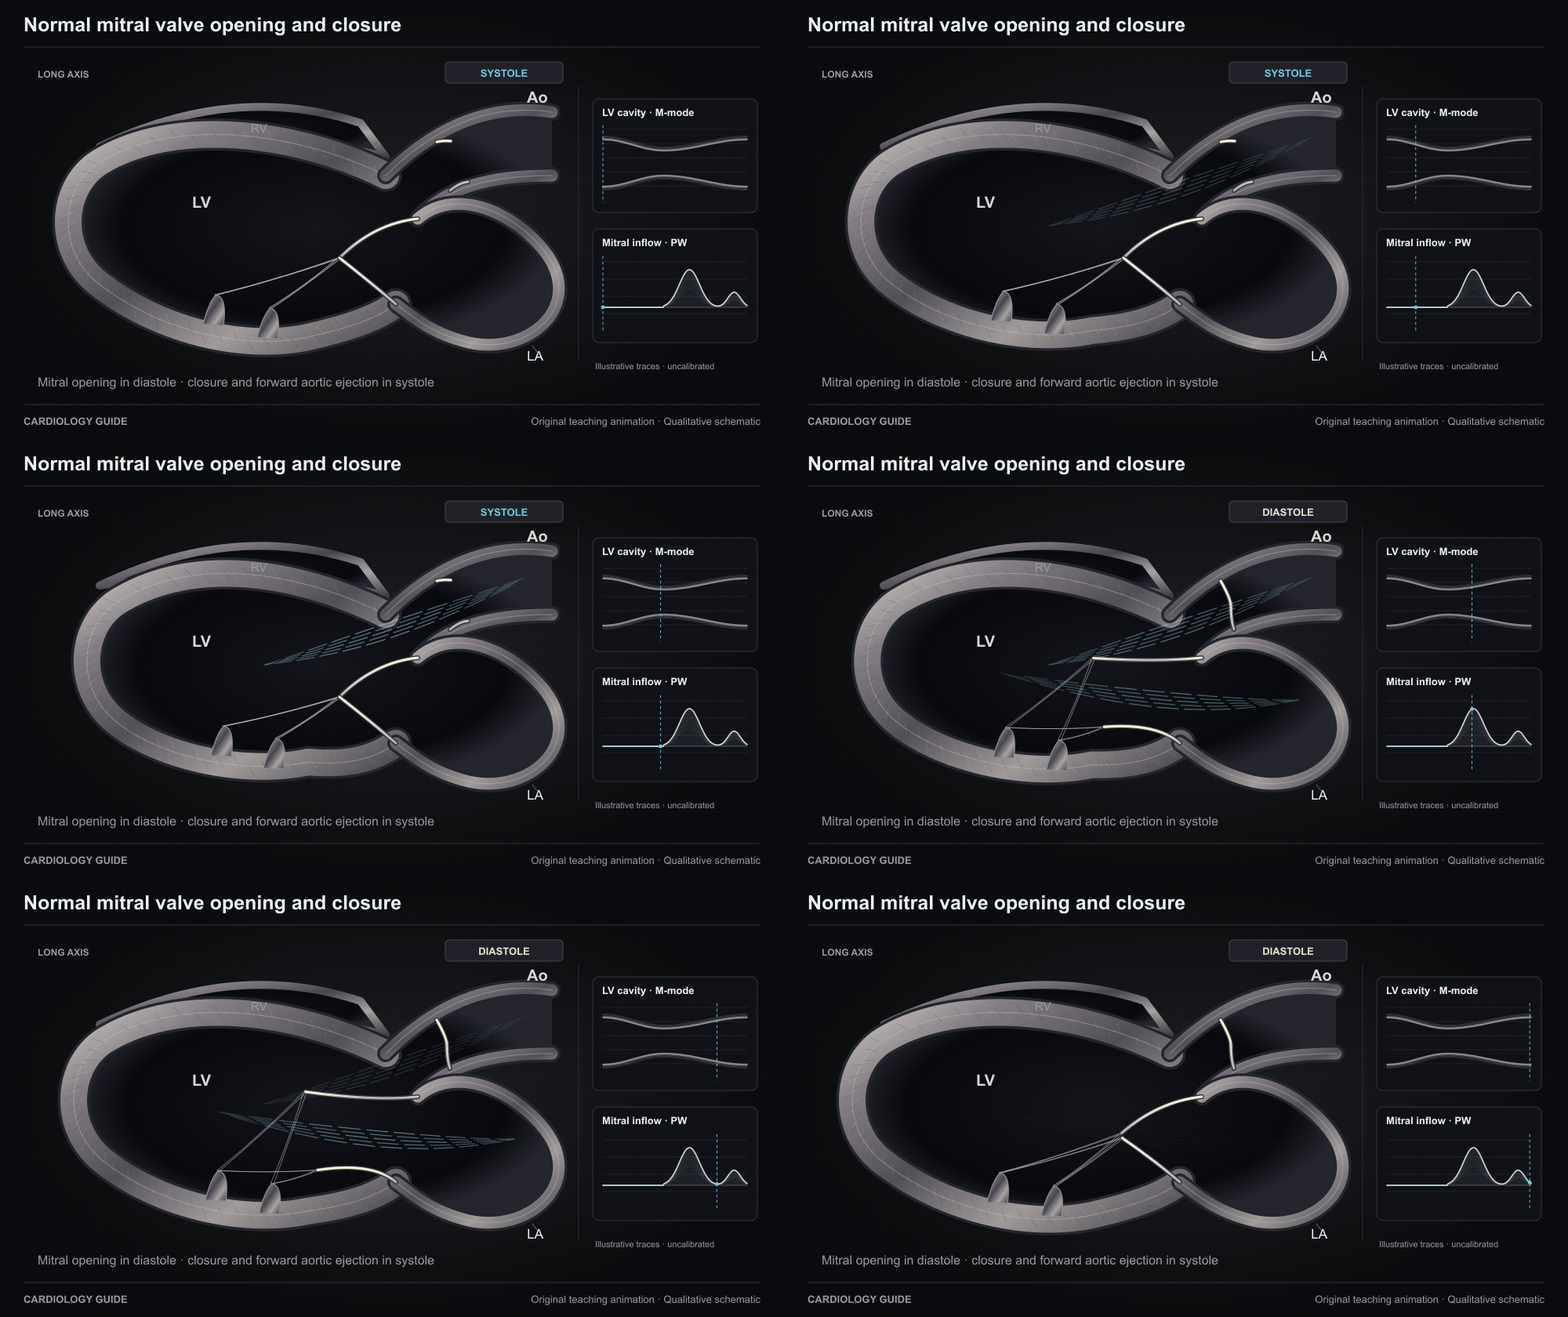
Normal mitral valve opening and closure
The mitral valve opens for LA-to-LV filling in diastole and closes during ventricular systole while blood exits through the aortic valve. Original qualitative long-axis schematic with uncalibrated teaching traces.
Original qualitative teaching schematic. Motion, particles and traces are illustrative. Timing and geometry are simplified.
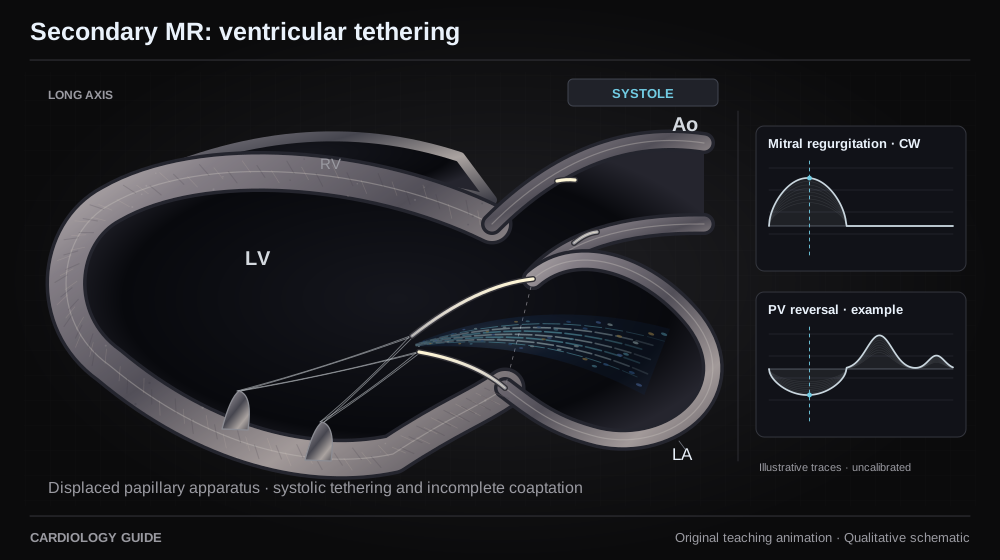
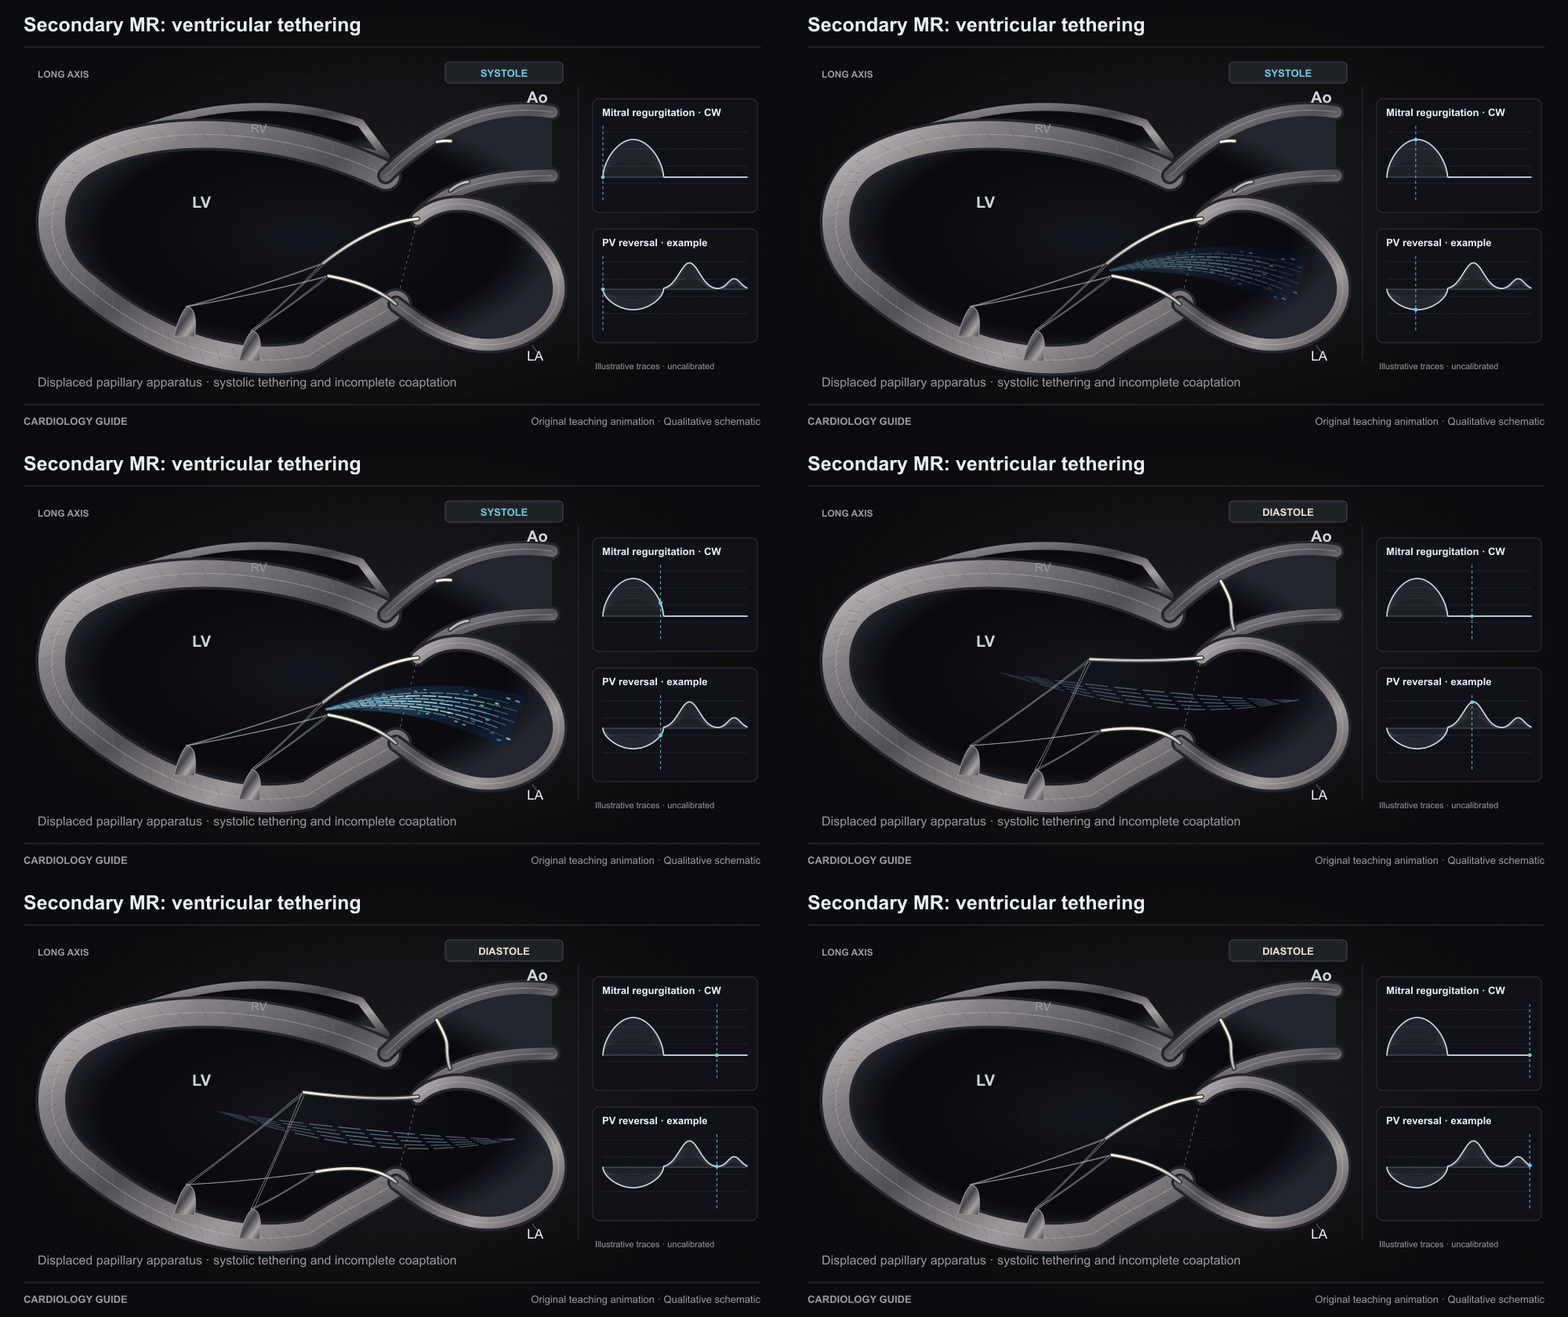
Secondary MR: ventricular tethering
In this ventricular secondary-MR example, LV remodeling displaces the papillary apparatus and restricts systolic leaflet coaptation. The stream travels from LV to LA during systole. Geometry varies across patients. Traces are qualitative and uncalibrated.
Original qualitative teaching schematic. Motion, particles and traces are illustrative. Timing and geometry are simplified.
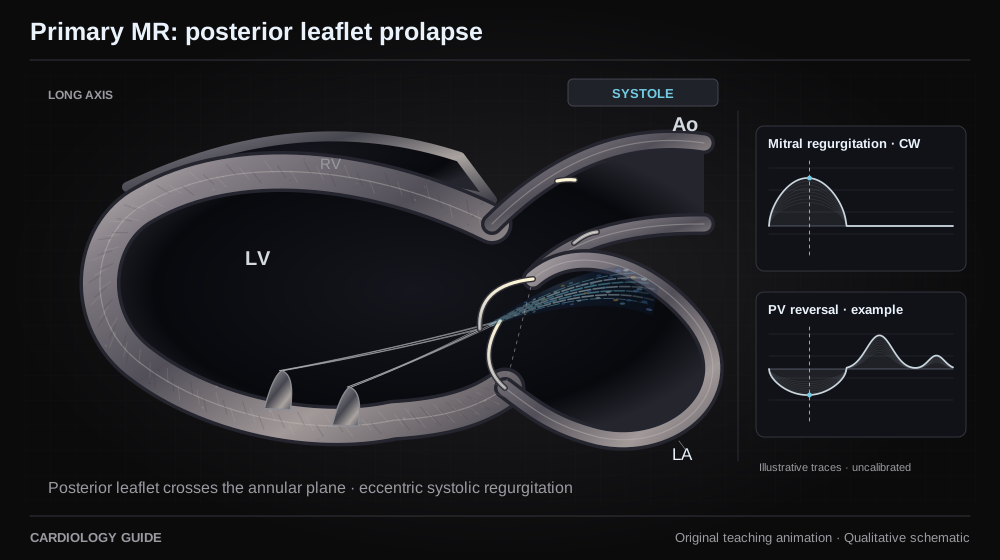
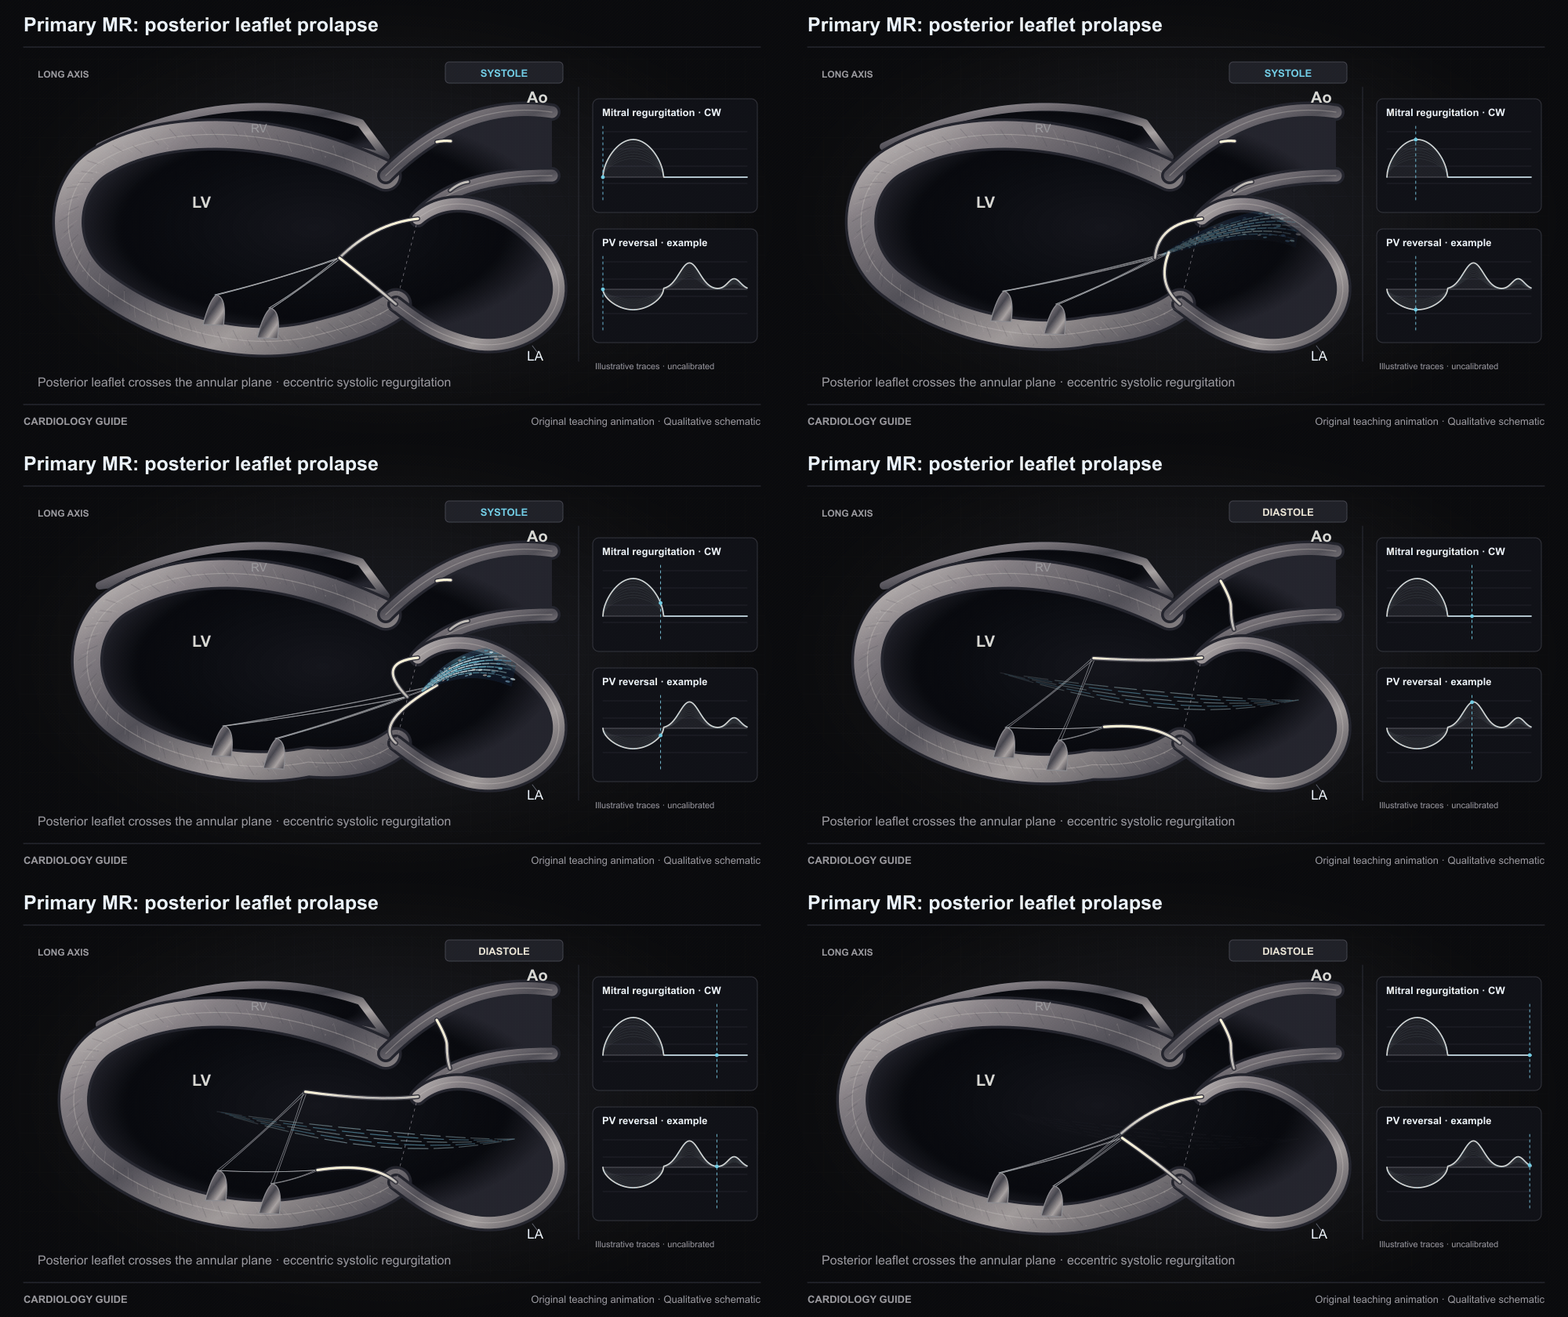
Primary MR: posterior leaflet prolapse
A posterior mitral leaflet prolapses to the atrial side of the annular plane during systole, impairing coaptation and producing an eccentric stream. This shows one primary-MR mechanism, not all degenerative disease. Traces are qualitative and uncalibrated.
Original qualitative teaching schematic. Motion, particles and traces are illustrative. Timing and geometry are simplified.
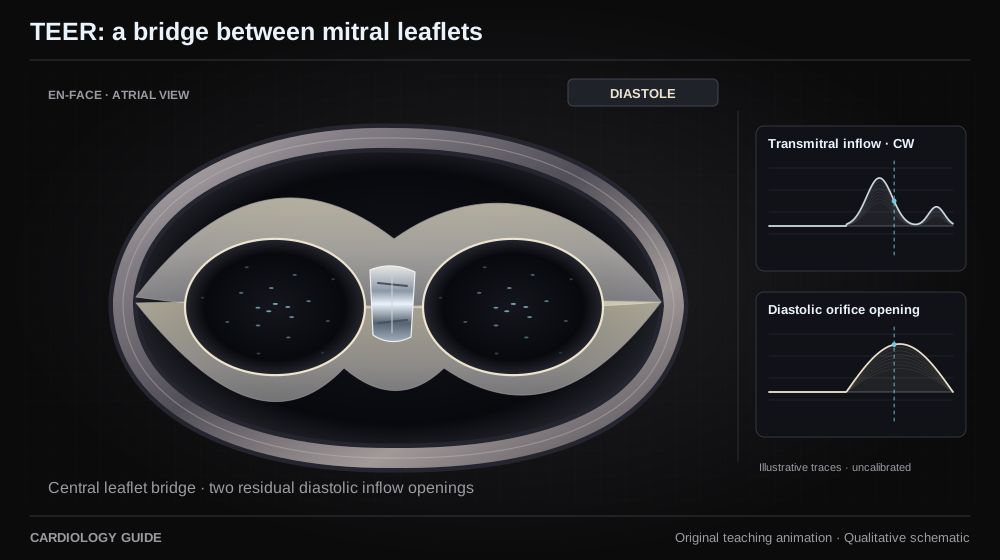
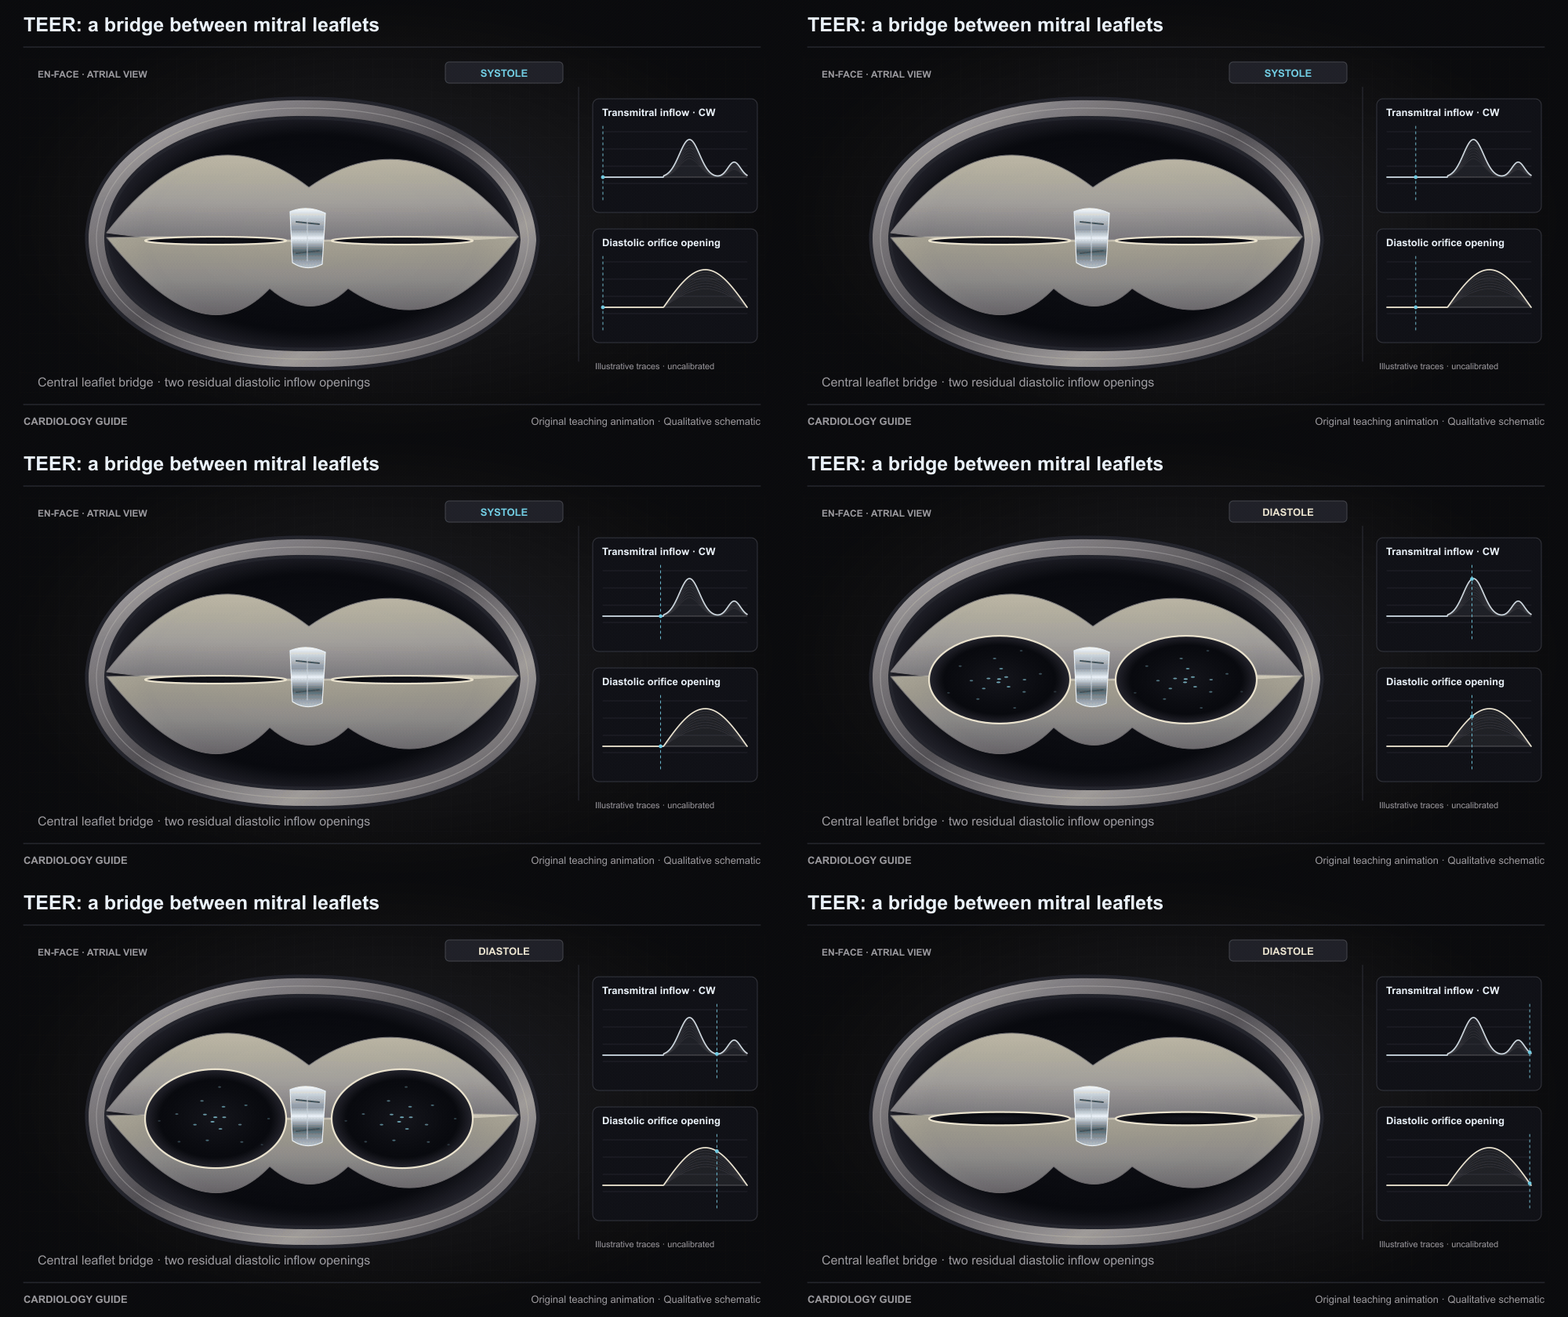
TEER: a bridge between mitral leaflets
An en-face schematic shows central edge-to-edge leaflet approximation creating two residual inflow orifices. They expand during diastole around the leaflet bridge. This depicts geometry, not procedural guidance or guaranteed MR elimination. Flecks represent inflow through the plane.
Original qualitative teaching schematic. Motion, particles and traces are illustrative. Timing and geometry are simplified.
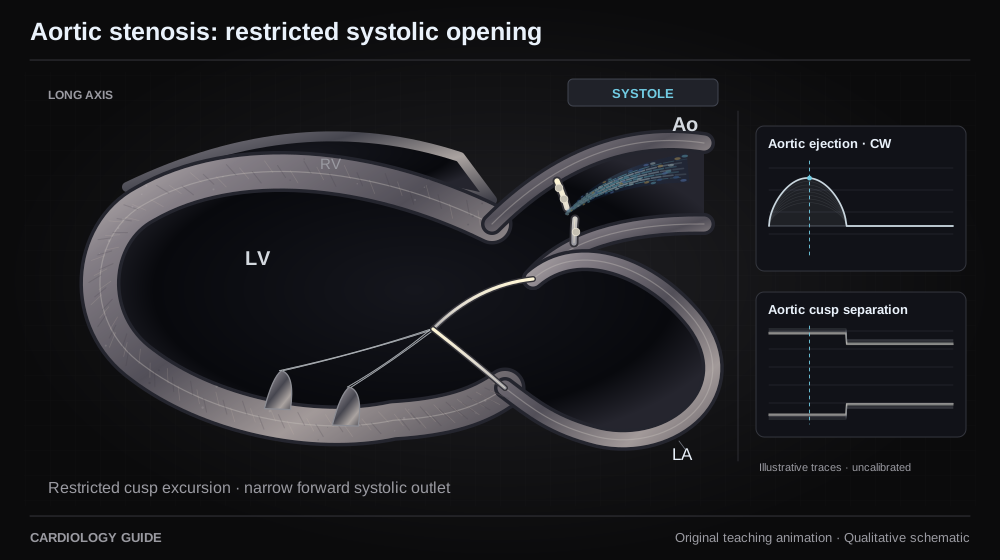
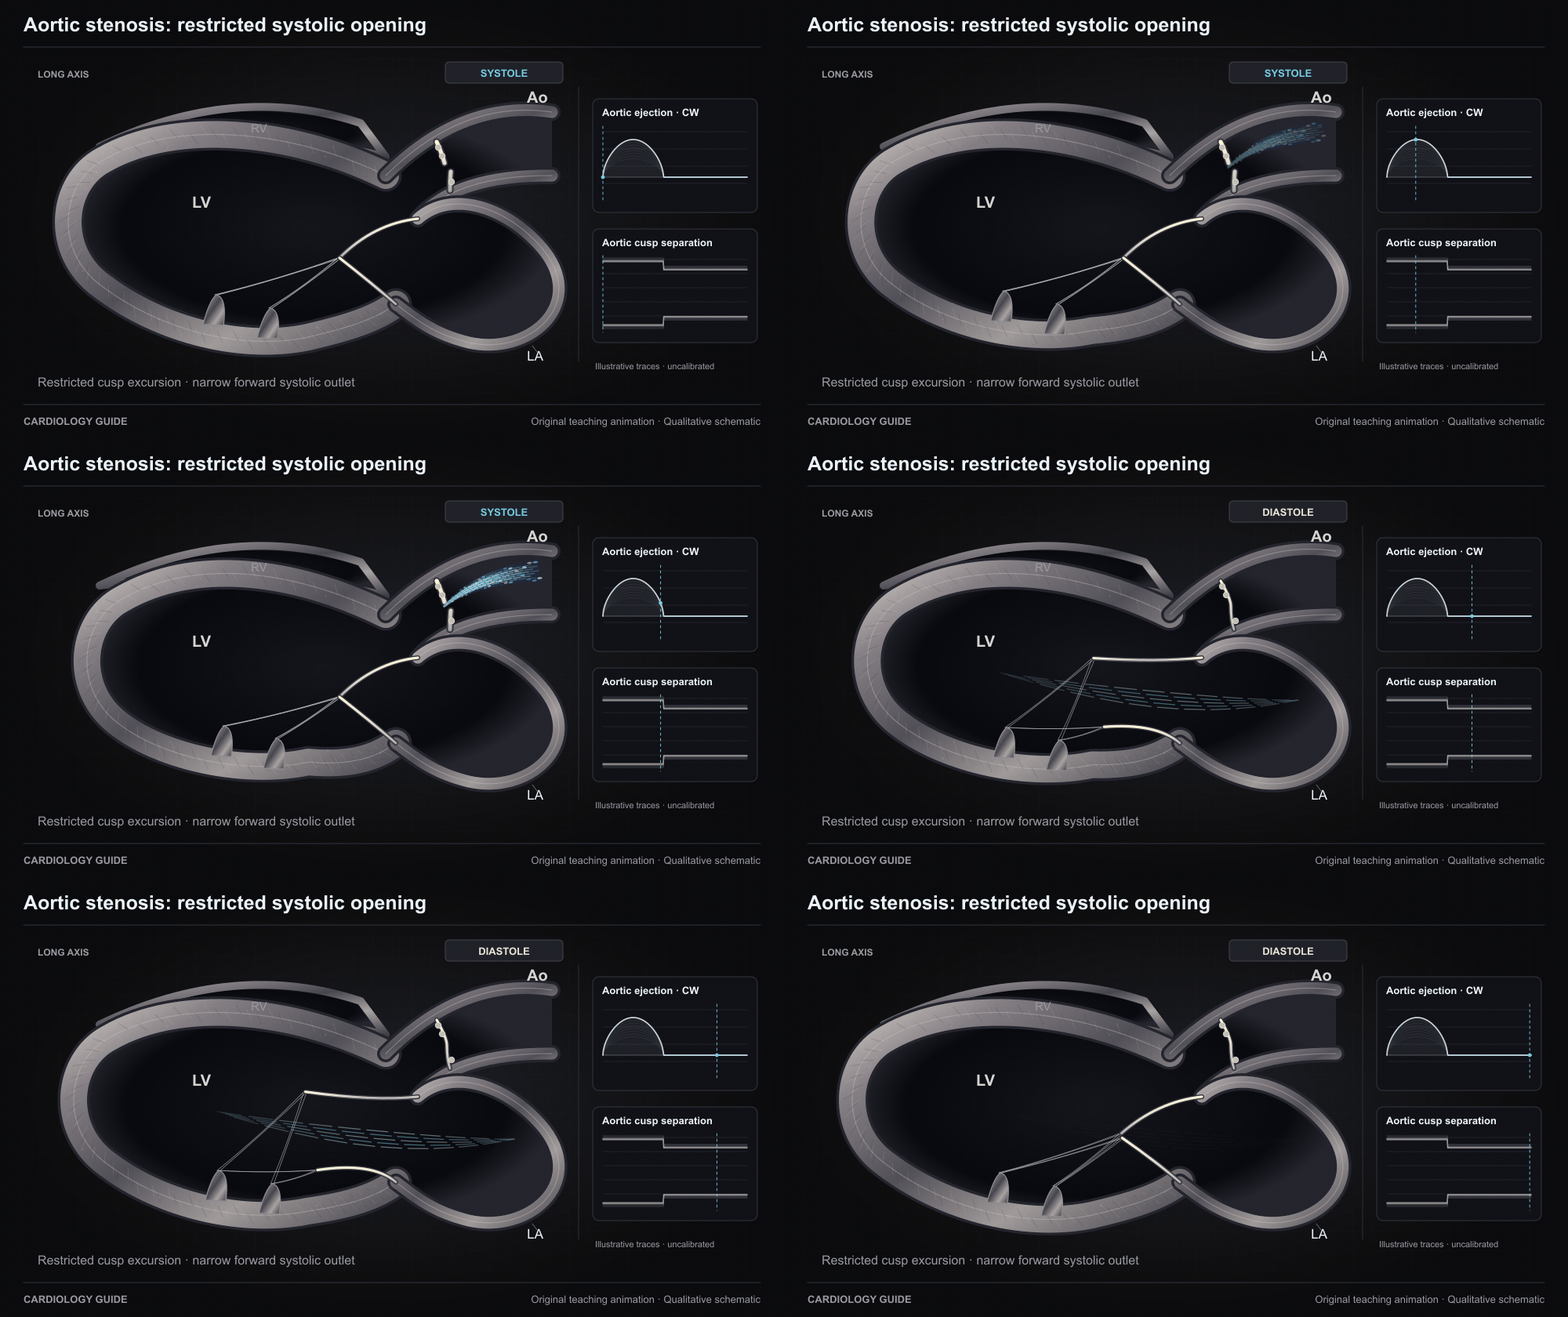
Aortic stenosis: restricted systolic opening
Restricted cusp opening concentrates forward flow through a narrowed aortic outlet in systole. The jet and teaching CW envelope illustrate timing without a calibrated velocity or severity scale.
Original qualitative teaching schematic. Motion, particles and traces are illustrative. Timing and geometry are simplified.
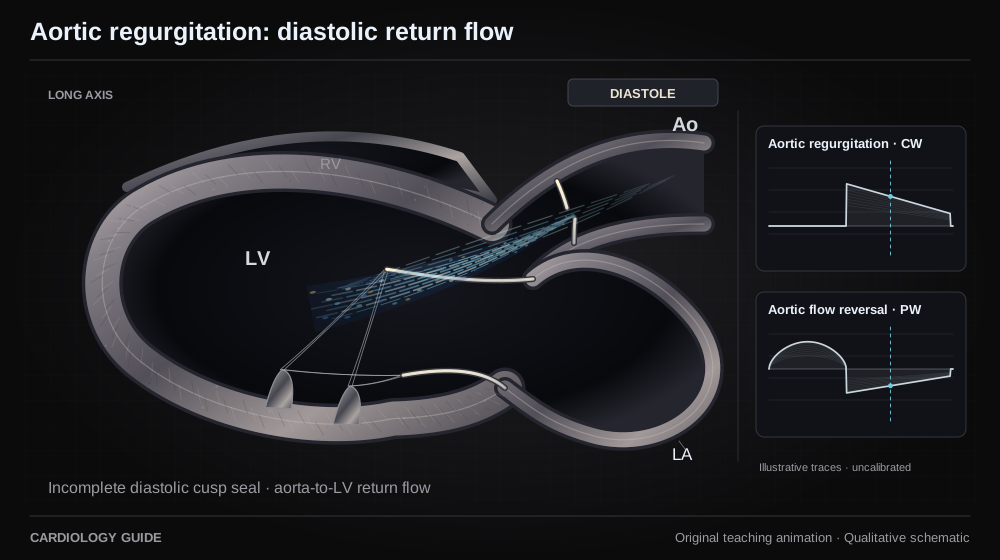
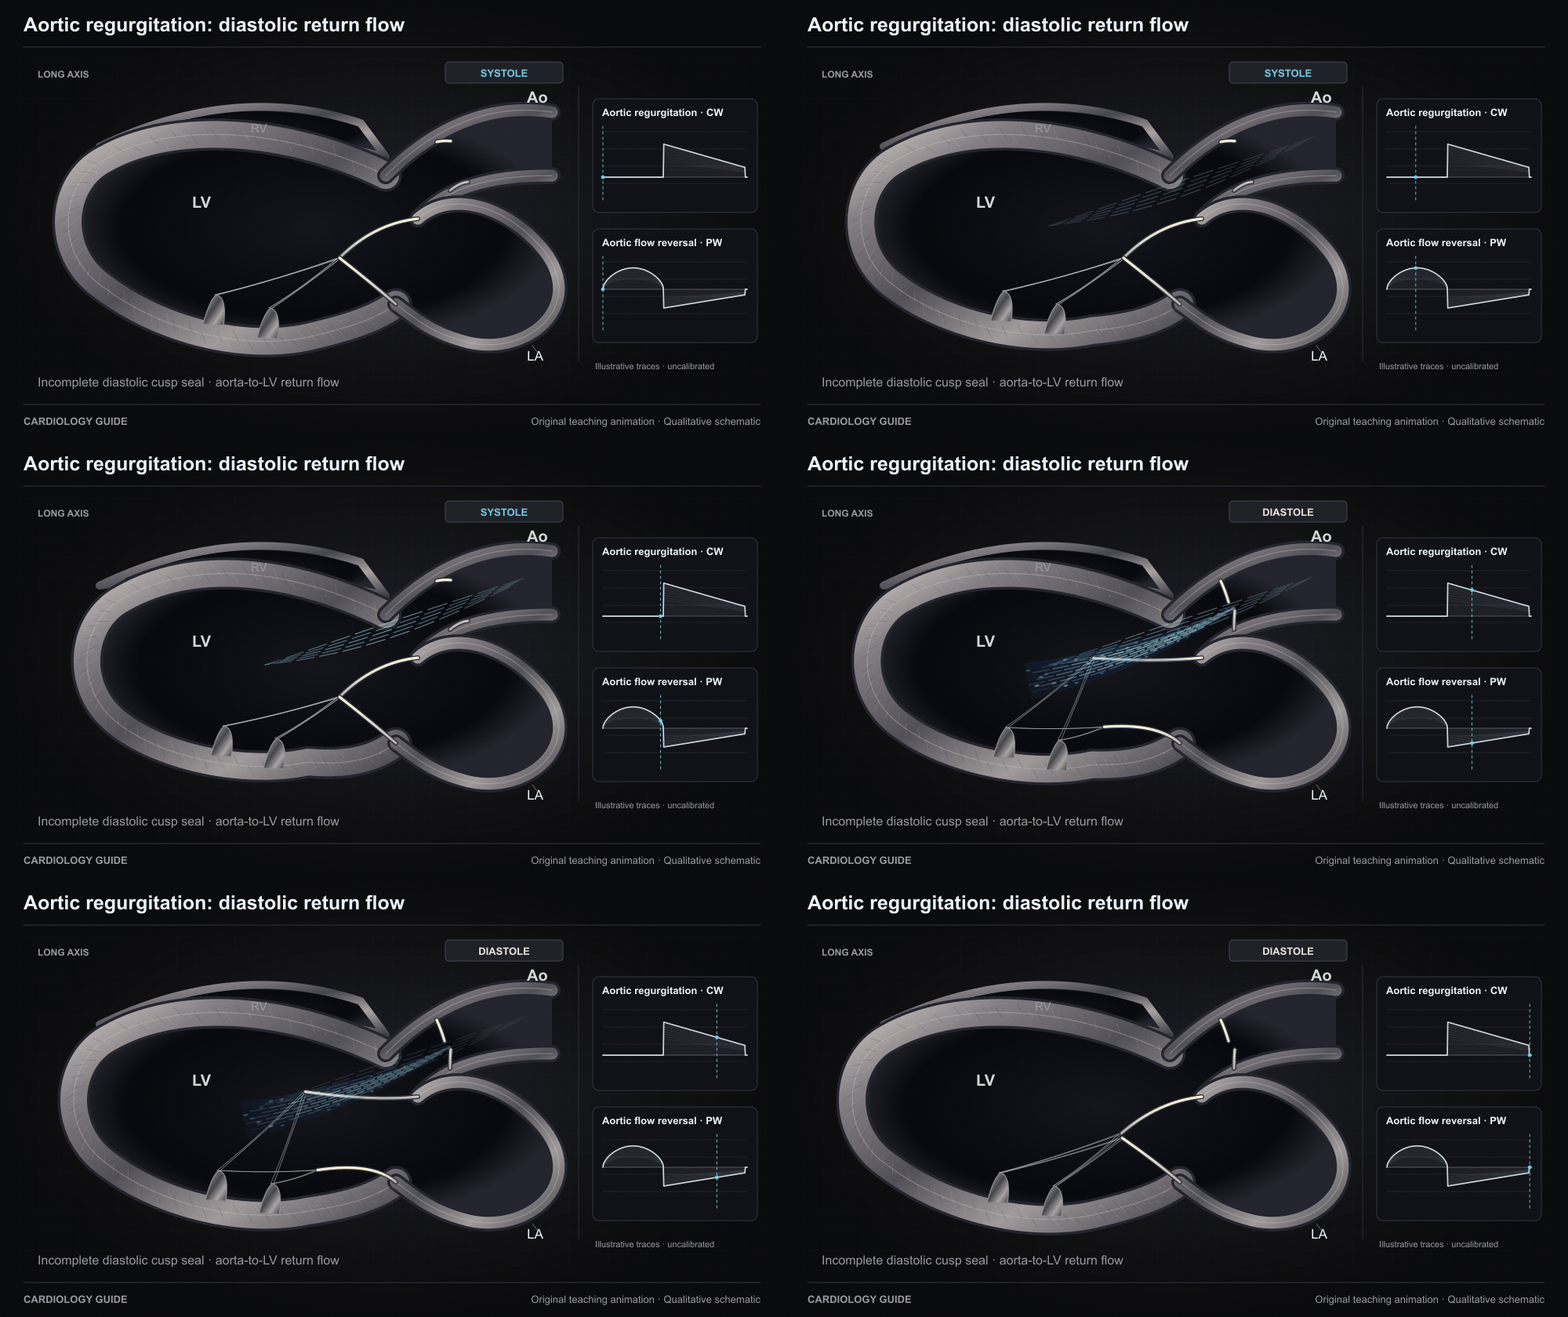
Aortic regurgitation: diastolic return flow
Incomplete aortic closure allows aorta-to-LV return flow during diastole. The reverse diastolic stream and normal forward systolic stream are phase-gated. Teaching traces are qualitative and cannot grade AR.
Original qualitative teaching schematic. Motion, particles and traces are illustrative. Timing and geometry are simplified.
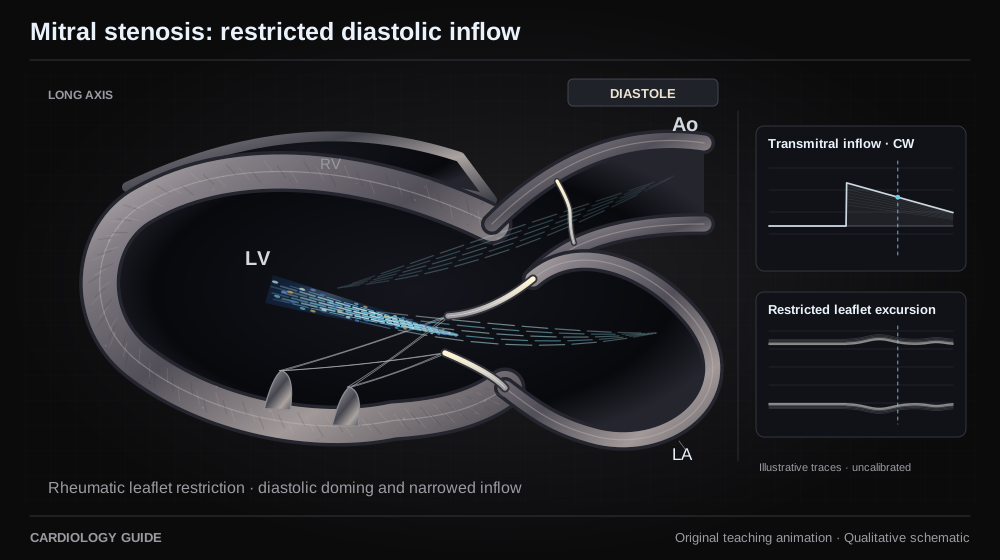
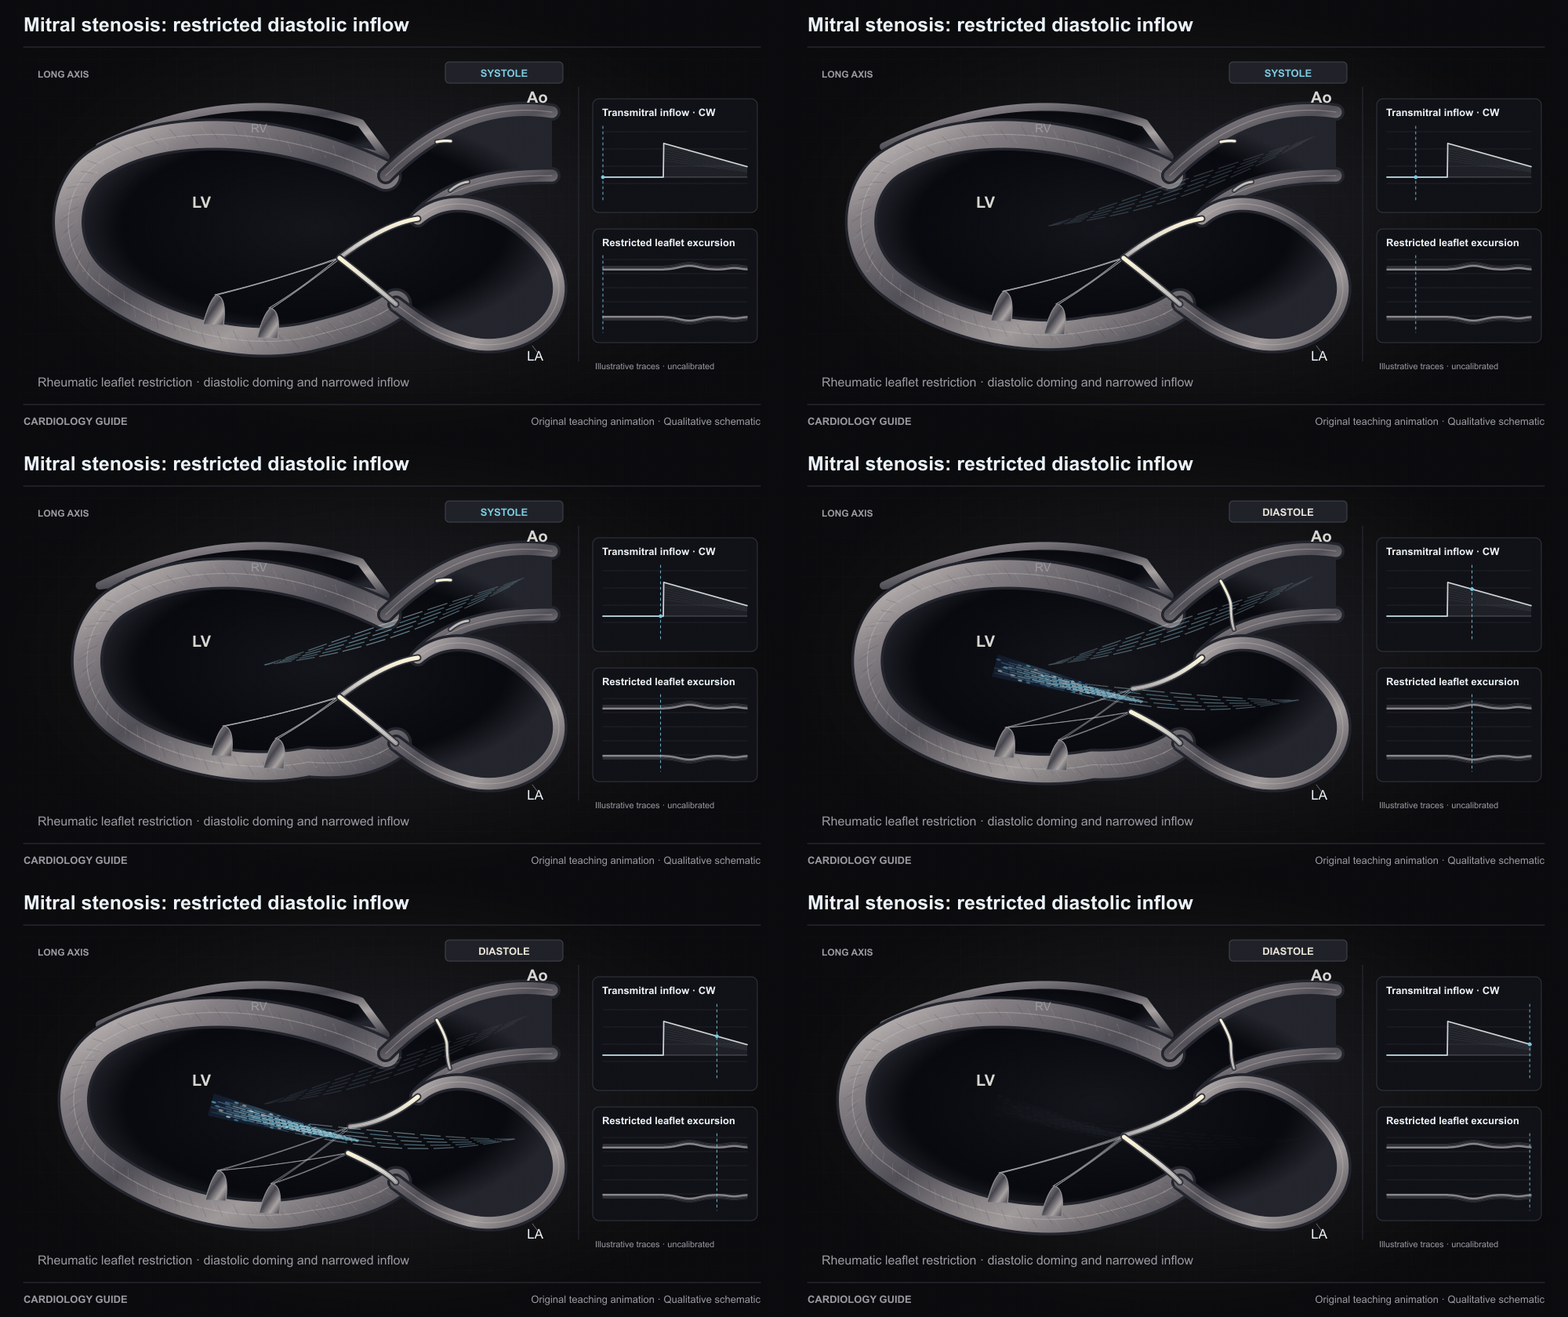
Mitral stenosis: restricted diastolic inflow
This rheumatic-MS example shows thickened, restricted leaflets doming in diastole with a narrowed residual inflow opening. Flow travels LA to LV. MAC-related stenosis has different anatomy. Teaching traces are uncalibrated.
Original qualitative teaching schematic. Motion, particles and traces are illustrative. Timing and geometry are simplified.
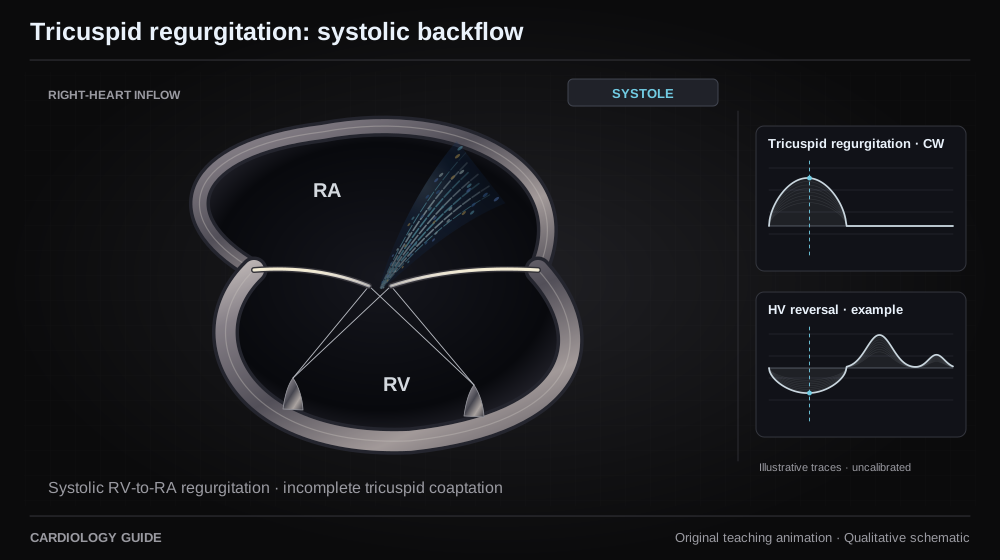
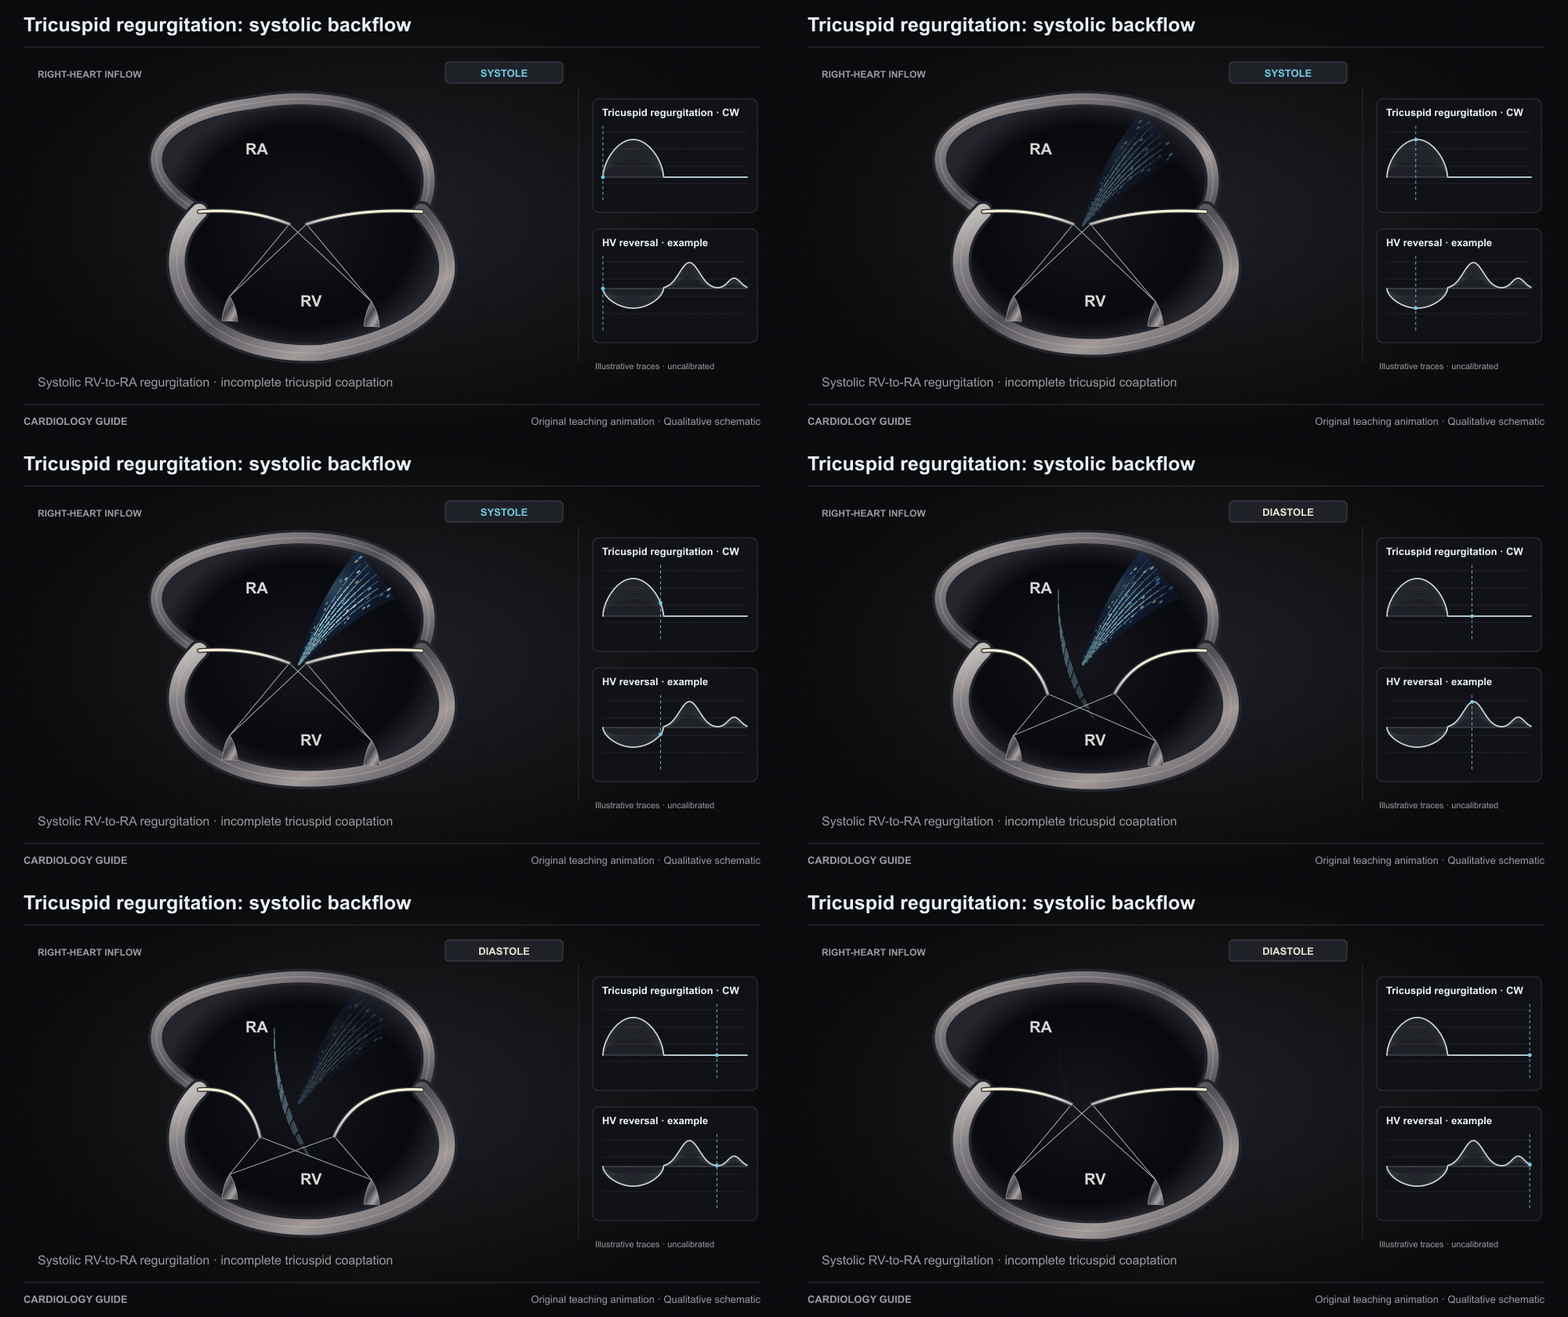
Tricuspid regurgitation: systolic backflow
Incomplete tricuspid coaptation allows RV-to-RA backflow in systole. The valve opens for RA-to-RV filling in diastole. This right-heart teaching plane and its traces do not quantify TR.
Original qualitative teaching schematic. Motion, particles and traces are illustrative. Timing and geometry are simplified.
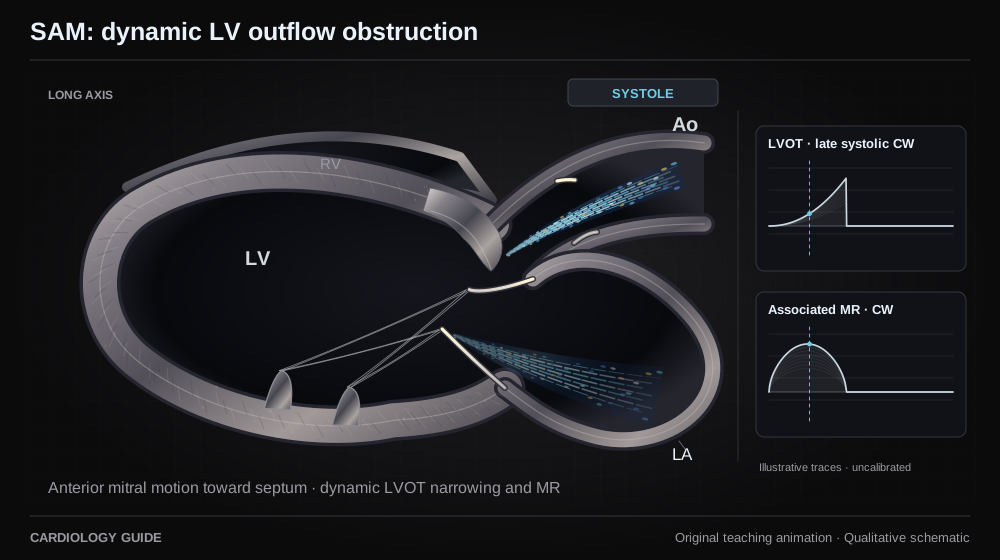
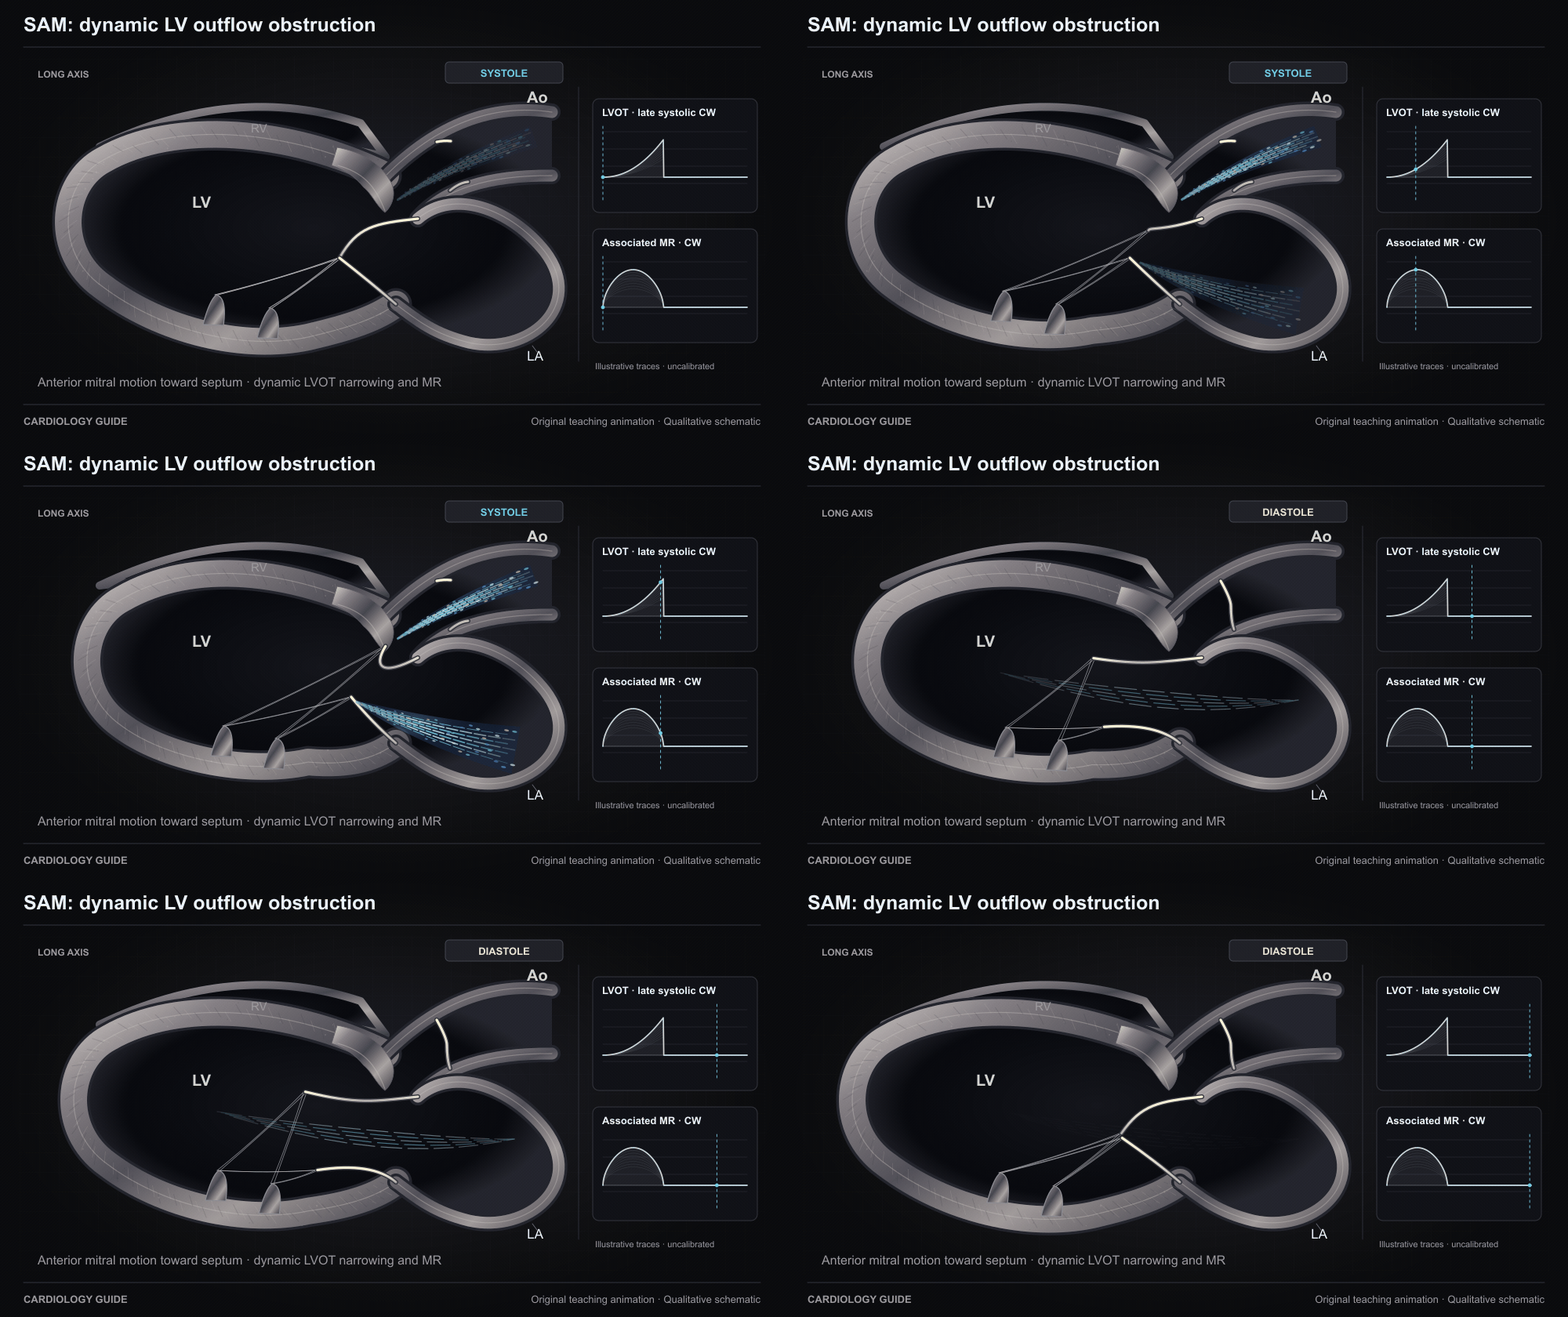
SAM: dynamic LV outflow obstruction
In this obstructive-HCM example, SAM brings the anterior mitral leaflet toward the basal septum, narrowing LV outflow and impairing coaptation. Not every HCM phenotype has SAM or obstruction. The late systolic envelope is uncalibrated.
Original qualitative teaching schematic. Motion, particles and traces are illustrative. Timing and geometry are simplified.
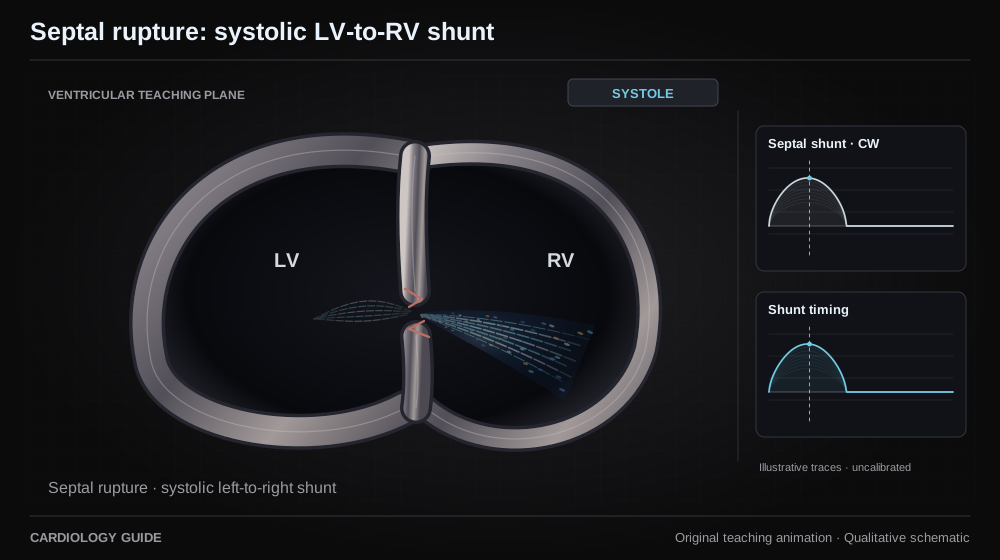
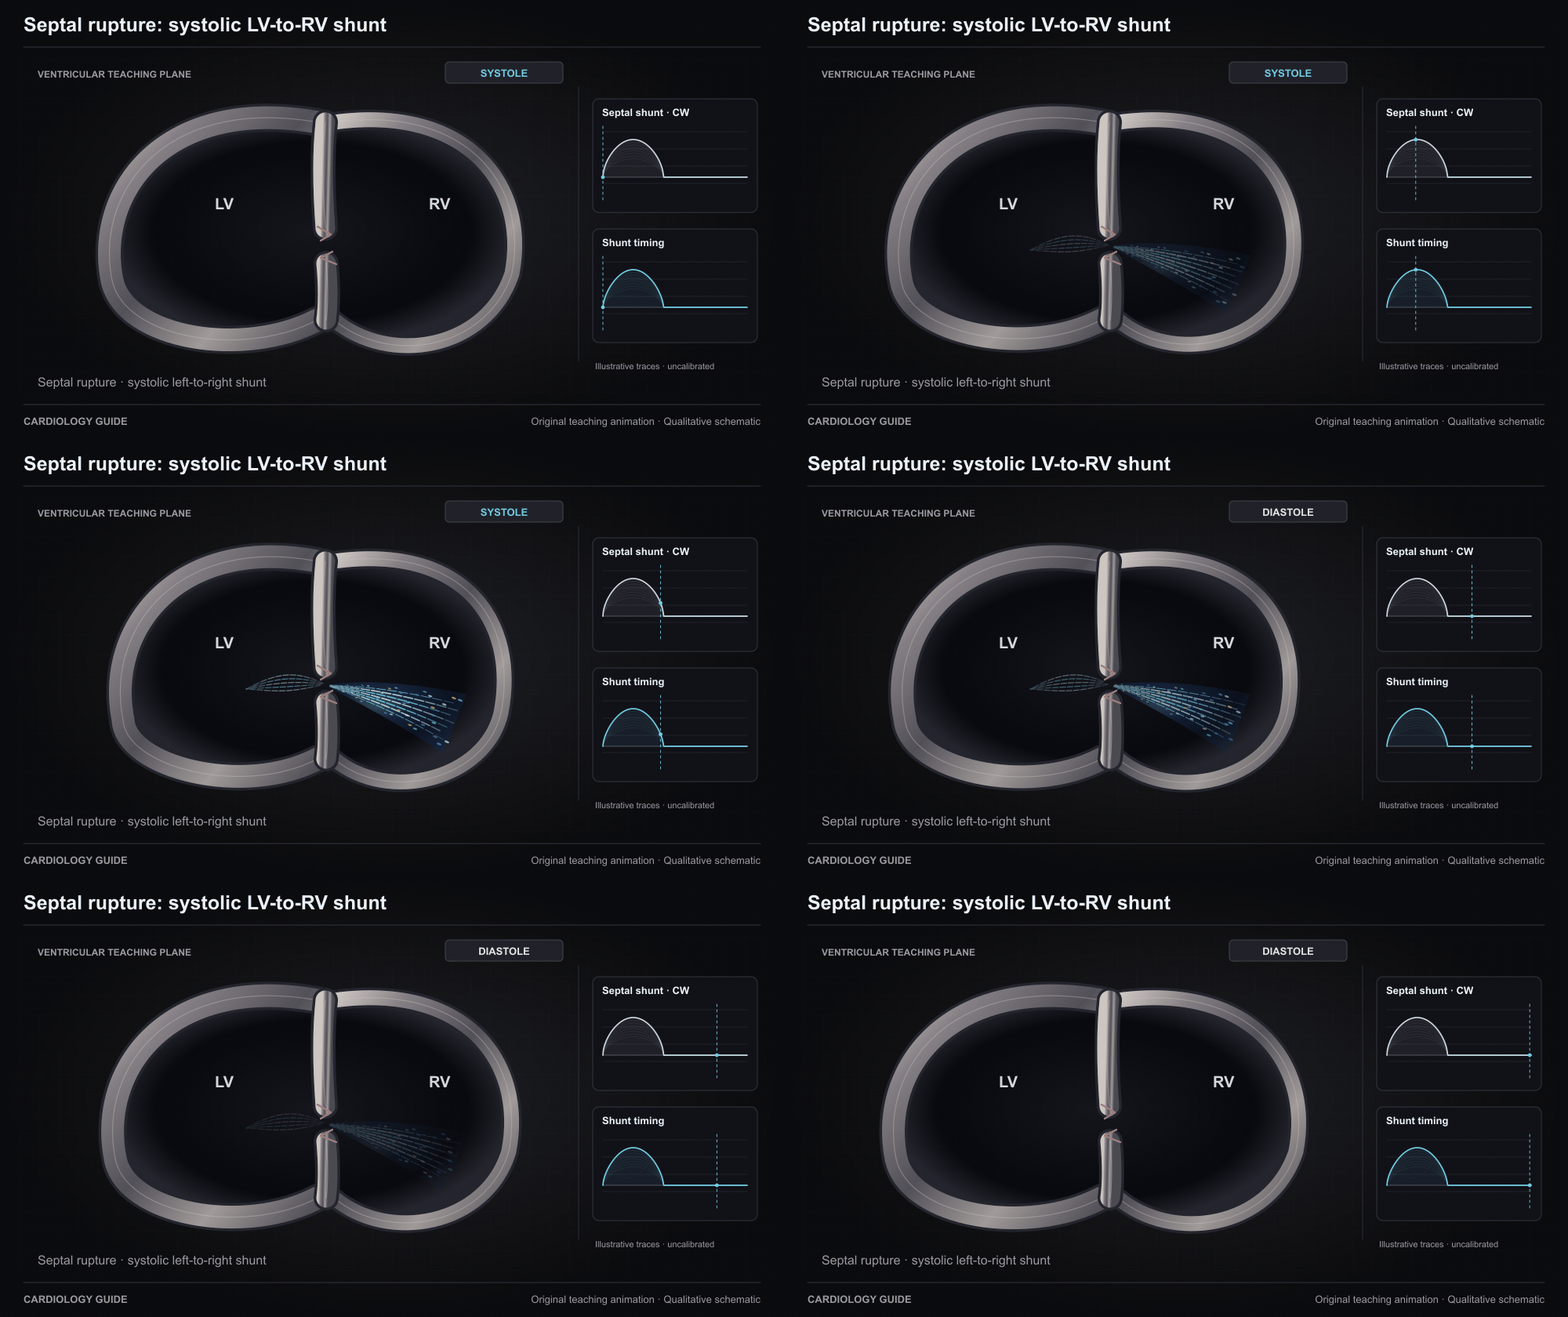
Septal rupture: systolic LV-to-RV shunt
A post-infarction ventricular septal defect permits a left-to-right shunt in systole. The LV-to-RV stream is phase-gated. Anatomy and consequences vary by defect location and loading. Teaching traces have no velocity scale.
Original qualitative teaching schematic. Motion, particles and traces are illustrative. Timing and geometry are simplified.
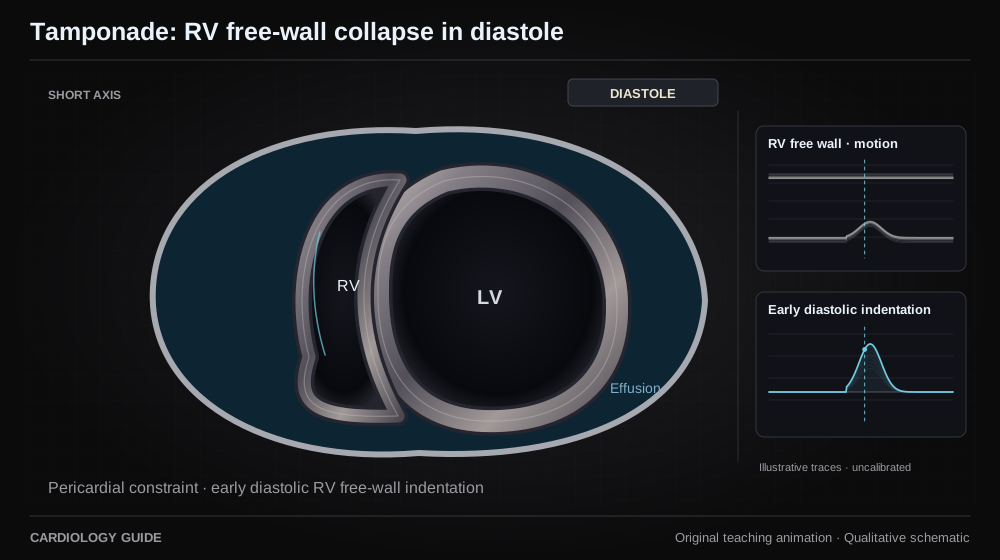
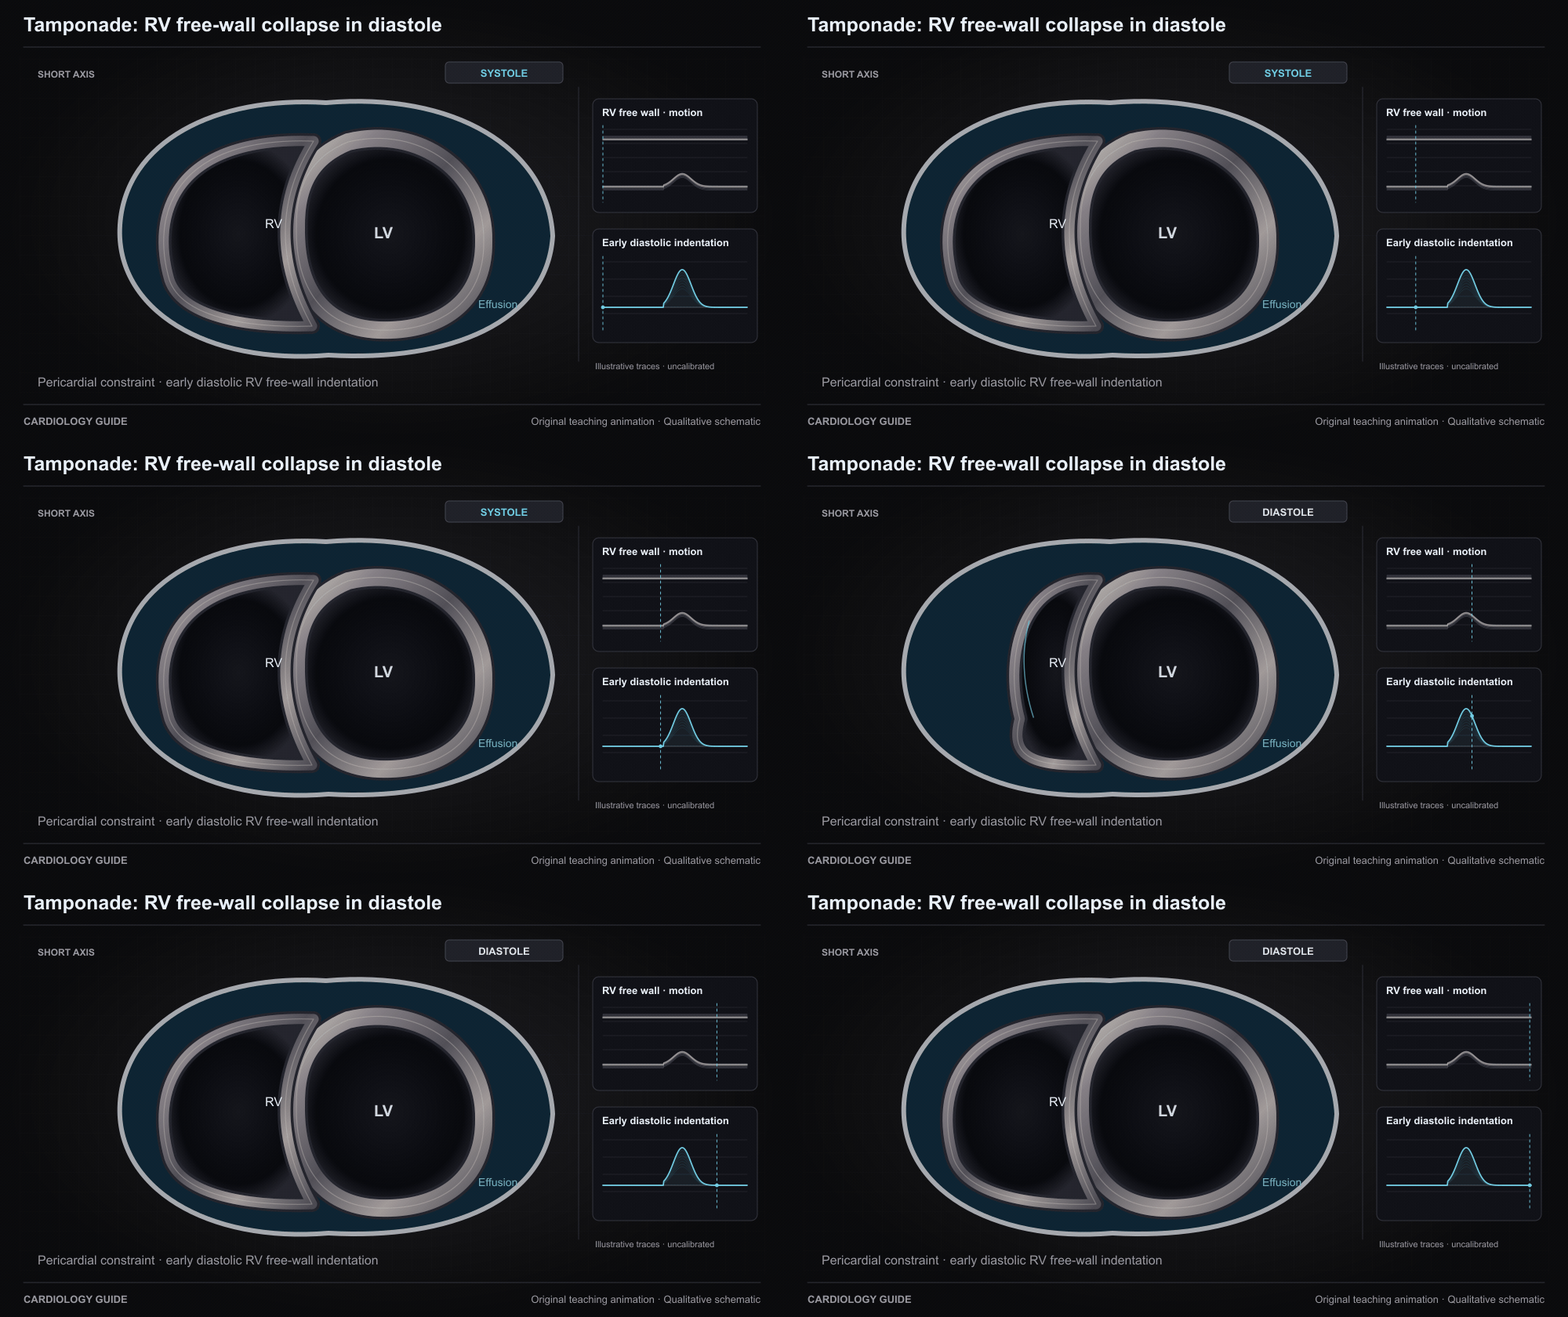
Tamponade: RV free-wall collapse in diastole
Pericardial pressure can transiently exceed RV pressure in early diastole and indent its free wall. Collapse timing is one element of integrated tamponade assessment. Elevated right-sided pressure can prevent collapse. The motion trace is qualitative.
Original qualitative teaching schematic. Motion, particles and traces are illustrative. Timing and geometry are simplified.
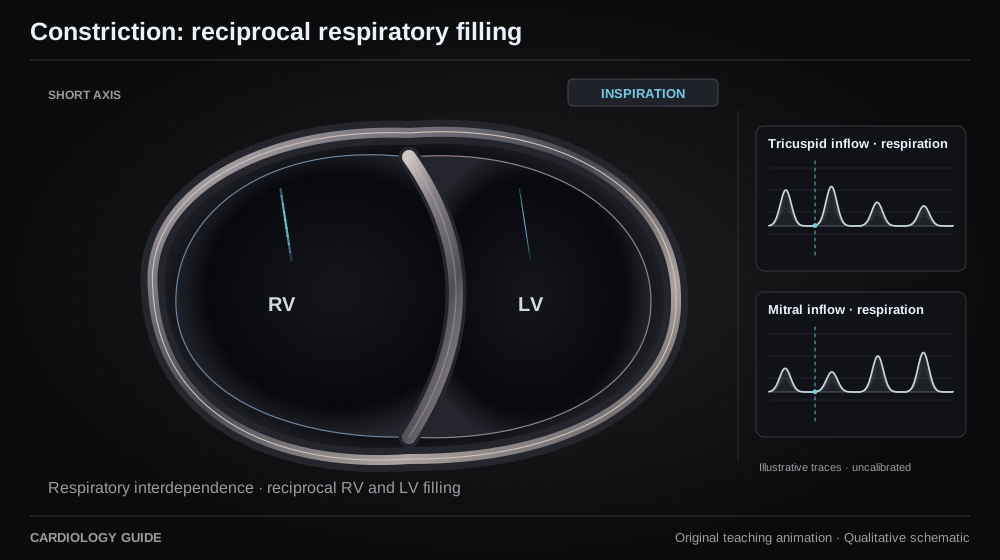
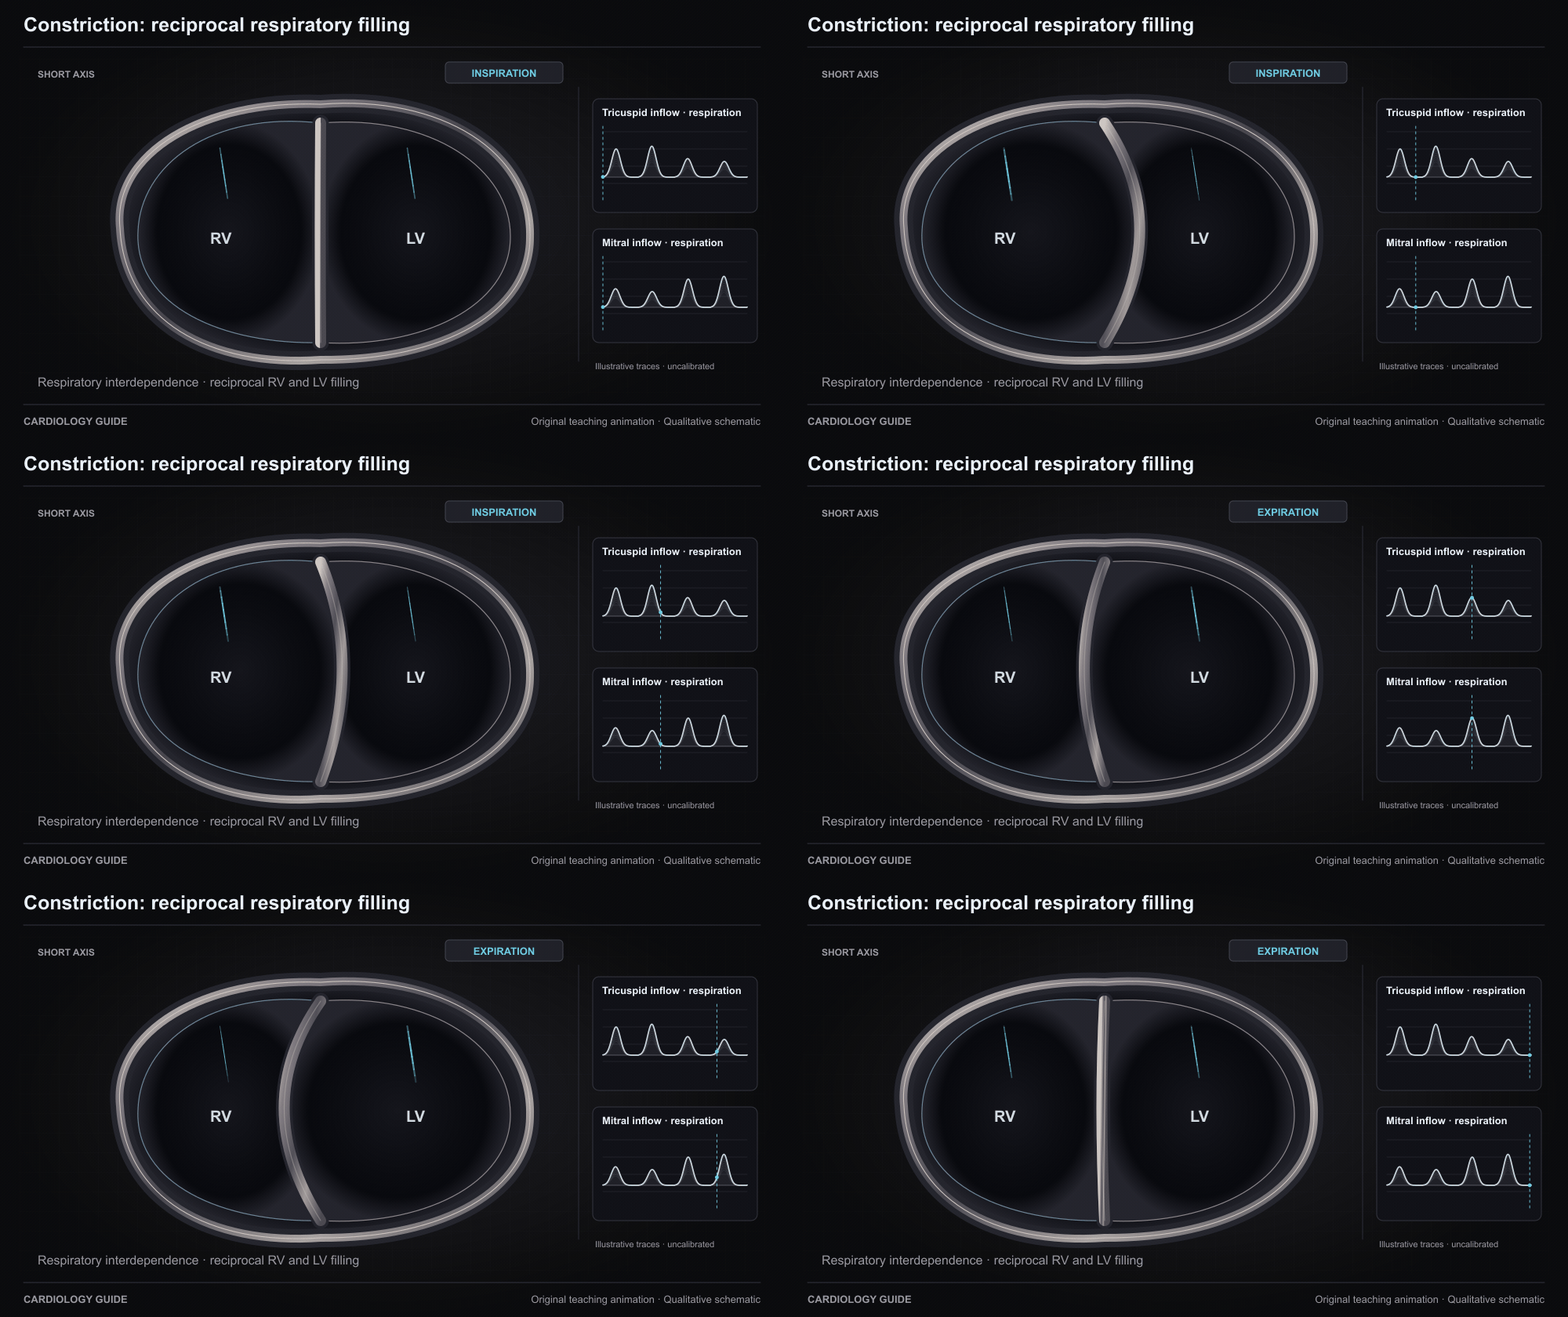
Constriction: reciprocal respiratory filling
Pericardial constraint exaggerates ventricular interdependence. Inspiration increases RV filling while LV filling decreases and the septum shifts toward the LV. Expiration reverses the balance. This is a respiratory loop. Paired inflow envelopes are qualitative, not measured Doppler data.
Original qualitative teaching schematic. Motion, particles and traces are illustrative. Timing and geometry are simplified.
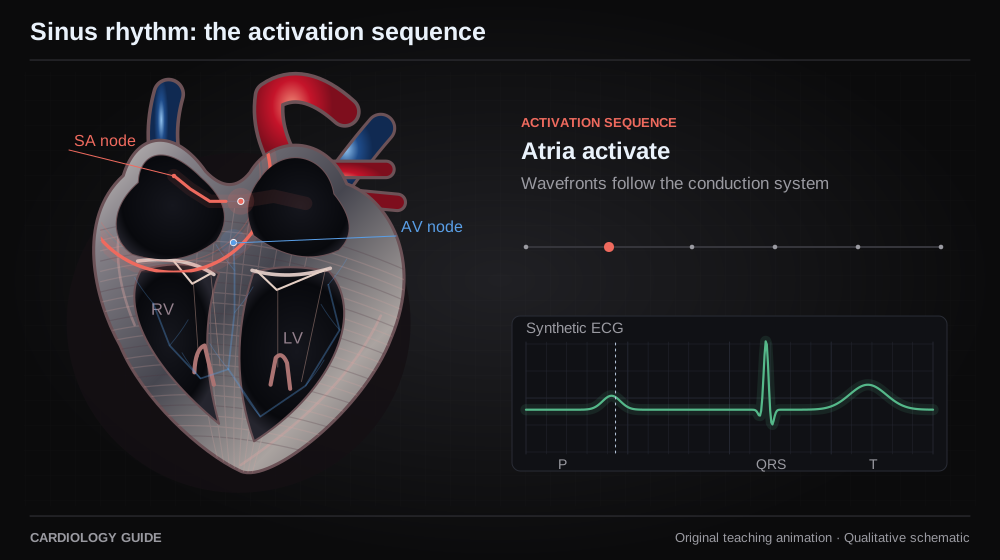
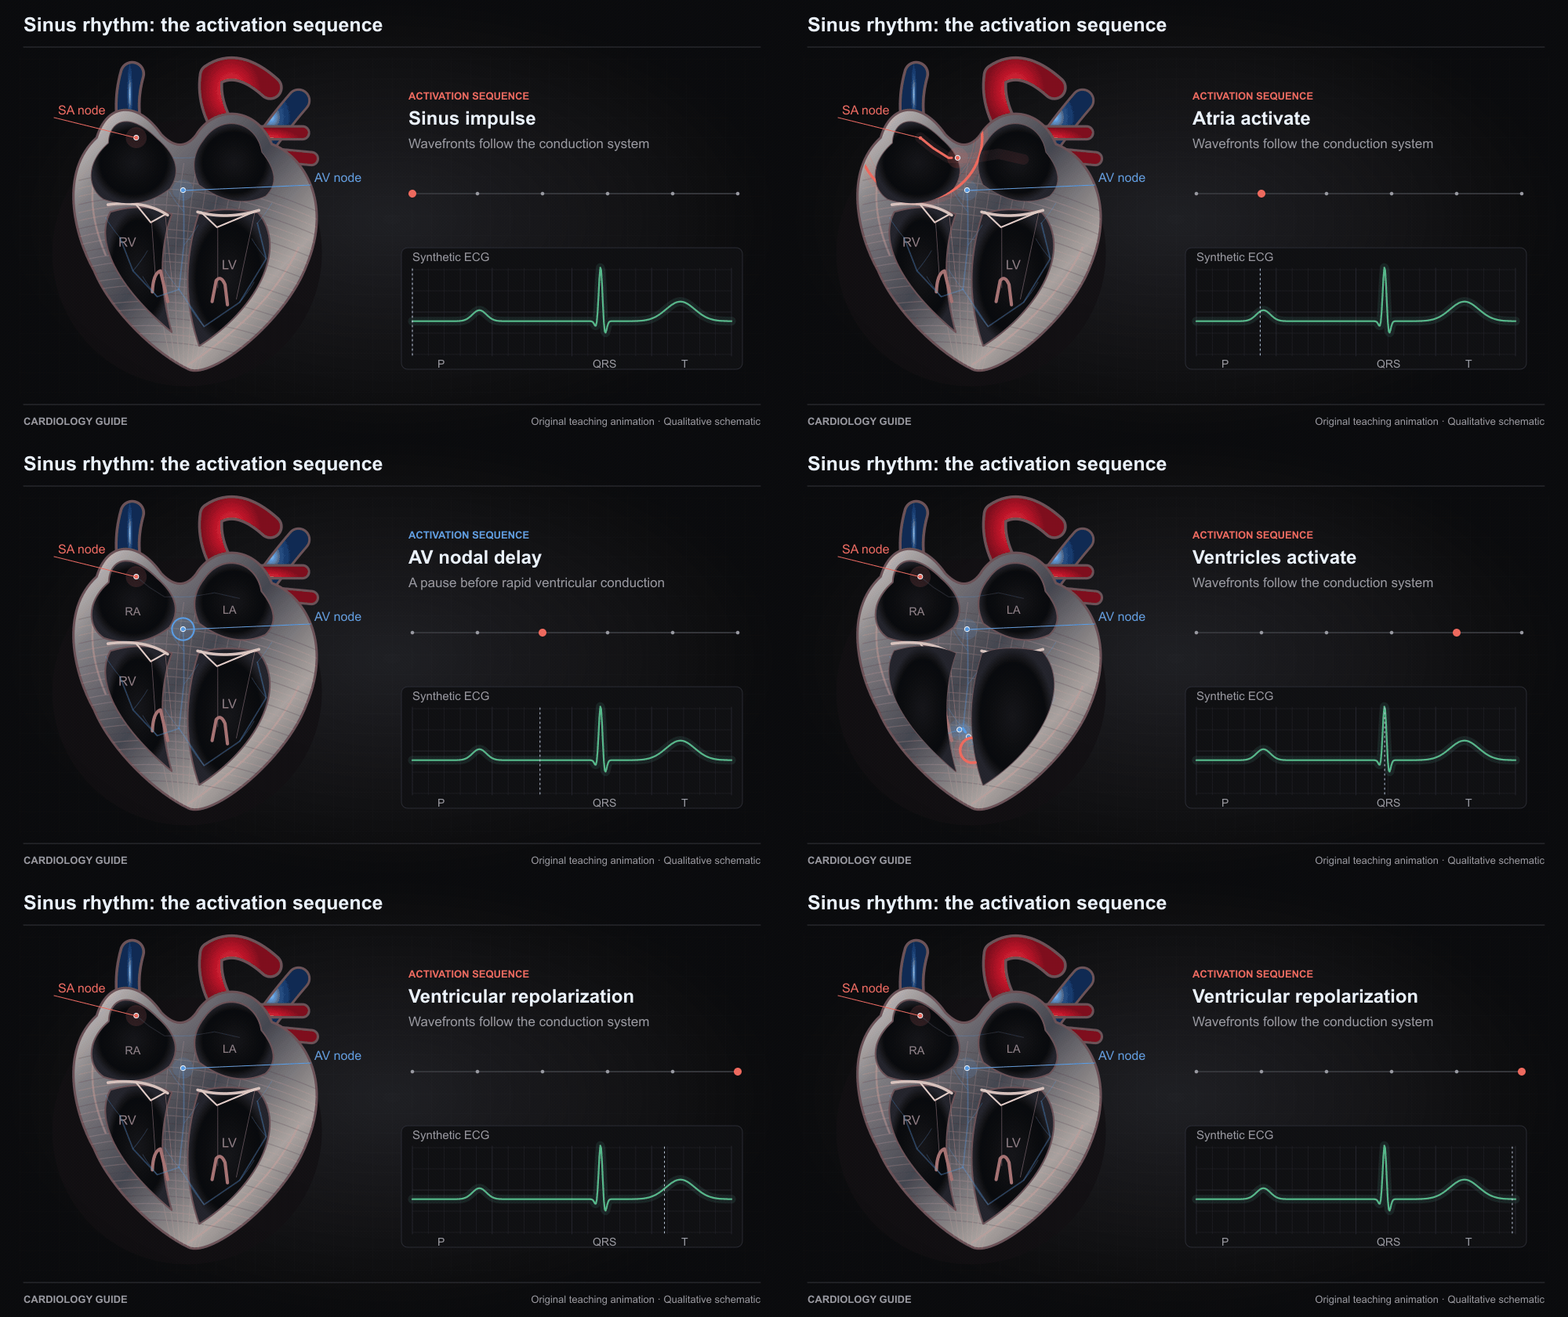
Sinus rhythm: the activation sequence
A sinus impulse spreads across the atria, pauses in the AV node, then travels through the His–Purkinje system to activate the ventricles. Timing and ECG morphology are synthetic and not to scale.
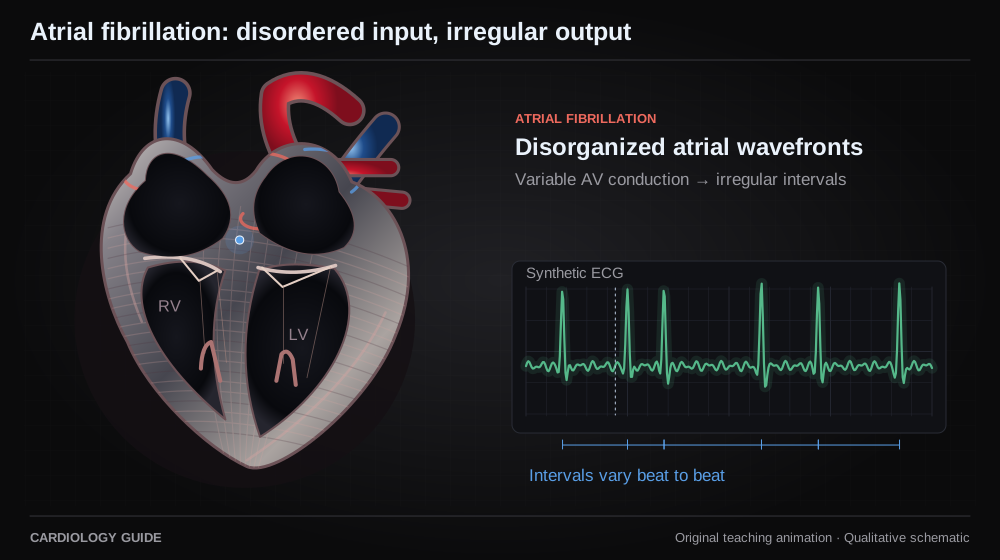
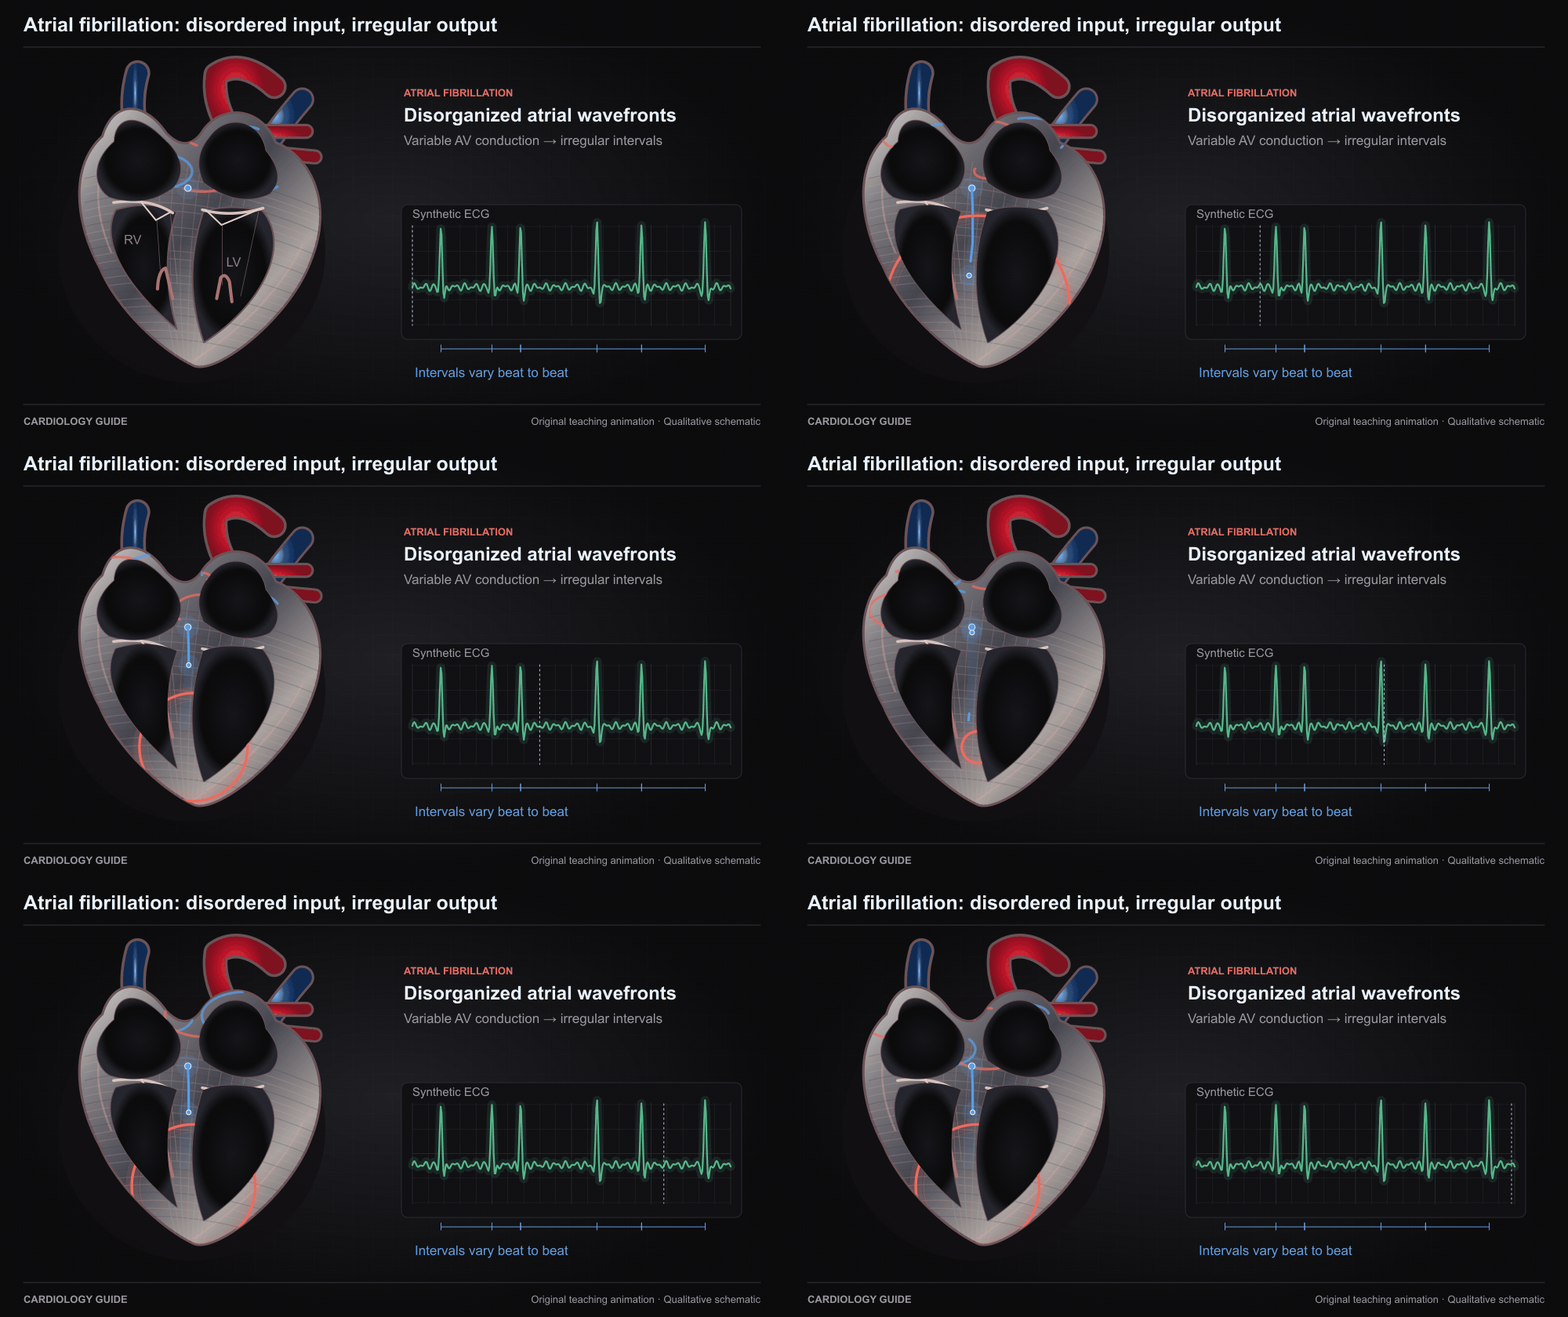
Disorganized atrial activation supplies variable impulses to the AV node, producing irregular ventricular intervals when conduction is intact. Synthetic tracing. AV block or pacing can make the ventricular rhythm regular.
Original qualitative teaching schematic. Motion, particles and traces are illustrative. Timing and geometry are simplified.
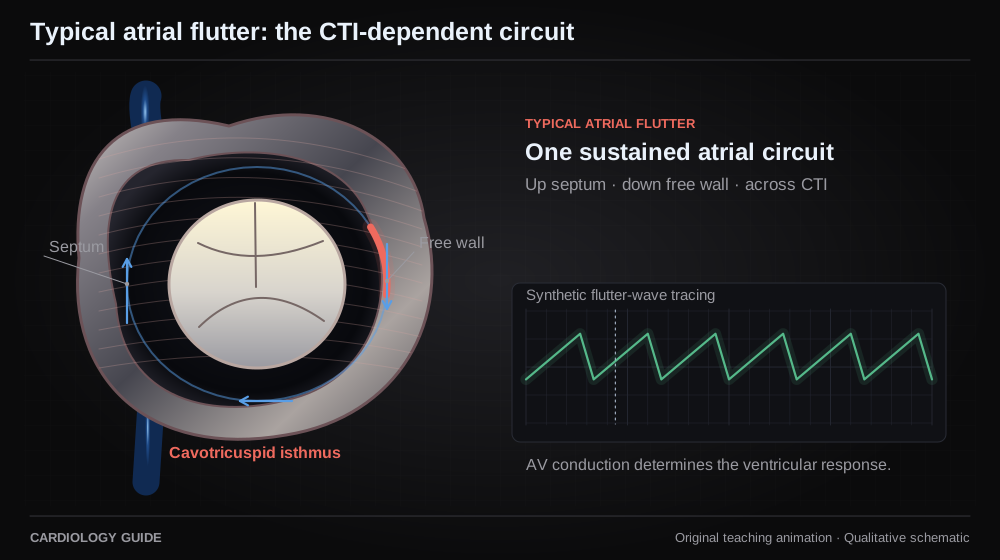
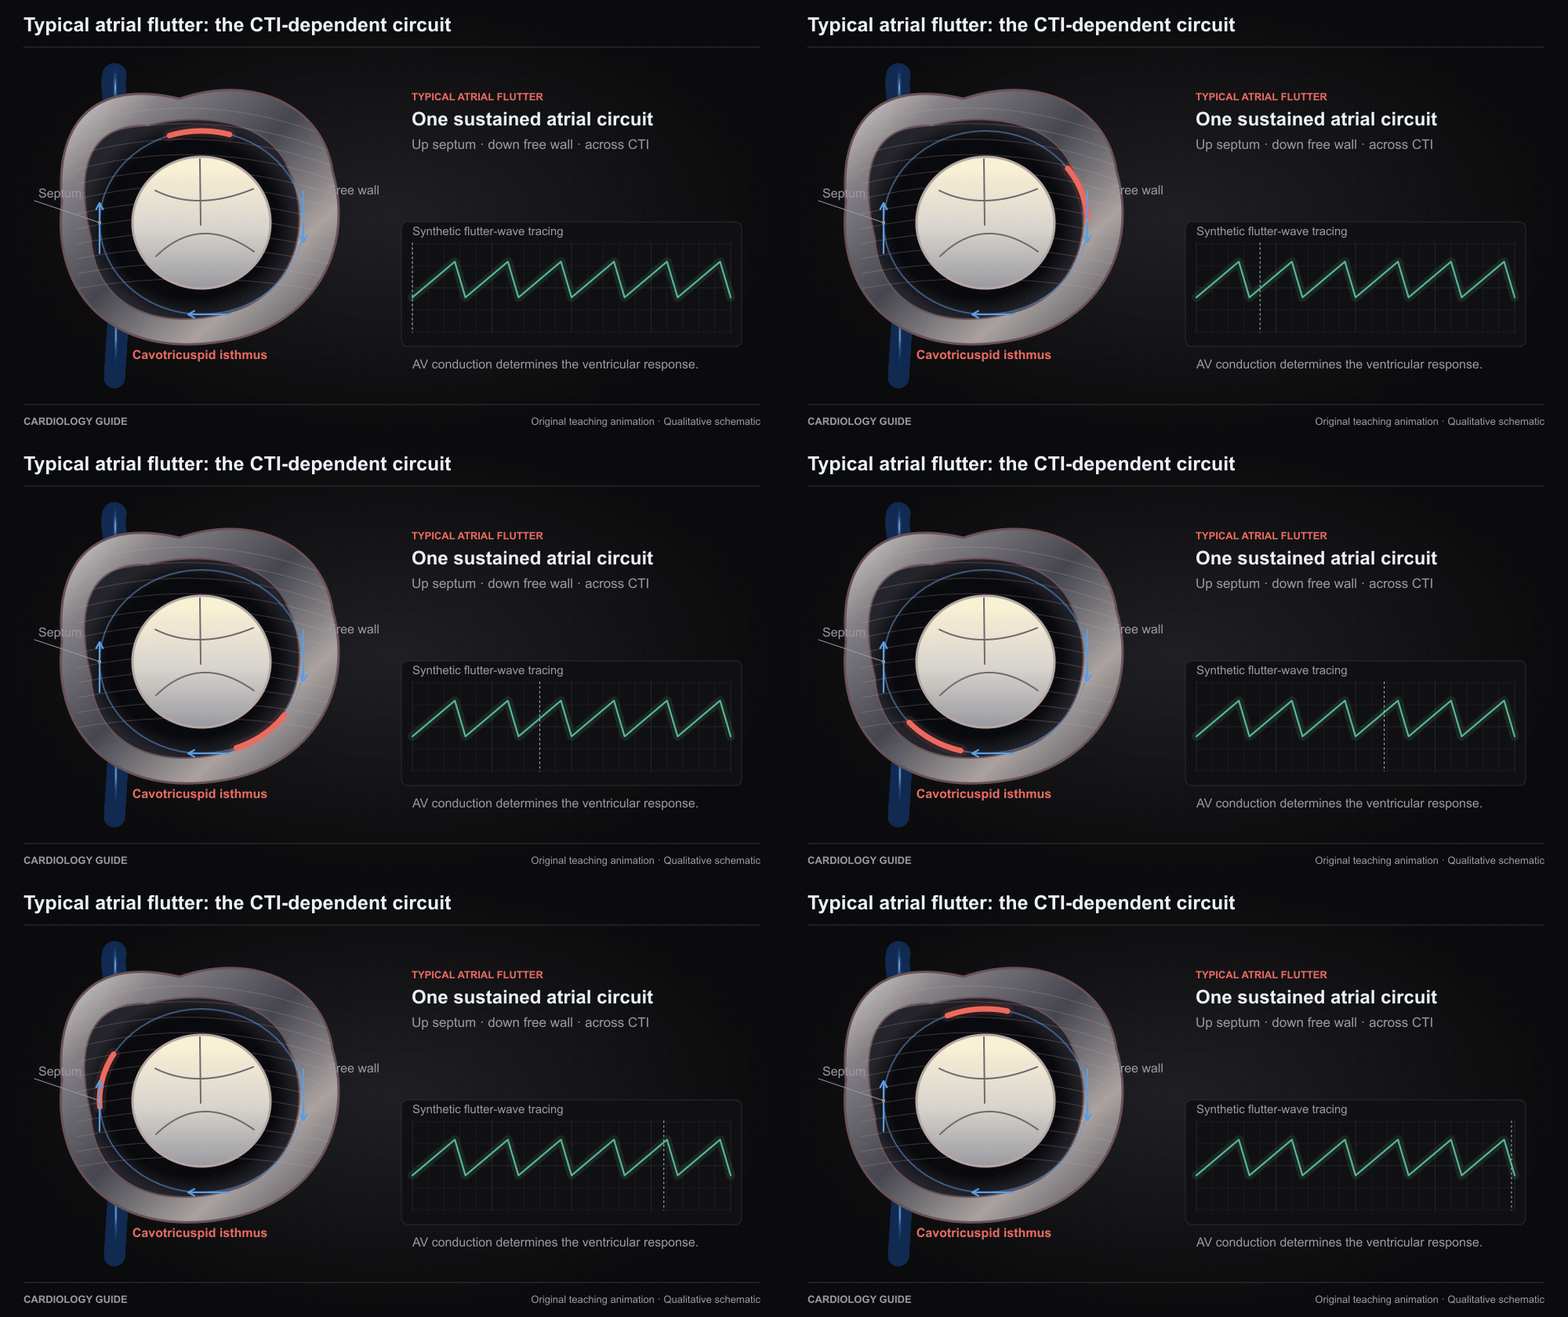
Typical atrial flutter: the CTI-dependent circuit
Typical CTI-dependent flutter travels up the right atrial septum, down the free wall, and through the cavotricuspid isthmus. This is a circuit schematic rather than an anatomical viewing orientation. The ECG is synthetic.
Original qualitative teaching schematic. Motion, particles and traces are illustrative. Timing and geometry are simplified.
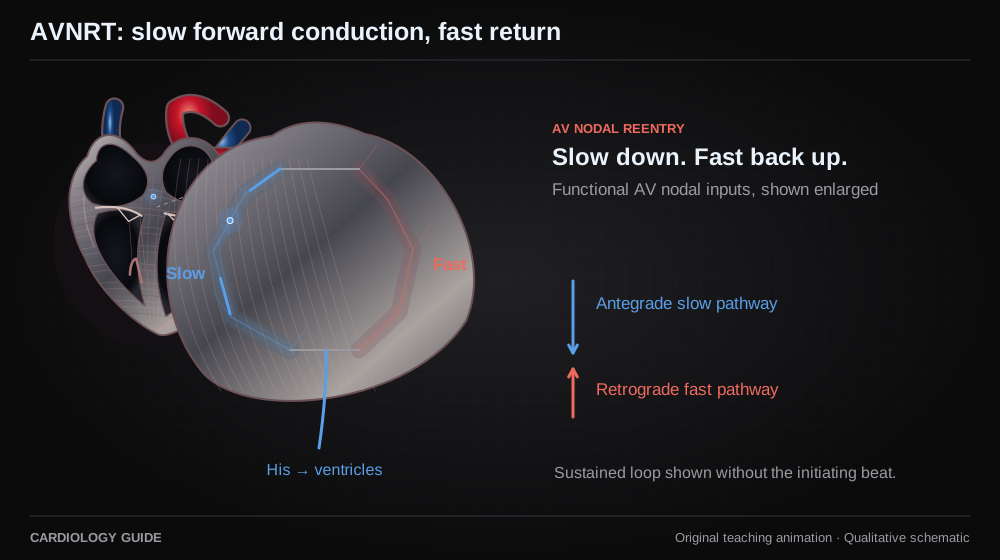
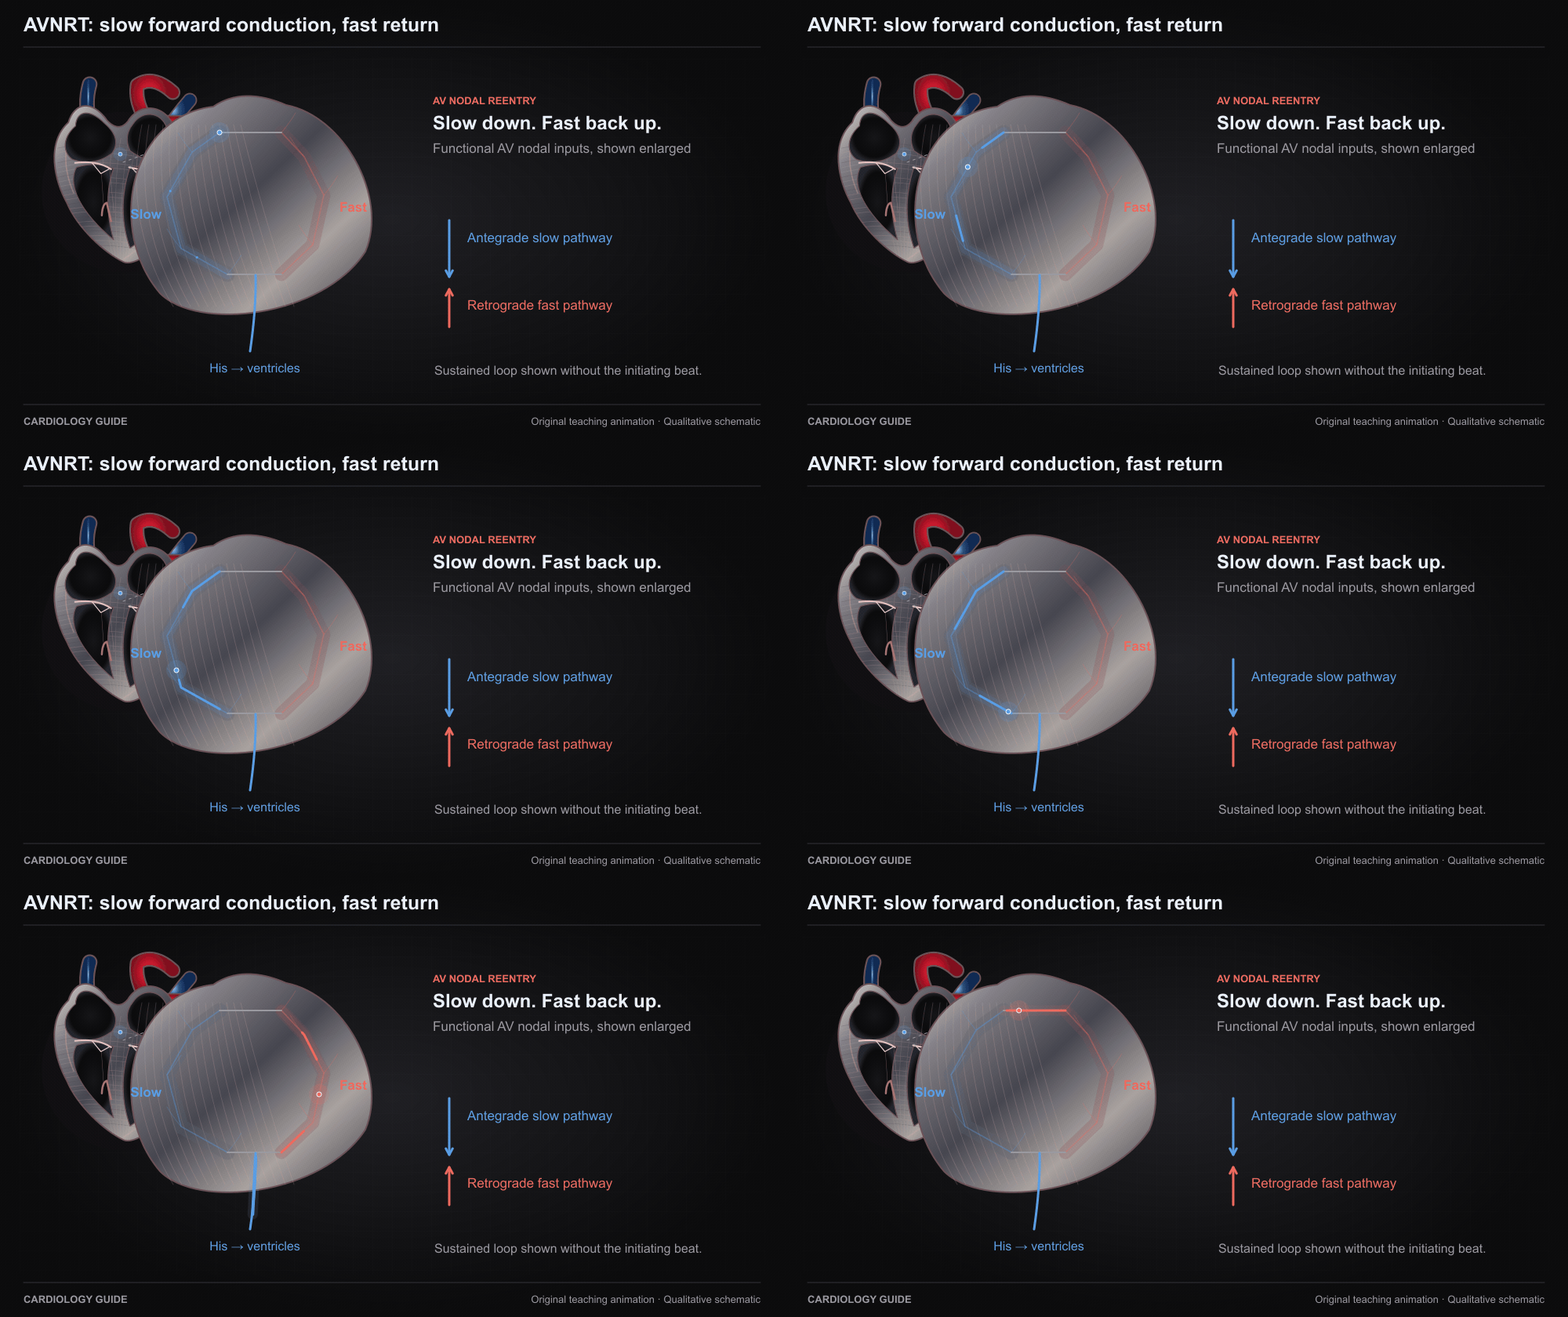
AVNRT: slow forward conduction, fast return
Typical slow–fast AV nodal reentrant tachycardia uses antegrade slow-pathway and retrograde fast-pathway conduction. Pathways represent functional AV nodal inputs, not separate visible tubes. Sustained circuit shown without initiation.
Original qualitative teaching schematic. Motion, particles and traces are illustrative. Timing and geometry are simplified.
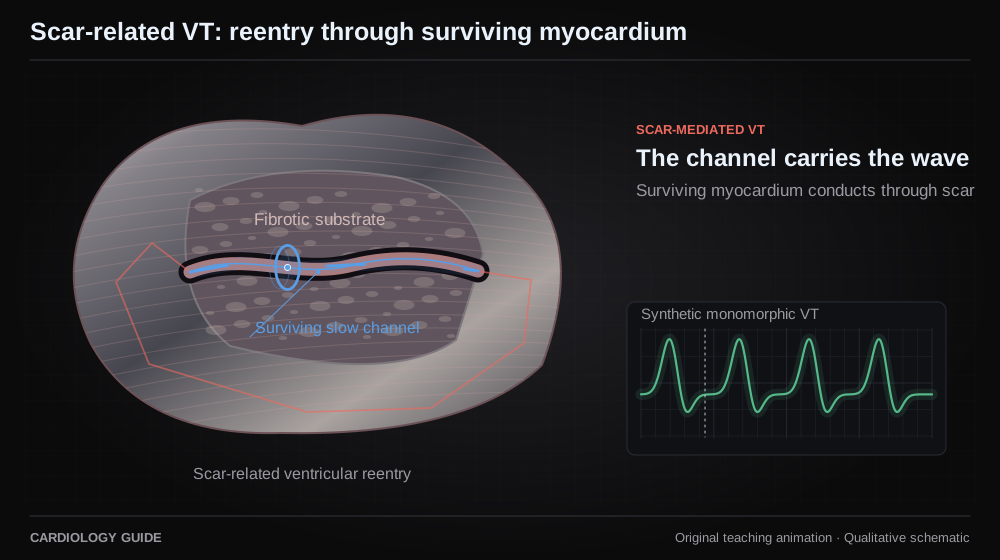
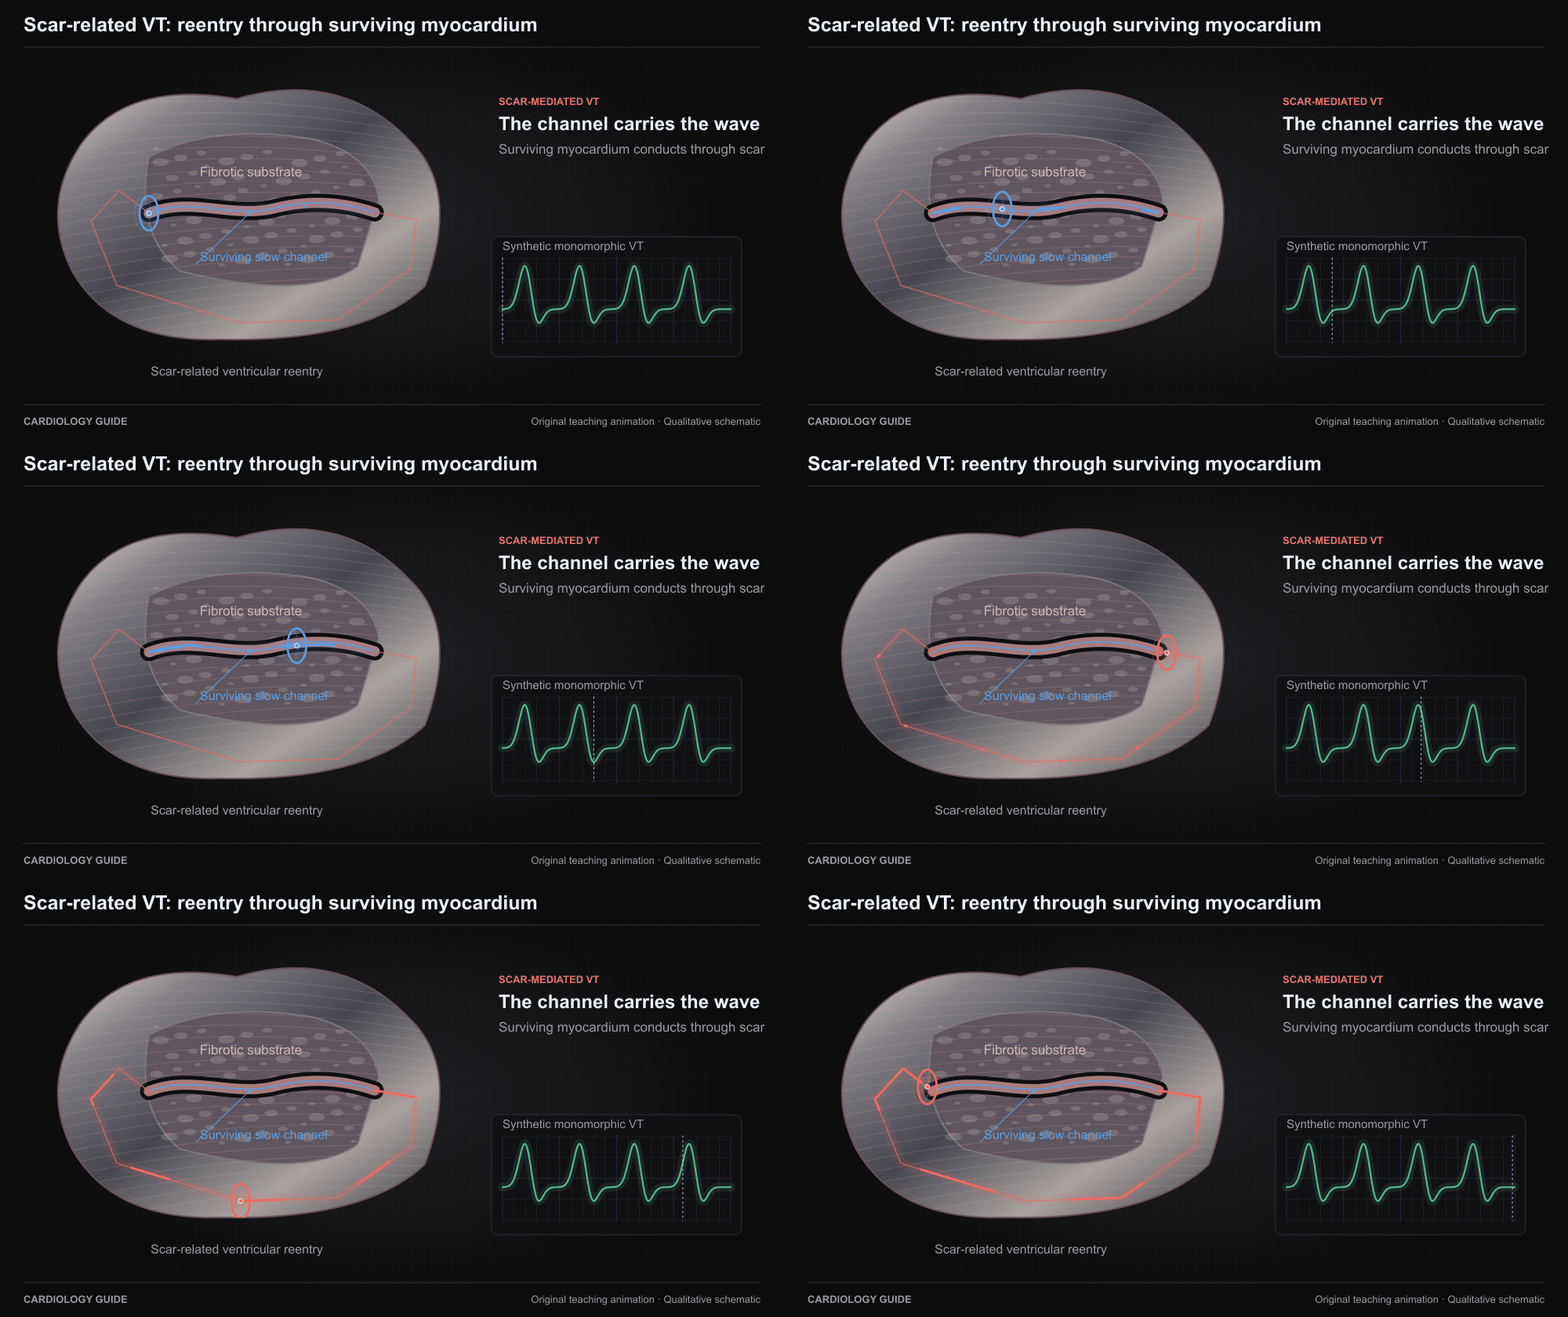
Scar-related VT: reentry through surviving myocardium
A surviving myocardial channel within or beside scar can sustain reentry with slow conduction and an exit to the ventricle. This is one simplified scar-related mechanism, not a map of a patient or all ventricular tachycardias.
Original qualitative teaching schematic. Motion, particles and traces are illustrative. Timing and geometry are simplified.
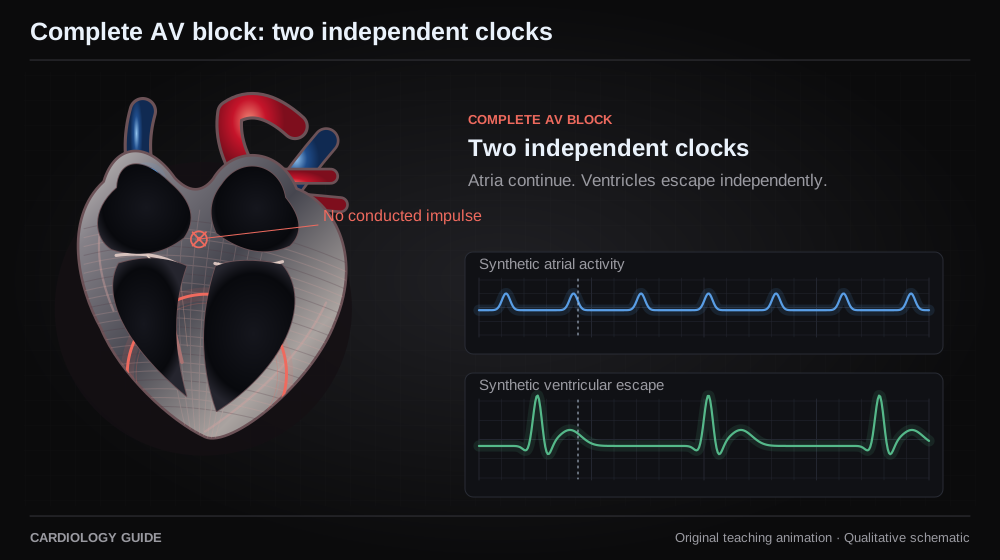
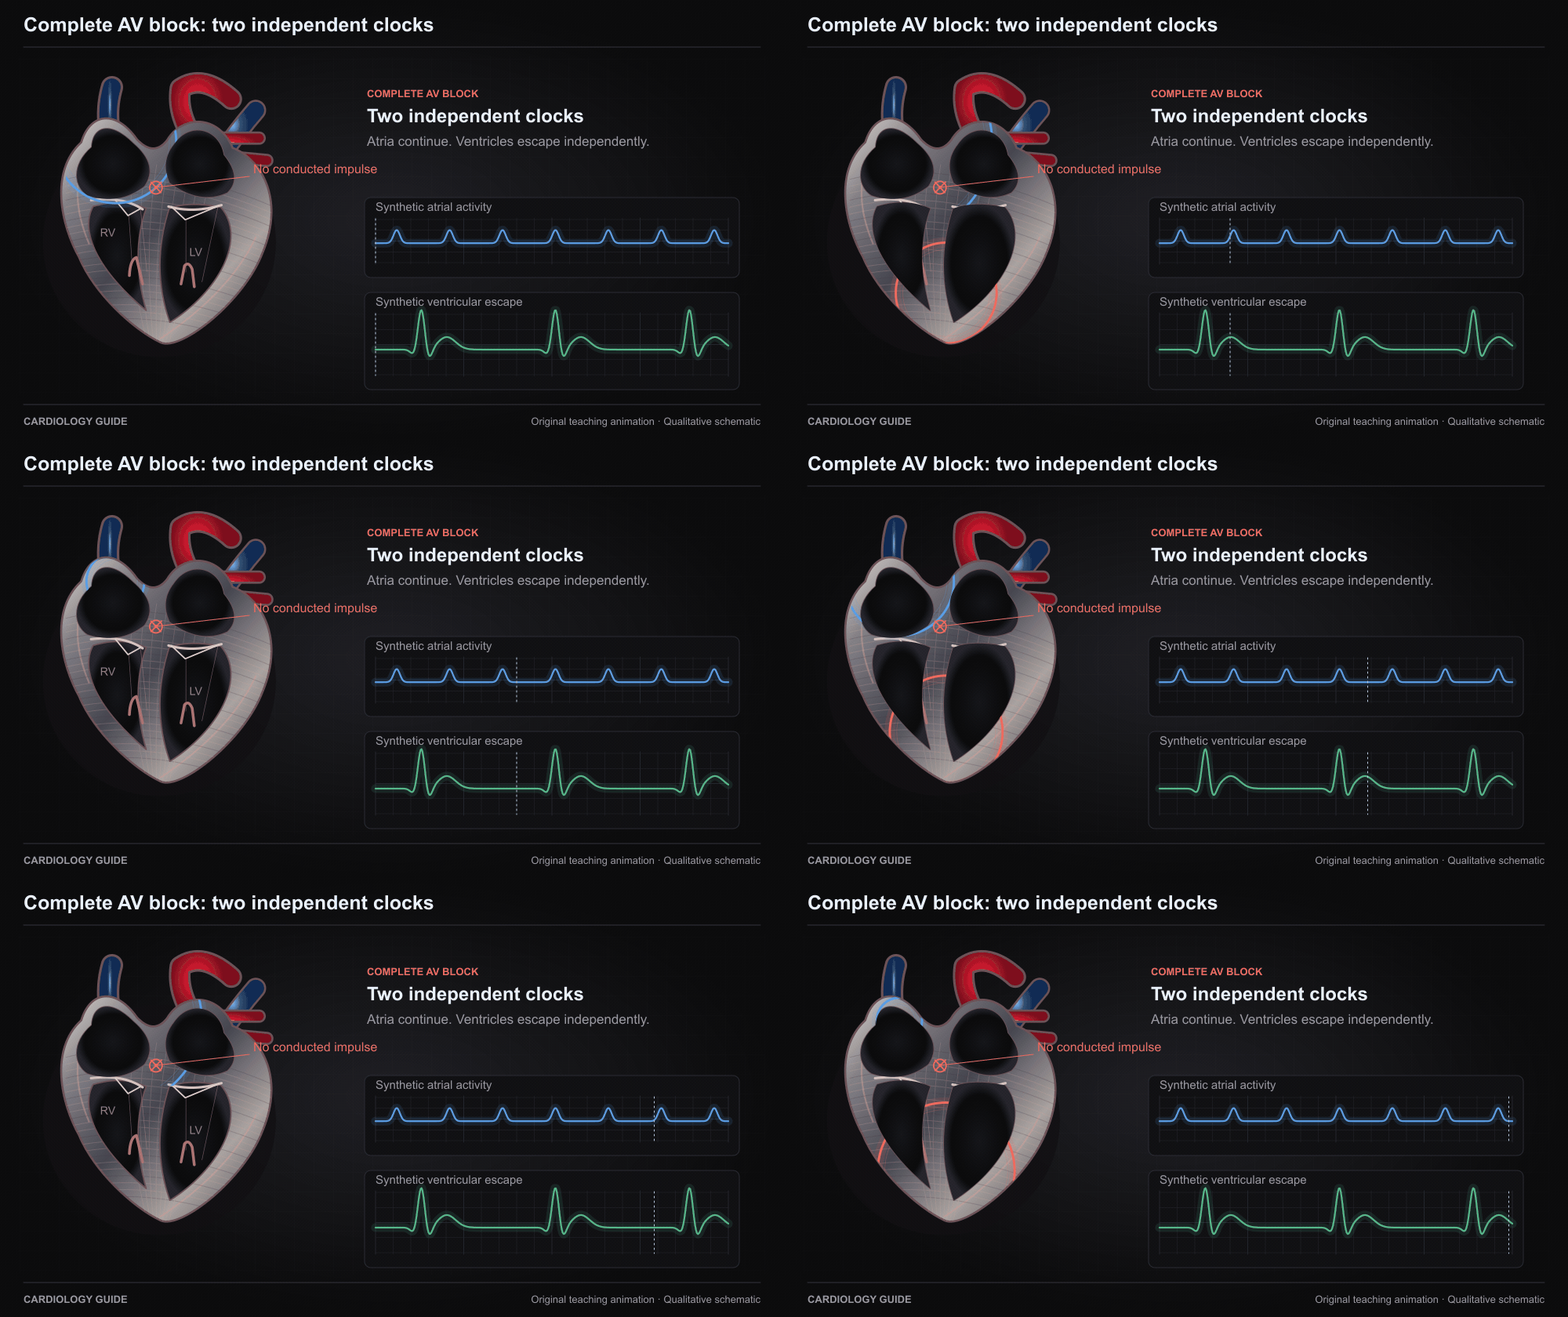
Complete AV block: two independent clocks
In complete AV block, atrial impulses do not conduct to the ventricles. A slower escape rhythm can continue independently. Synthetic ladder and tracing. AV dissociation alone does not prove complete AV block.
Original qualitative teaching schematic. Motion, particles and traces are illustrative. Timing and geometry are simplified.
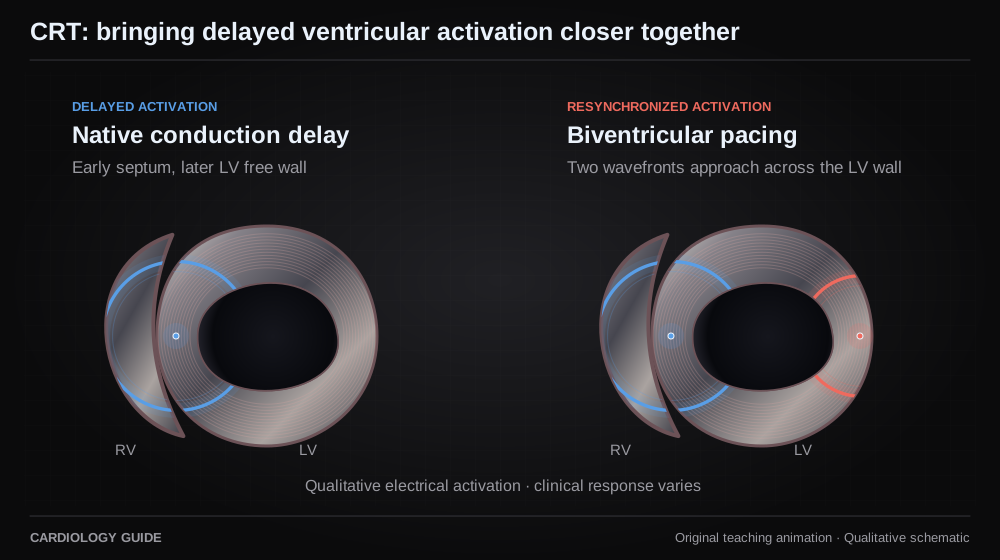
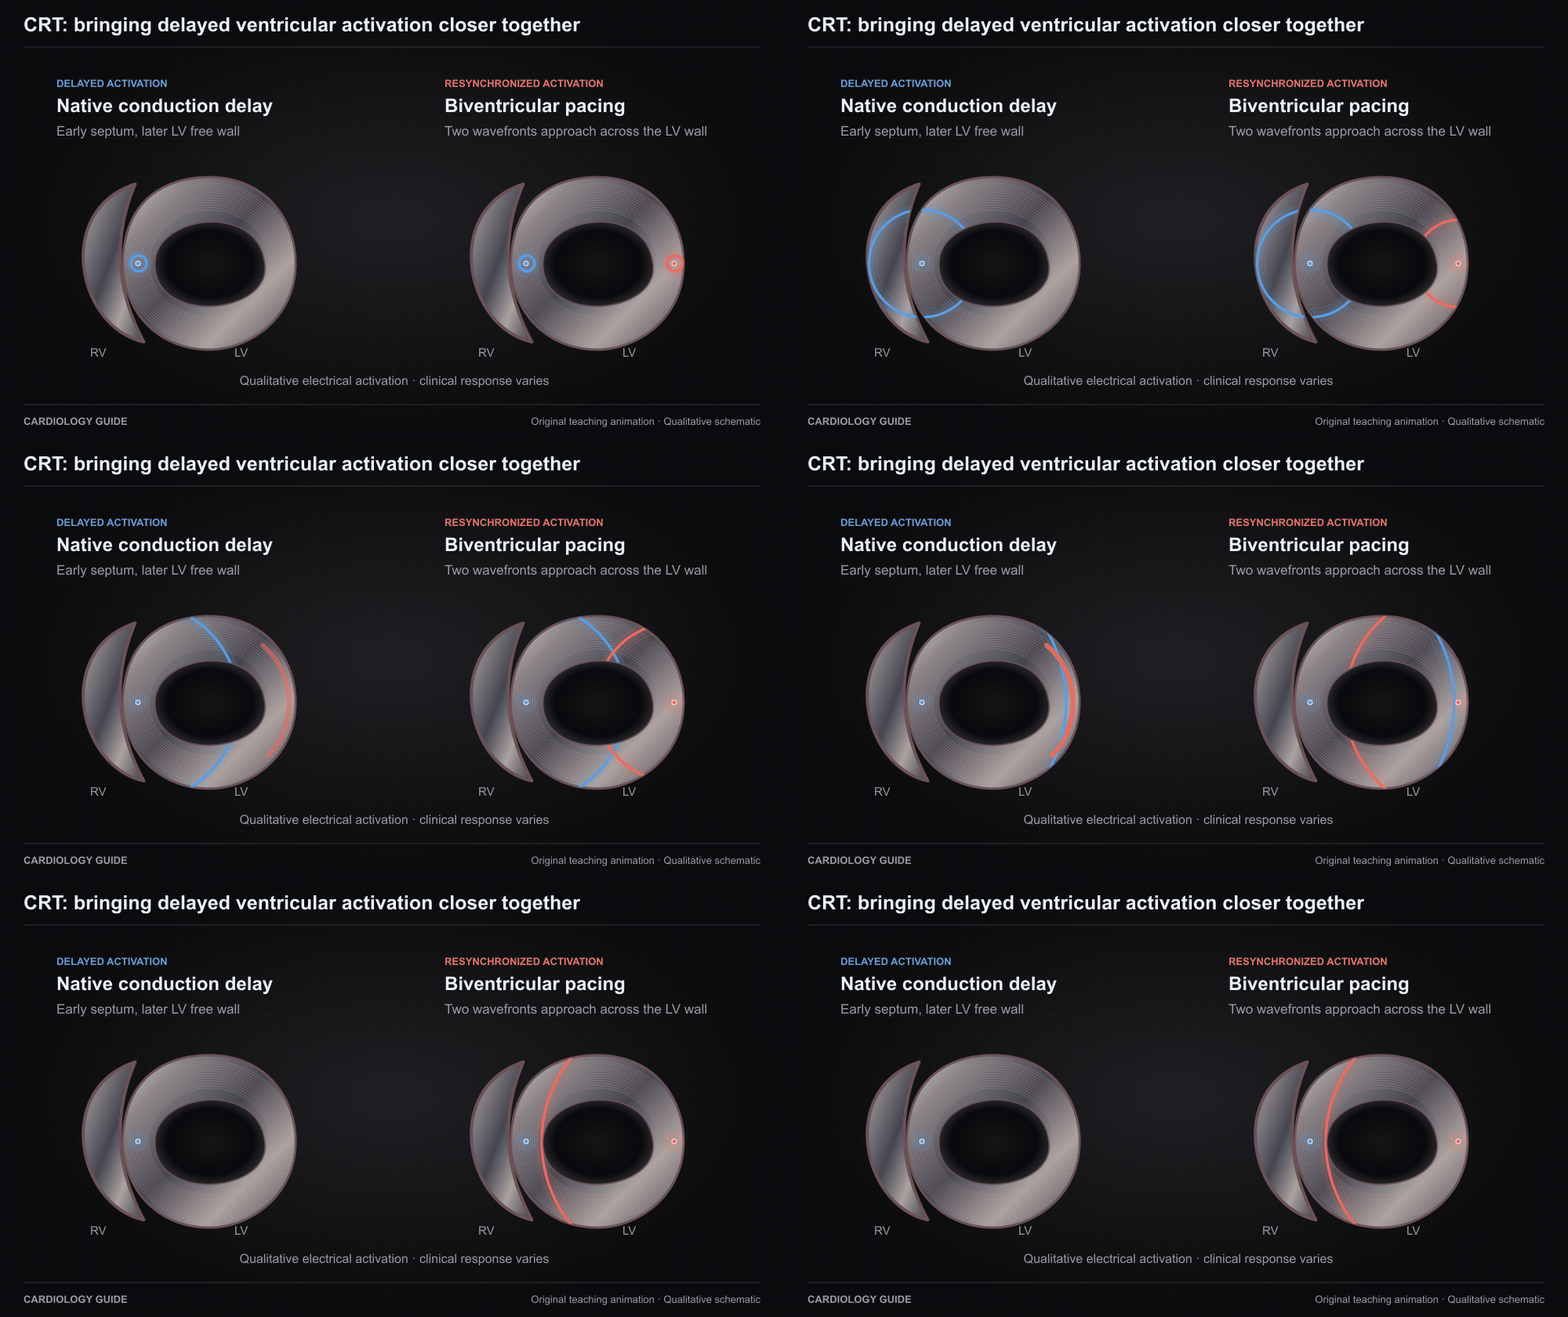
CRT: bringing delayed ventricular activation closer together
The left schematic illustrates delayed LV activation. The right shows two pacing sites launching more coordinated activation. A qualitative electrical model of biventricular CRT, not a prediction of mechanical response or benefit.
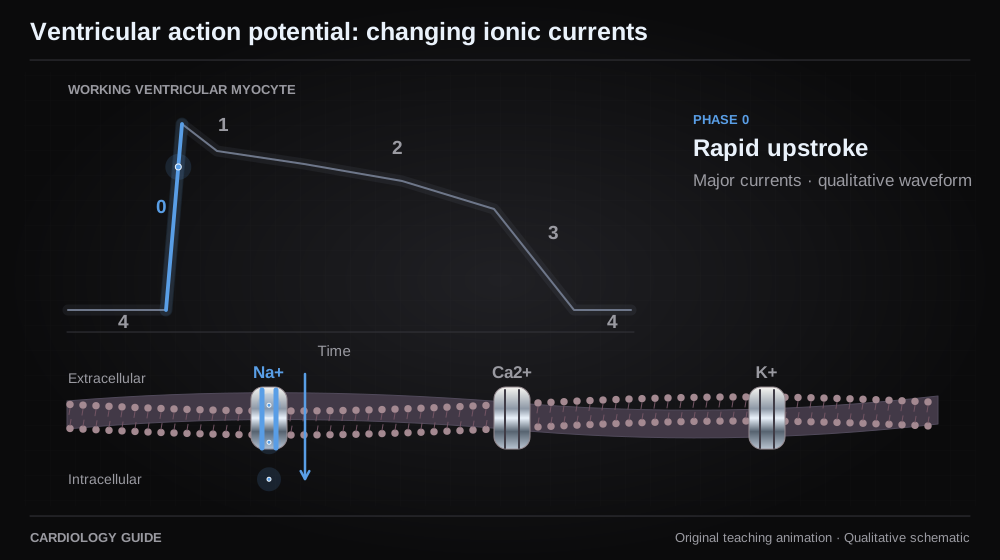
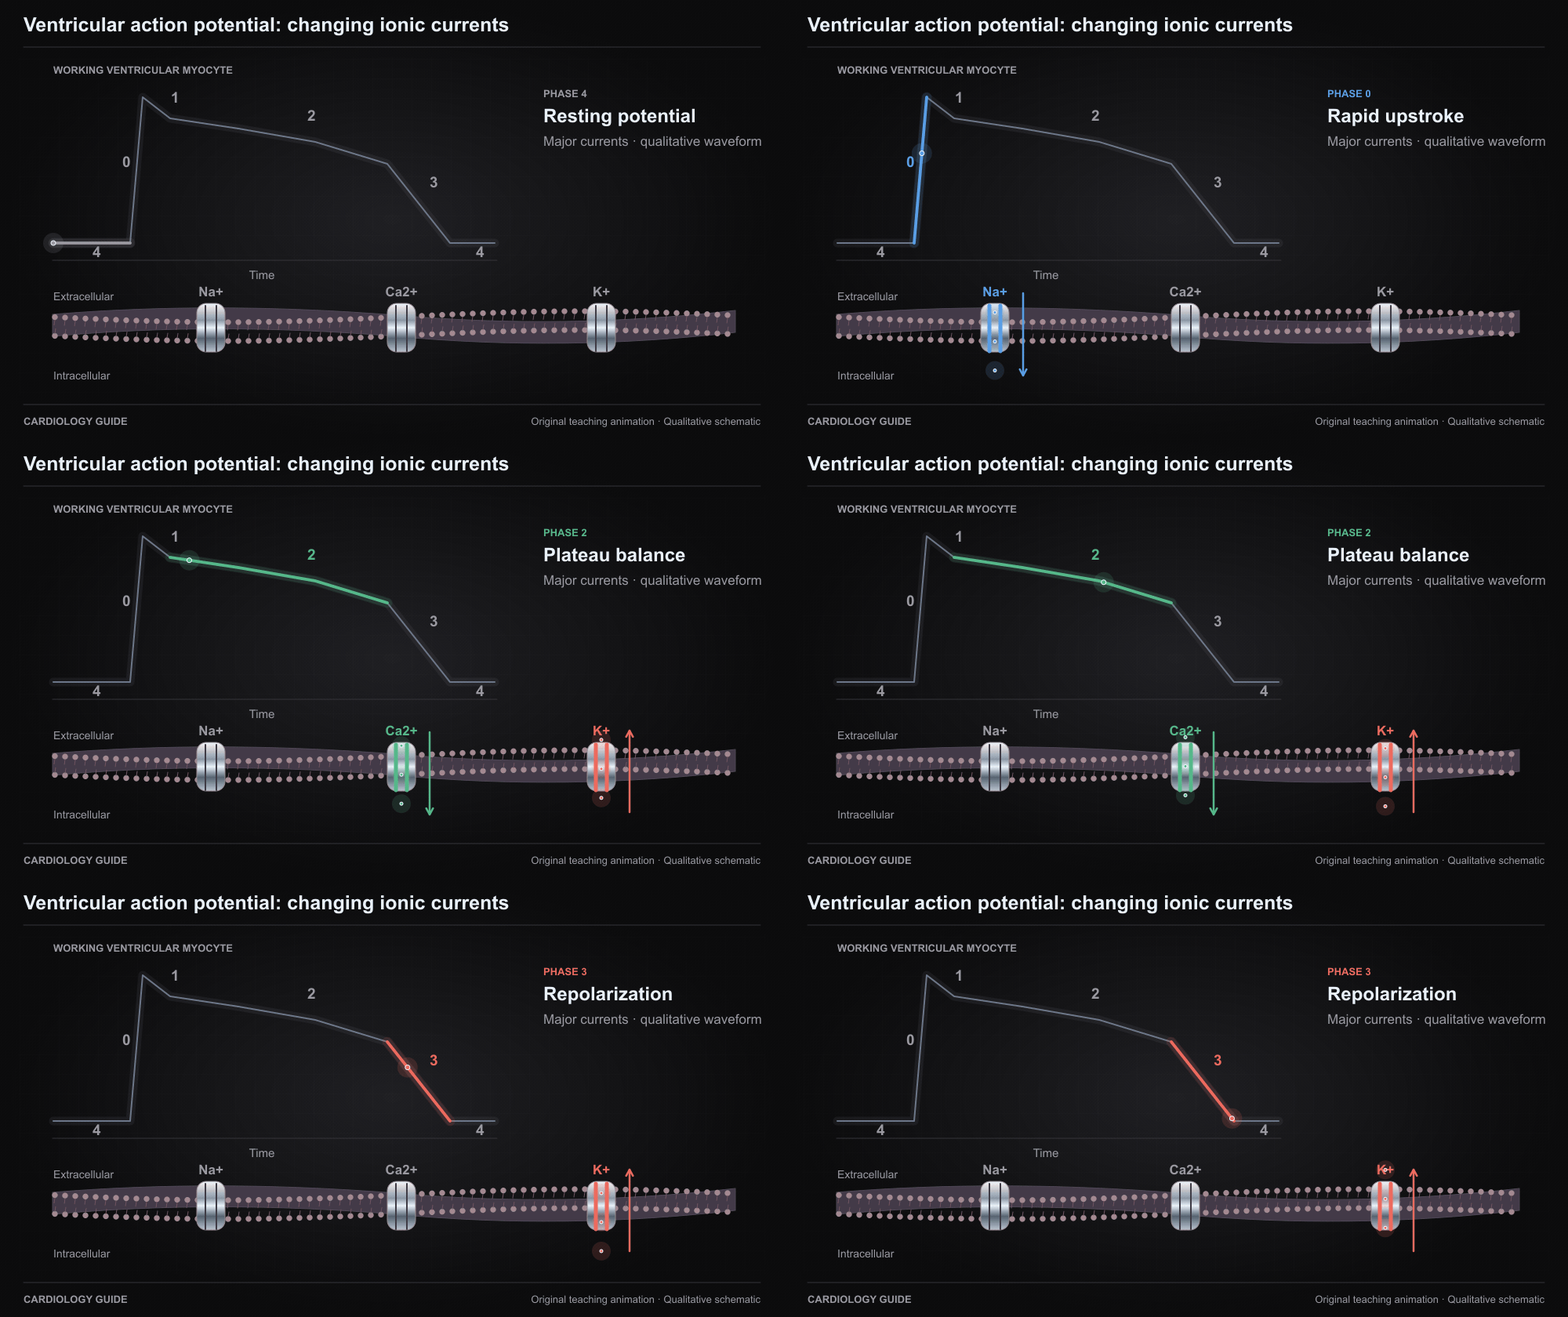
A qualitative working ventricular myocyte action potential highlights sodium entry, early potassium efflux, the calcium–potassium plateau balance, and repolarization. Major currents only. Not a pacemaker-cell waveform or a quantitative simulation.
Original qualitative teaching schematic. Motion, particles and traces are illustrative. Timing and geometry are simplified.
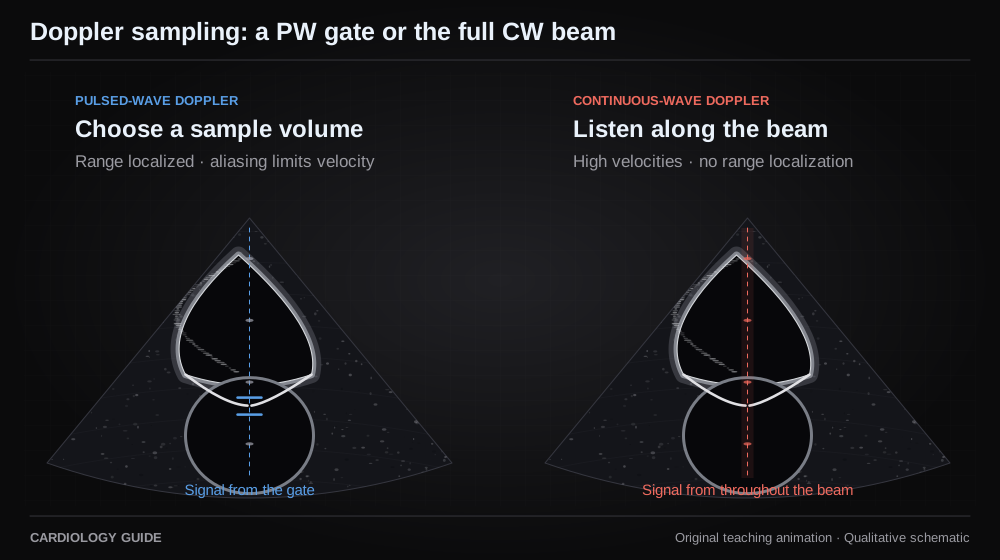
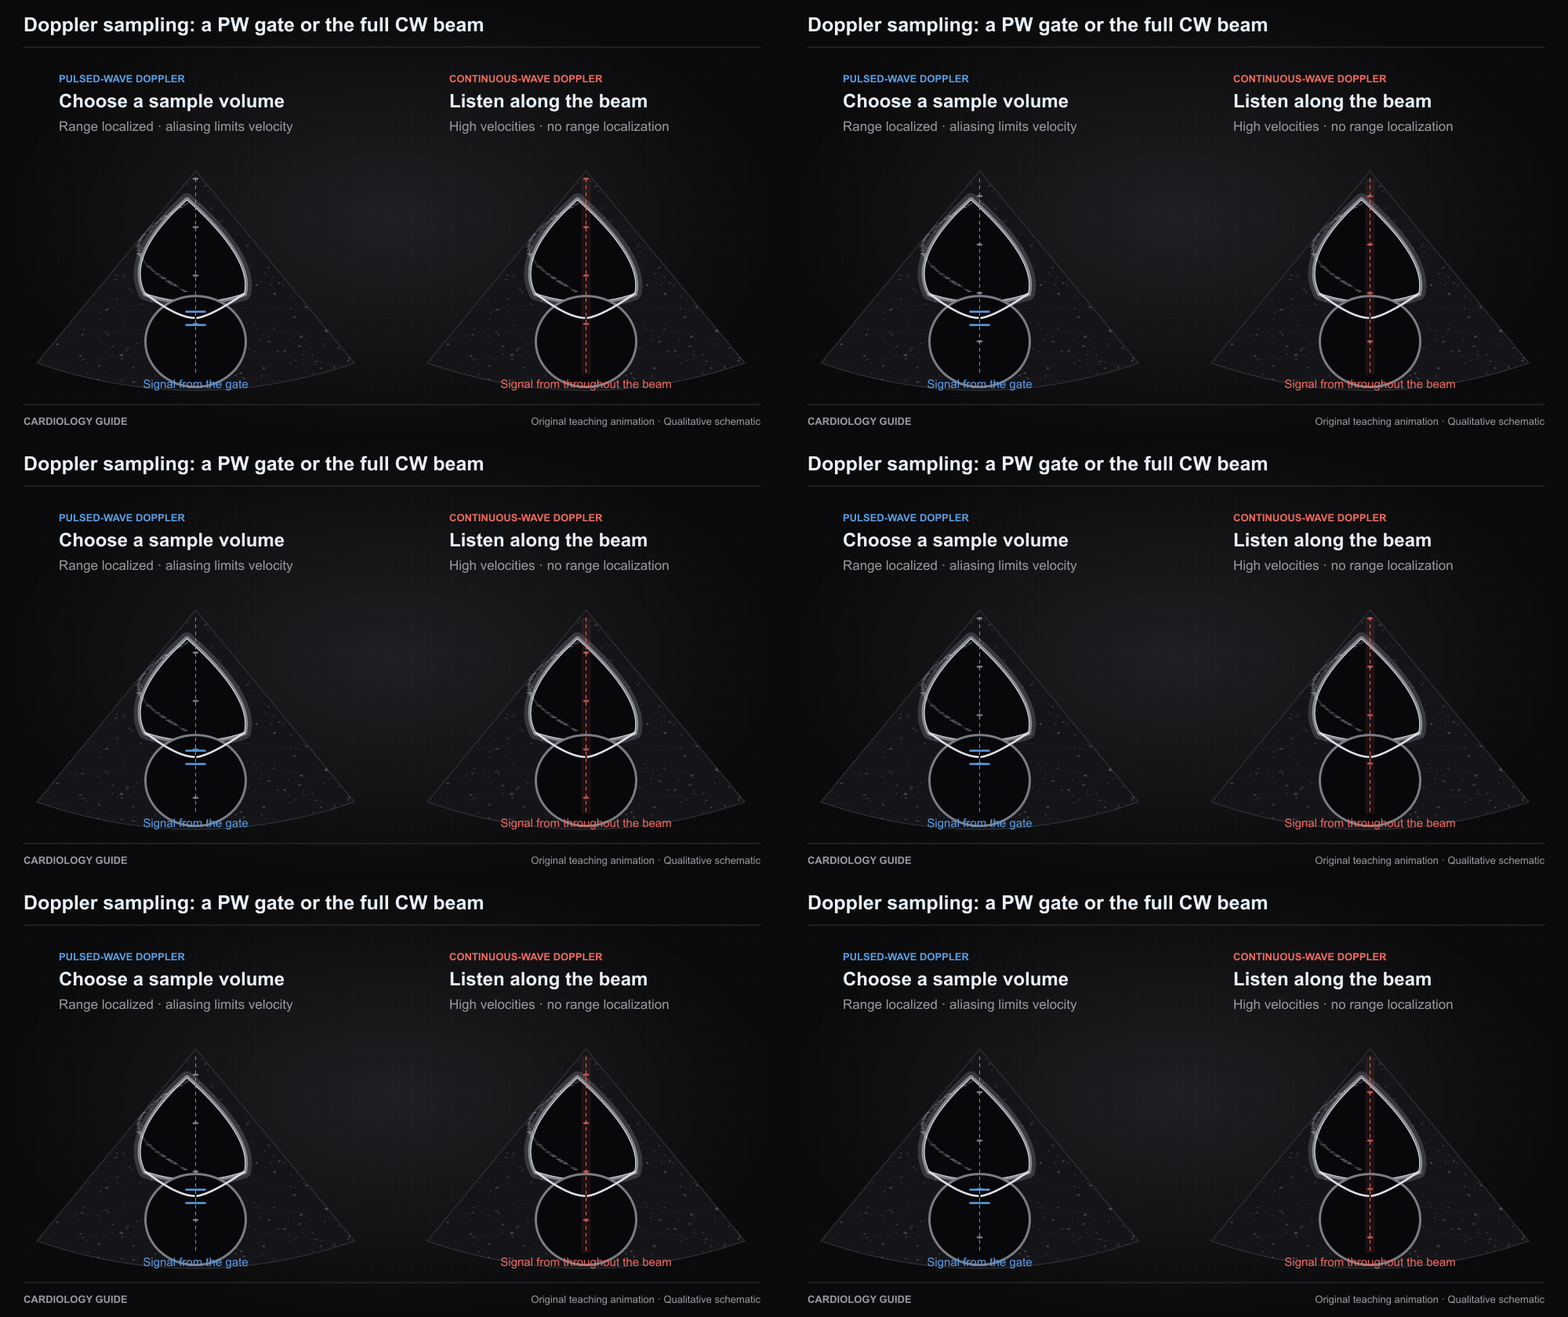
Doppler sampling: a PW gate or the full CW beam
Pulsed-wave Doppler localizes measurement to a selected sample volume but is subject to aliasing. Continuous-wave Doppler receives along the beam without depth localization and can measure high velocities. Synthetic ultrasound view, without calculated velocities.
Original qualitative teaching schematic. Motion, particles and traces are illustrative. Timing and geometry are simplified.
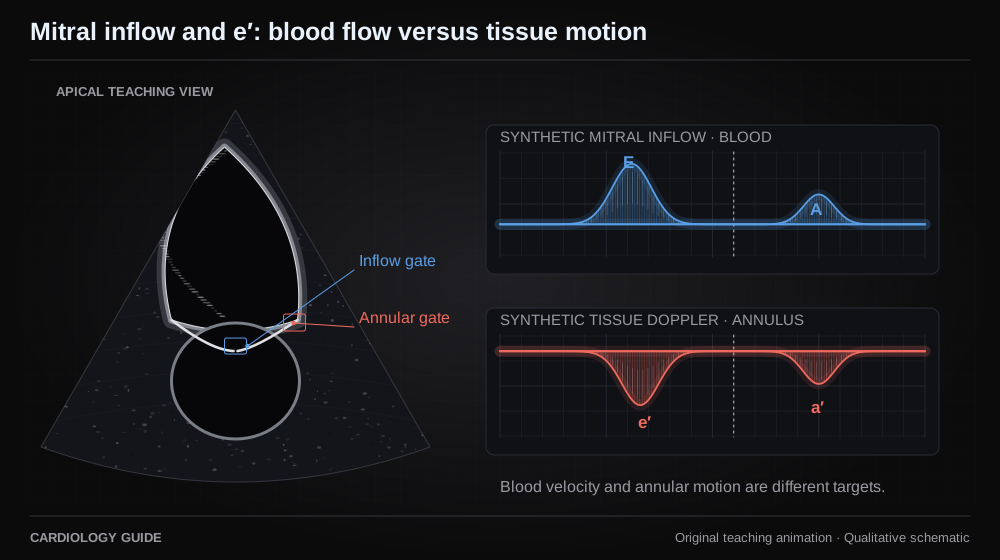
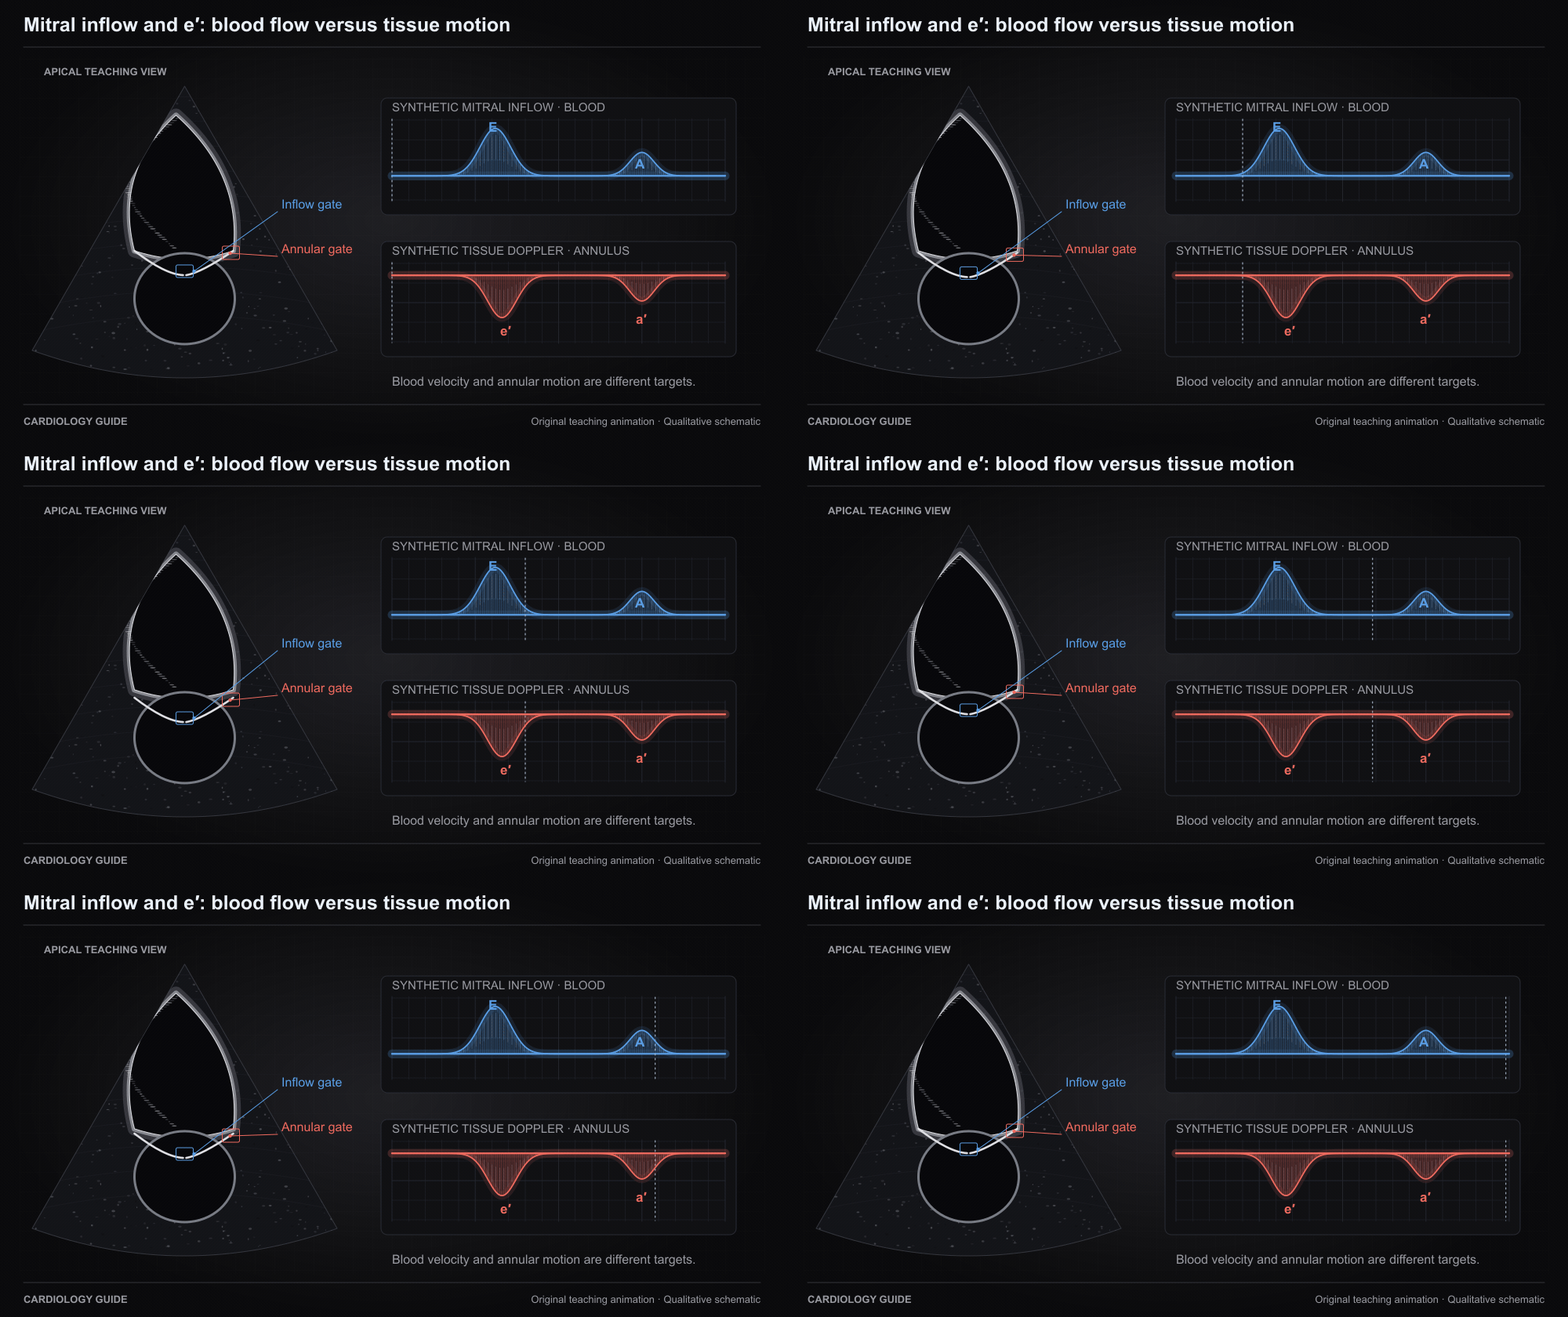
Mitral inflow and e′: blood flow versus tissue motion
Mitral inflow E samples early filling blood velocity at the leaflet tips. Tissue Doppler e′ samples early diastolic mitral annular motion. The two measure different targets. Synthetic ultrasound and spectra, without numeric pressure estimation.
Original qualitative teaching schematic. Motion, particles and traces are illustrative. Timing and geometry are simplified.
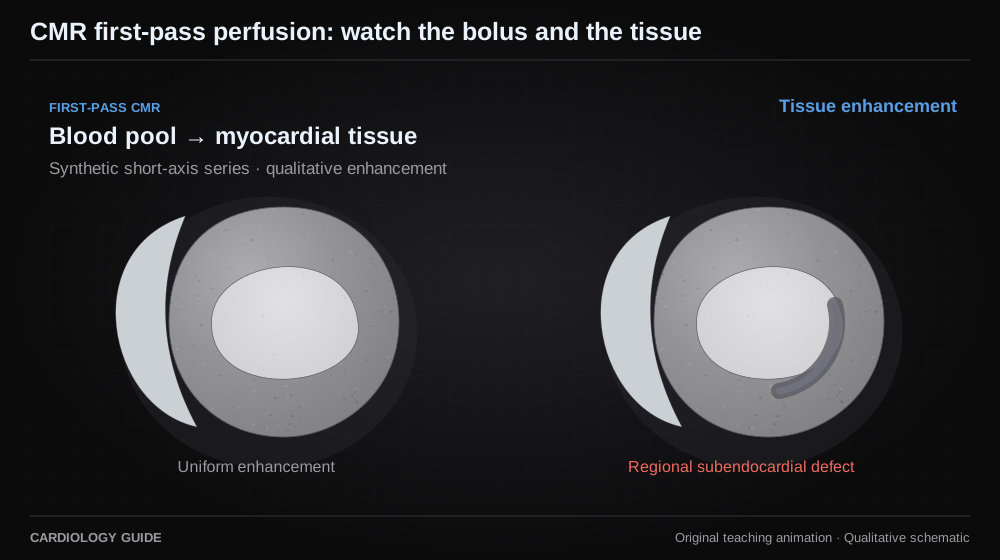
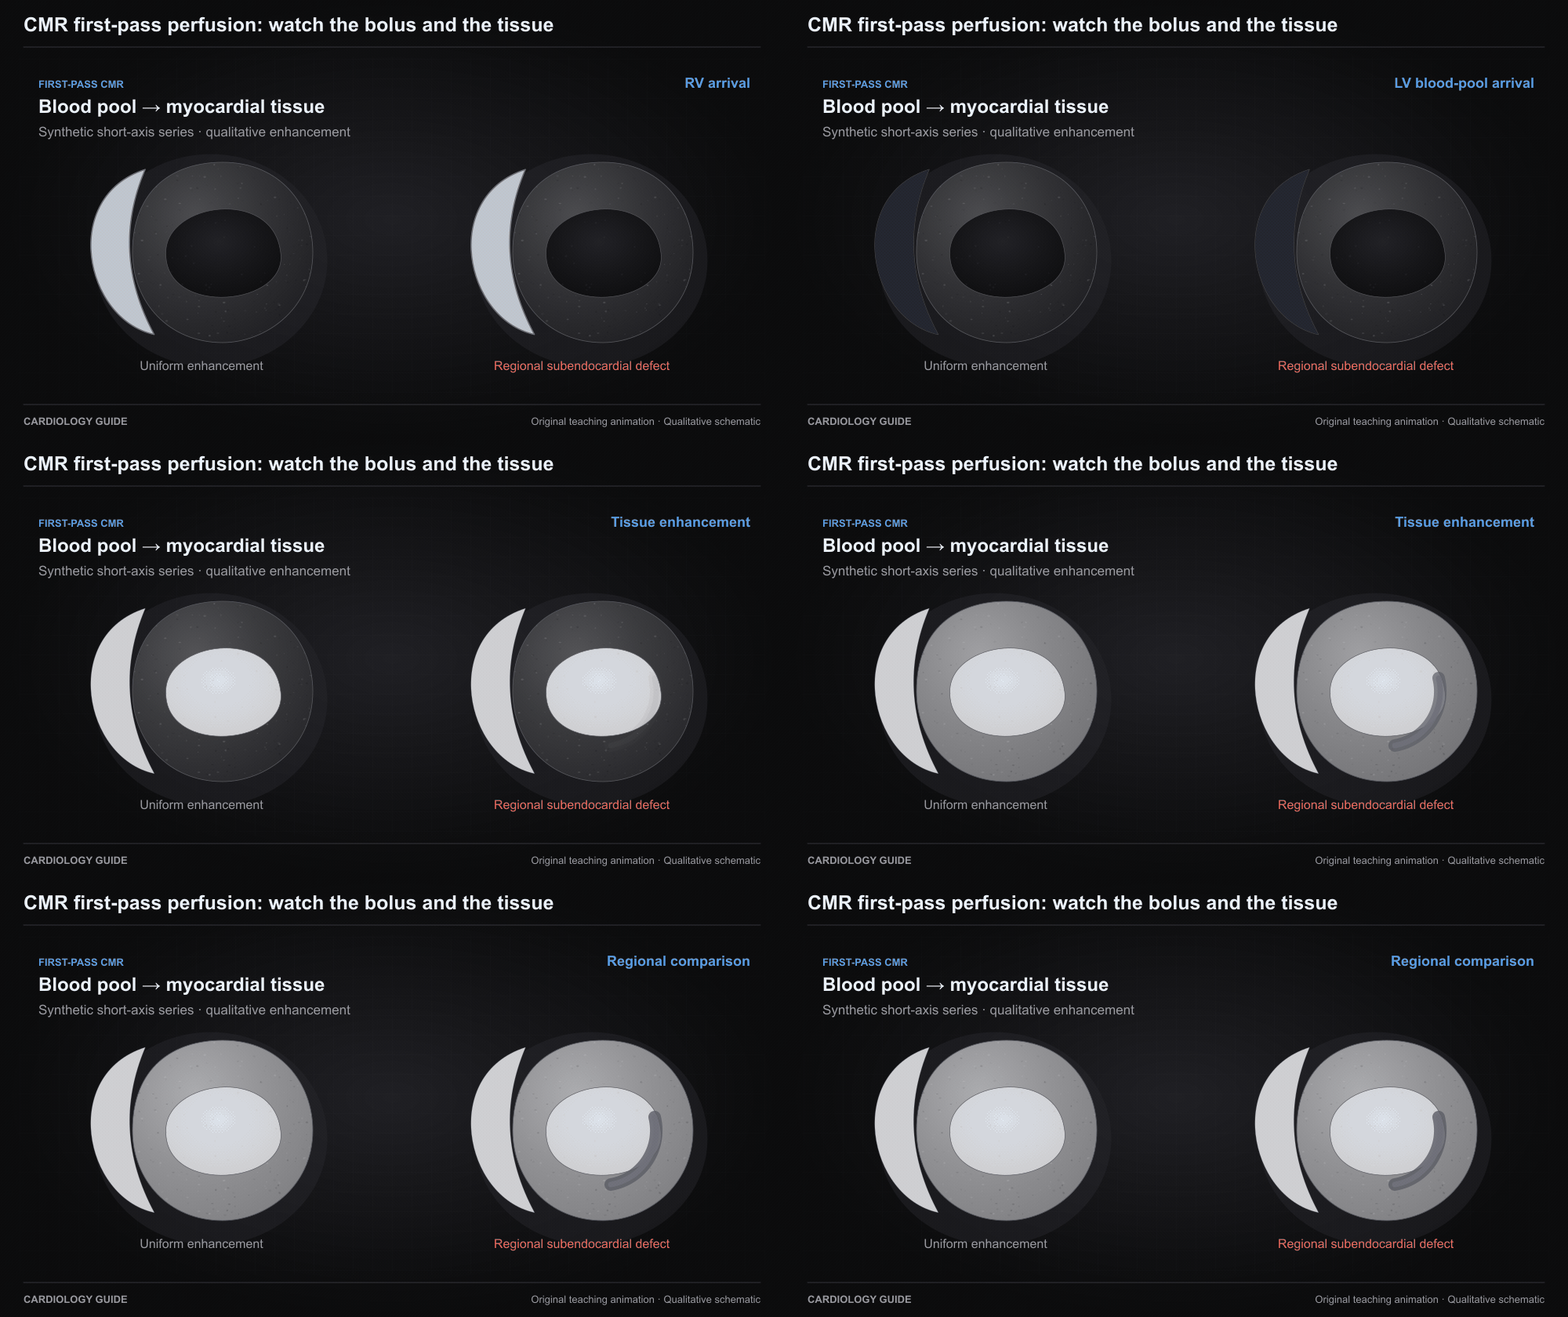
CMR first-pass perfusion: watch the bolus and the tissue
A synthetic first-pass sequence shows contrast reaching the RV, then LV blood pool, then myocardial tissue. A persistent regional subendocardial defect is illustrated. Not acquired CMR. Artifacts and rest or LGE comparison must be assessed separately.
Original qualitative teaching schematic. Motion, particles and traces are illustrative. Timing and geometry are simplified.
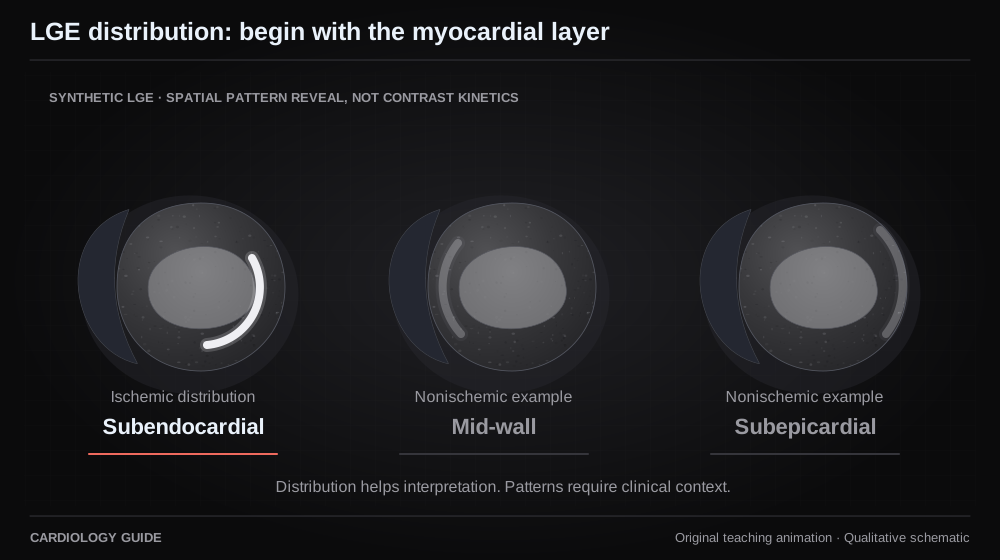
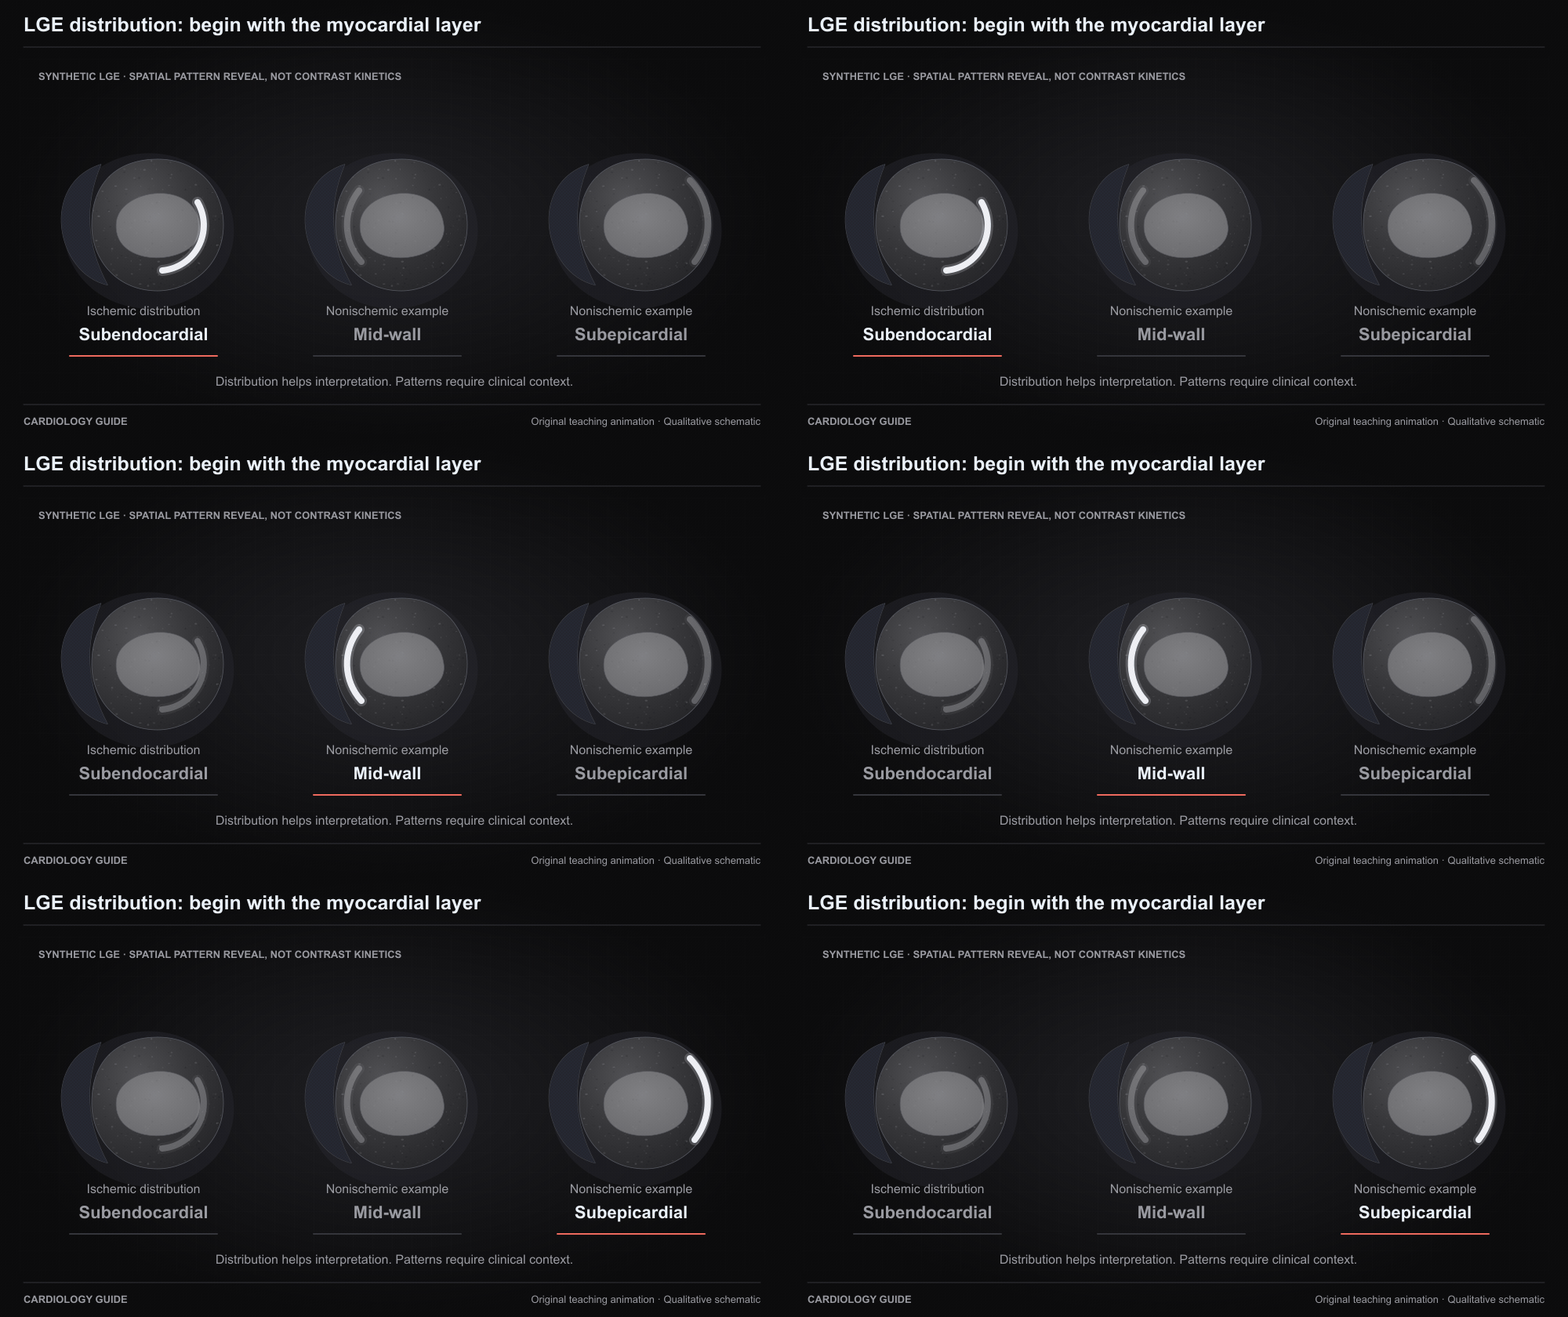
LGE distribution: begin with the myocardial layer
Synthetic short-axis tissue views compare an ischemic subendocardial pattern with example nonischemic mid-wall and subepicardial patterns. The reveal sequence teaches spatial distribution, not contrast kinetics. Patterns need clinical context and are not disease-specific.
Original qualitative teaching schematic. Motion, particles and traces are illustrative. Timing and geometry are simplified.
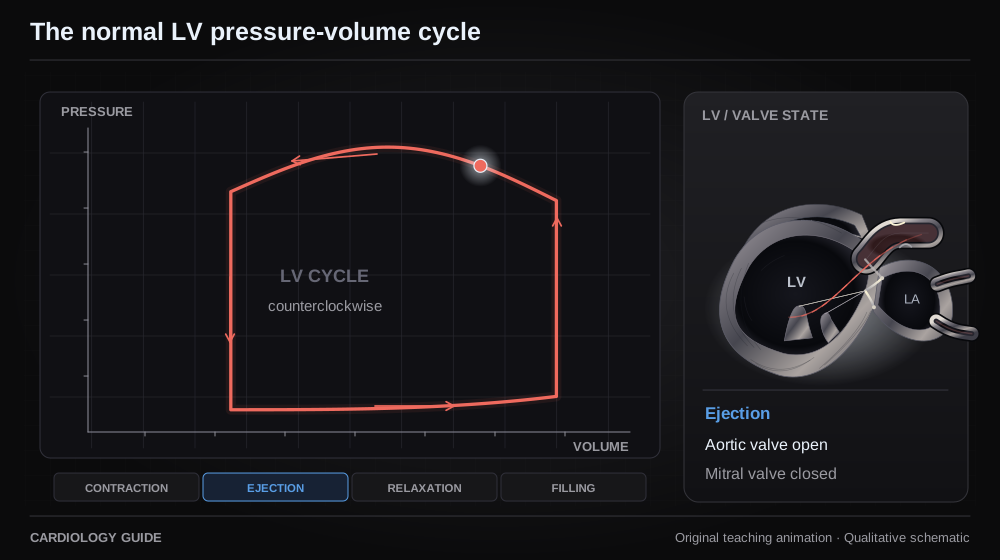
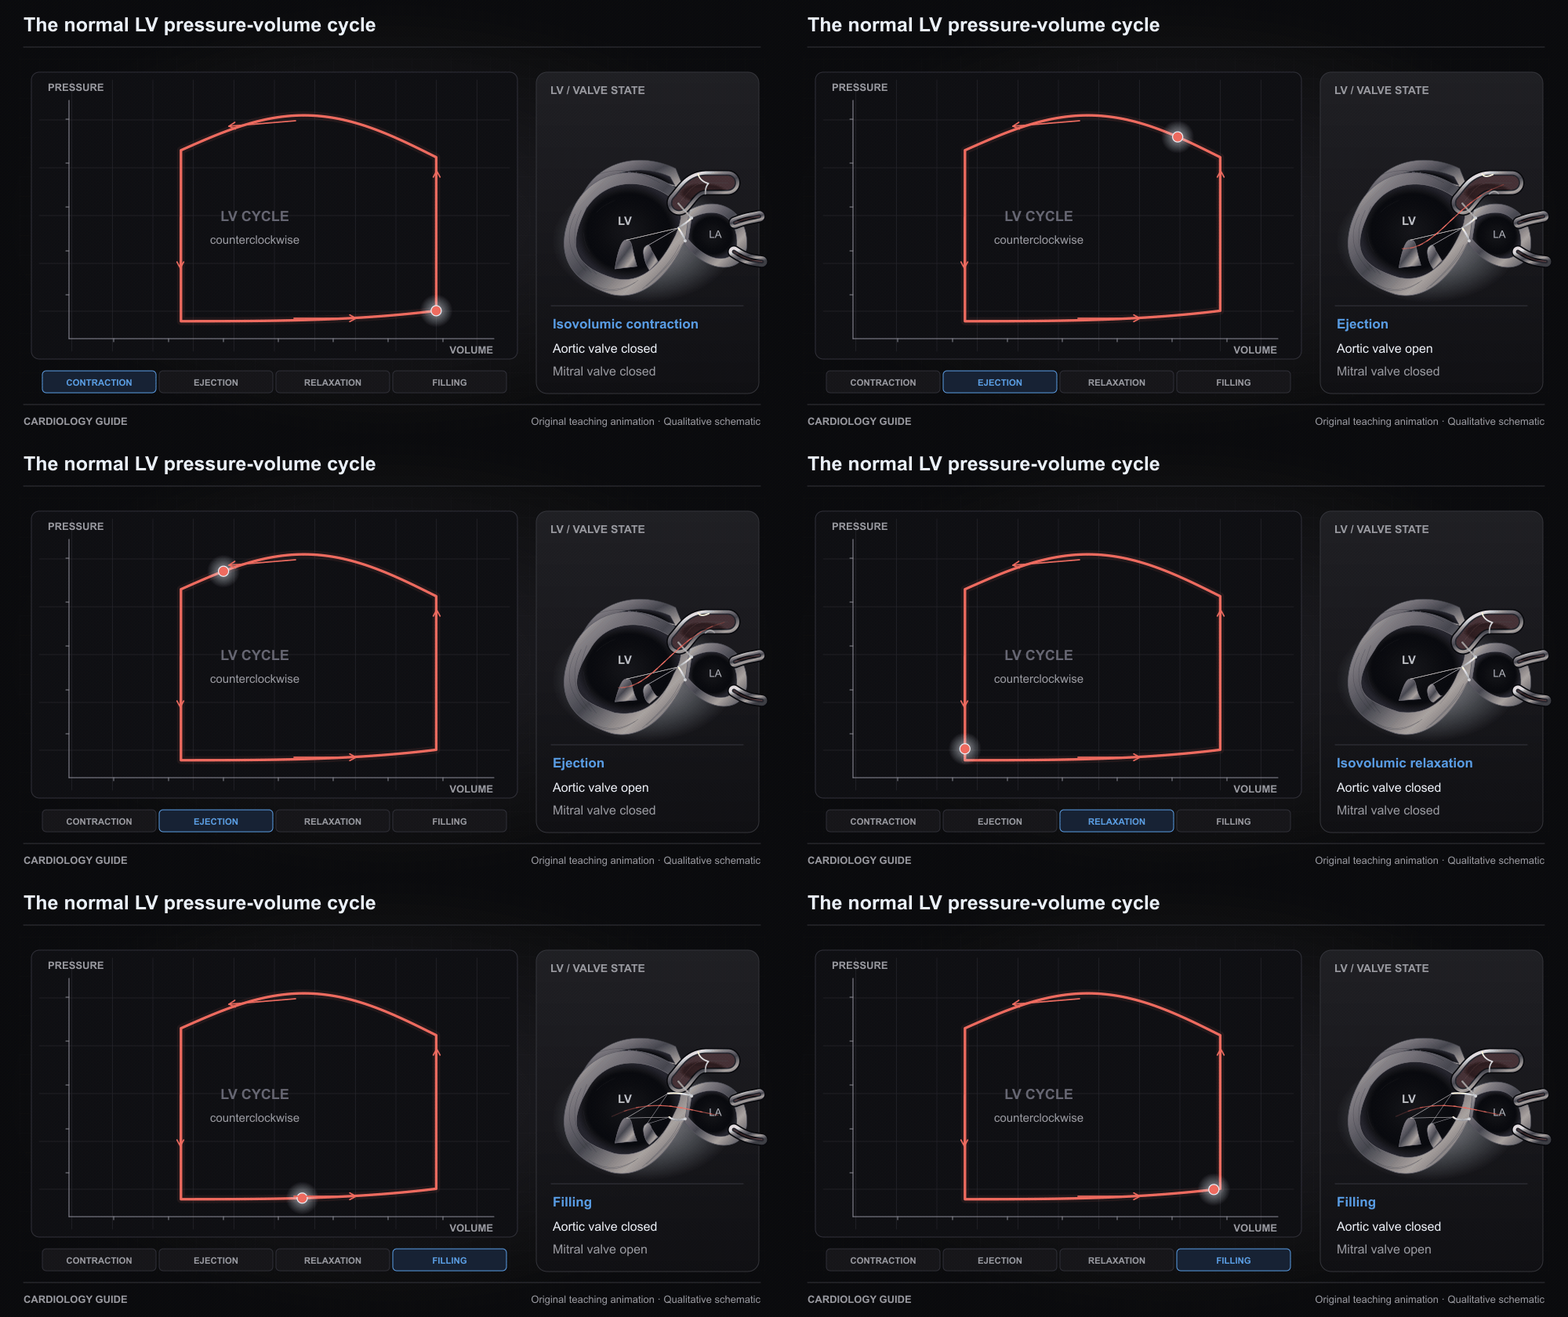
The normal LV pressure-volume cycle
A counterclockwise LV pressure-volume loop links isovolumic contraction, ejection, relaxation and filling with the valve state. Cursor timing and axes are qualitative.
Original qualitative teaching schematic. Motion, particles and traces are illustrative. Timing and geometry are simplified.
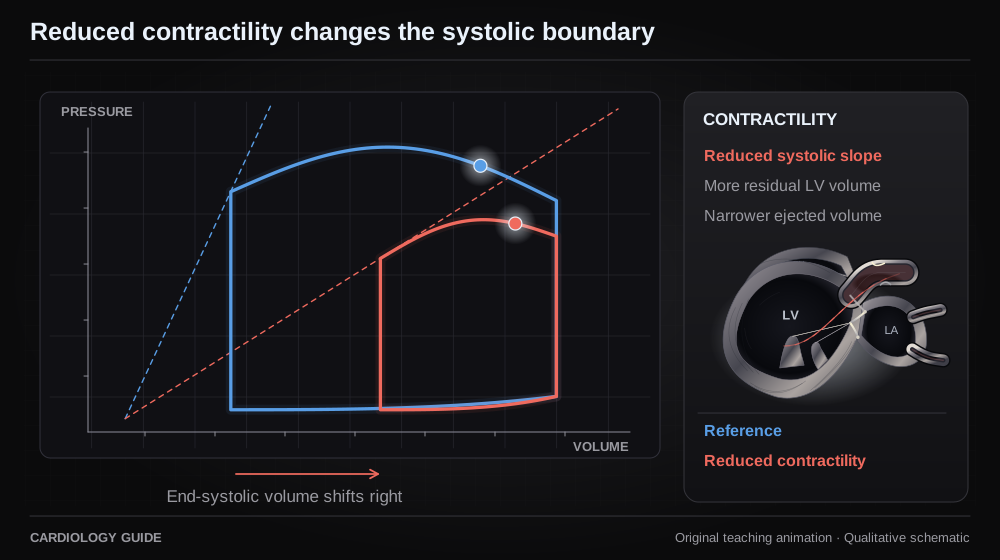
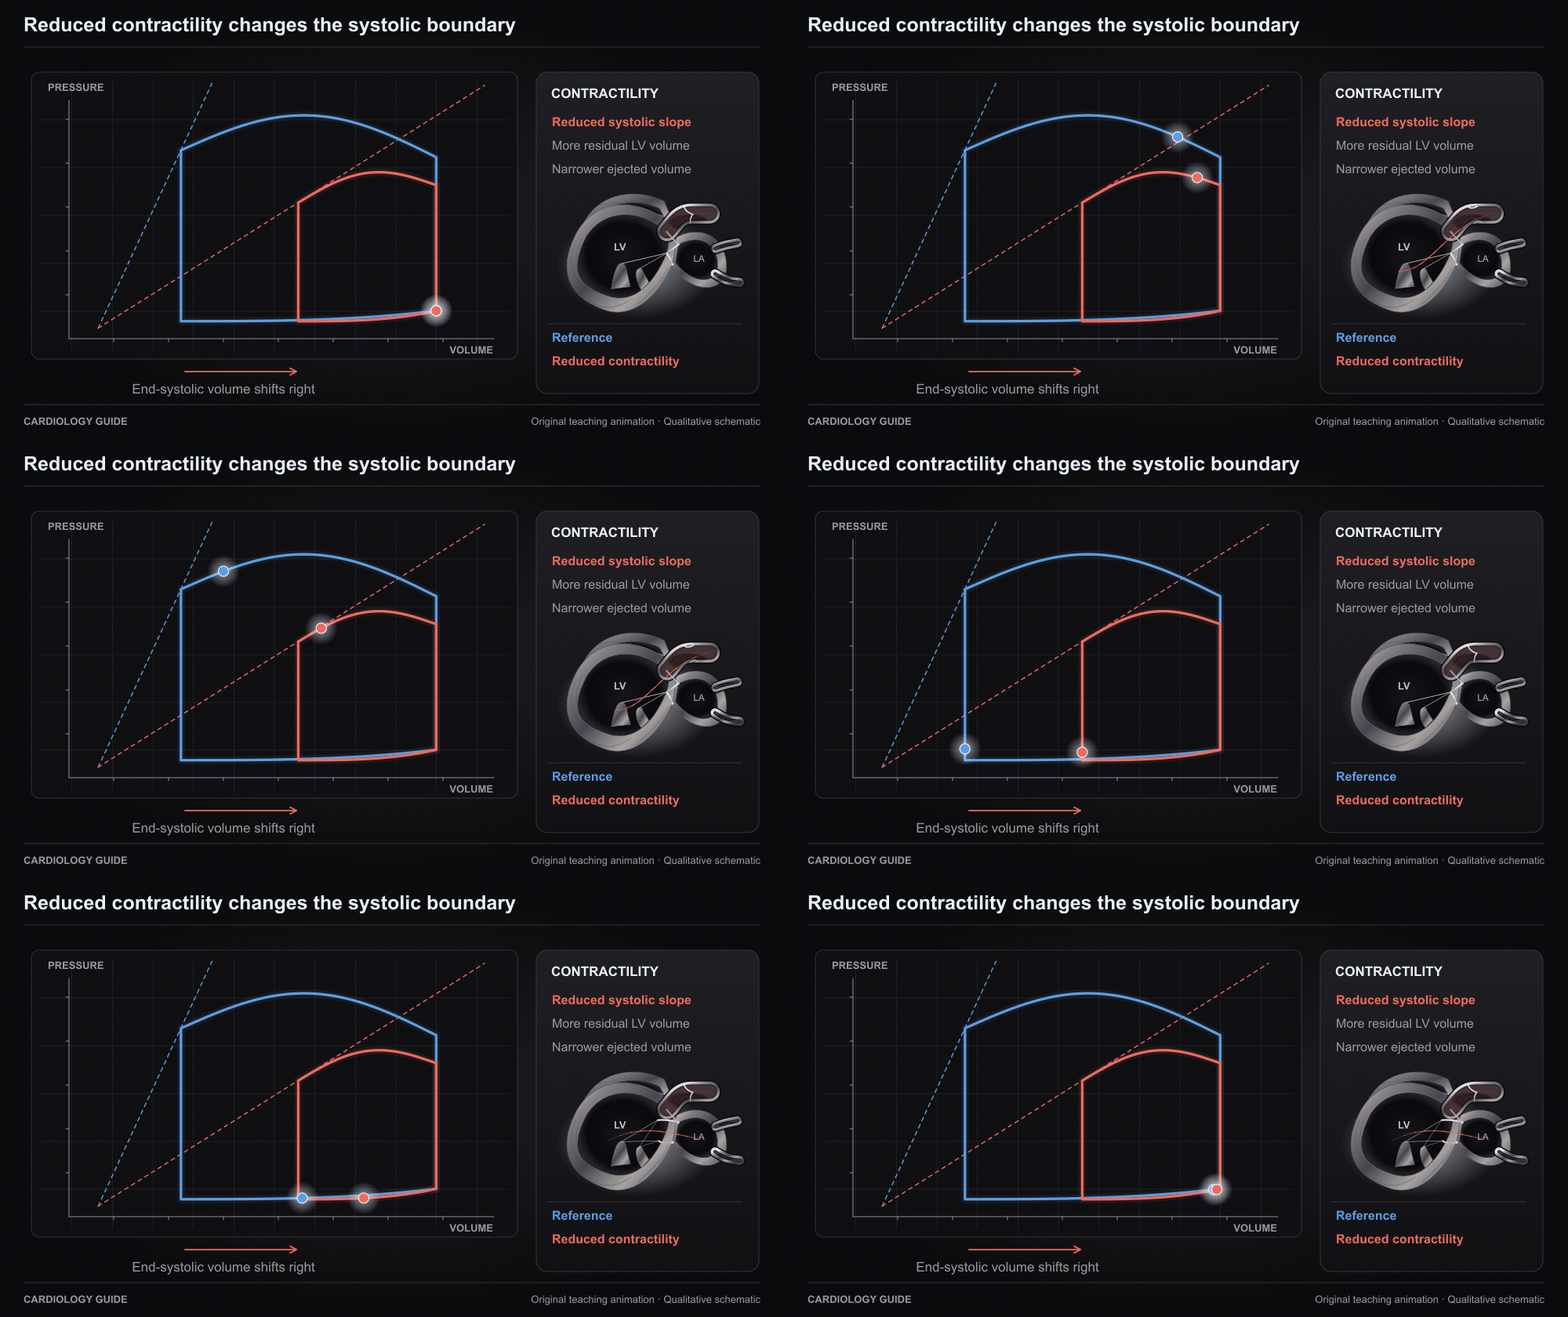
Reduced contractility changes the systolic boundary
At comparable loading, a flatter systolic pressure-volume relation leaves more end-systolic volume and a narrower loop. The comparison illustrates mechanics rather than a numerical simulation.
Original qualitative teaching schematic. Motion, particles and traces are illustrative. Timing and geometry are simplified.
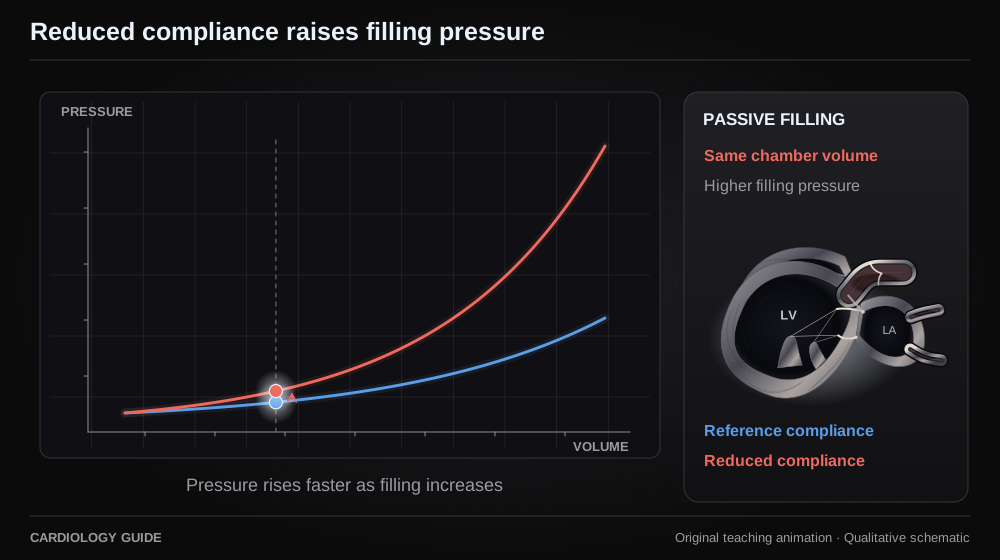
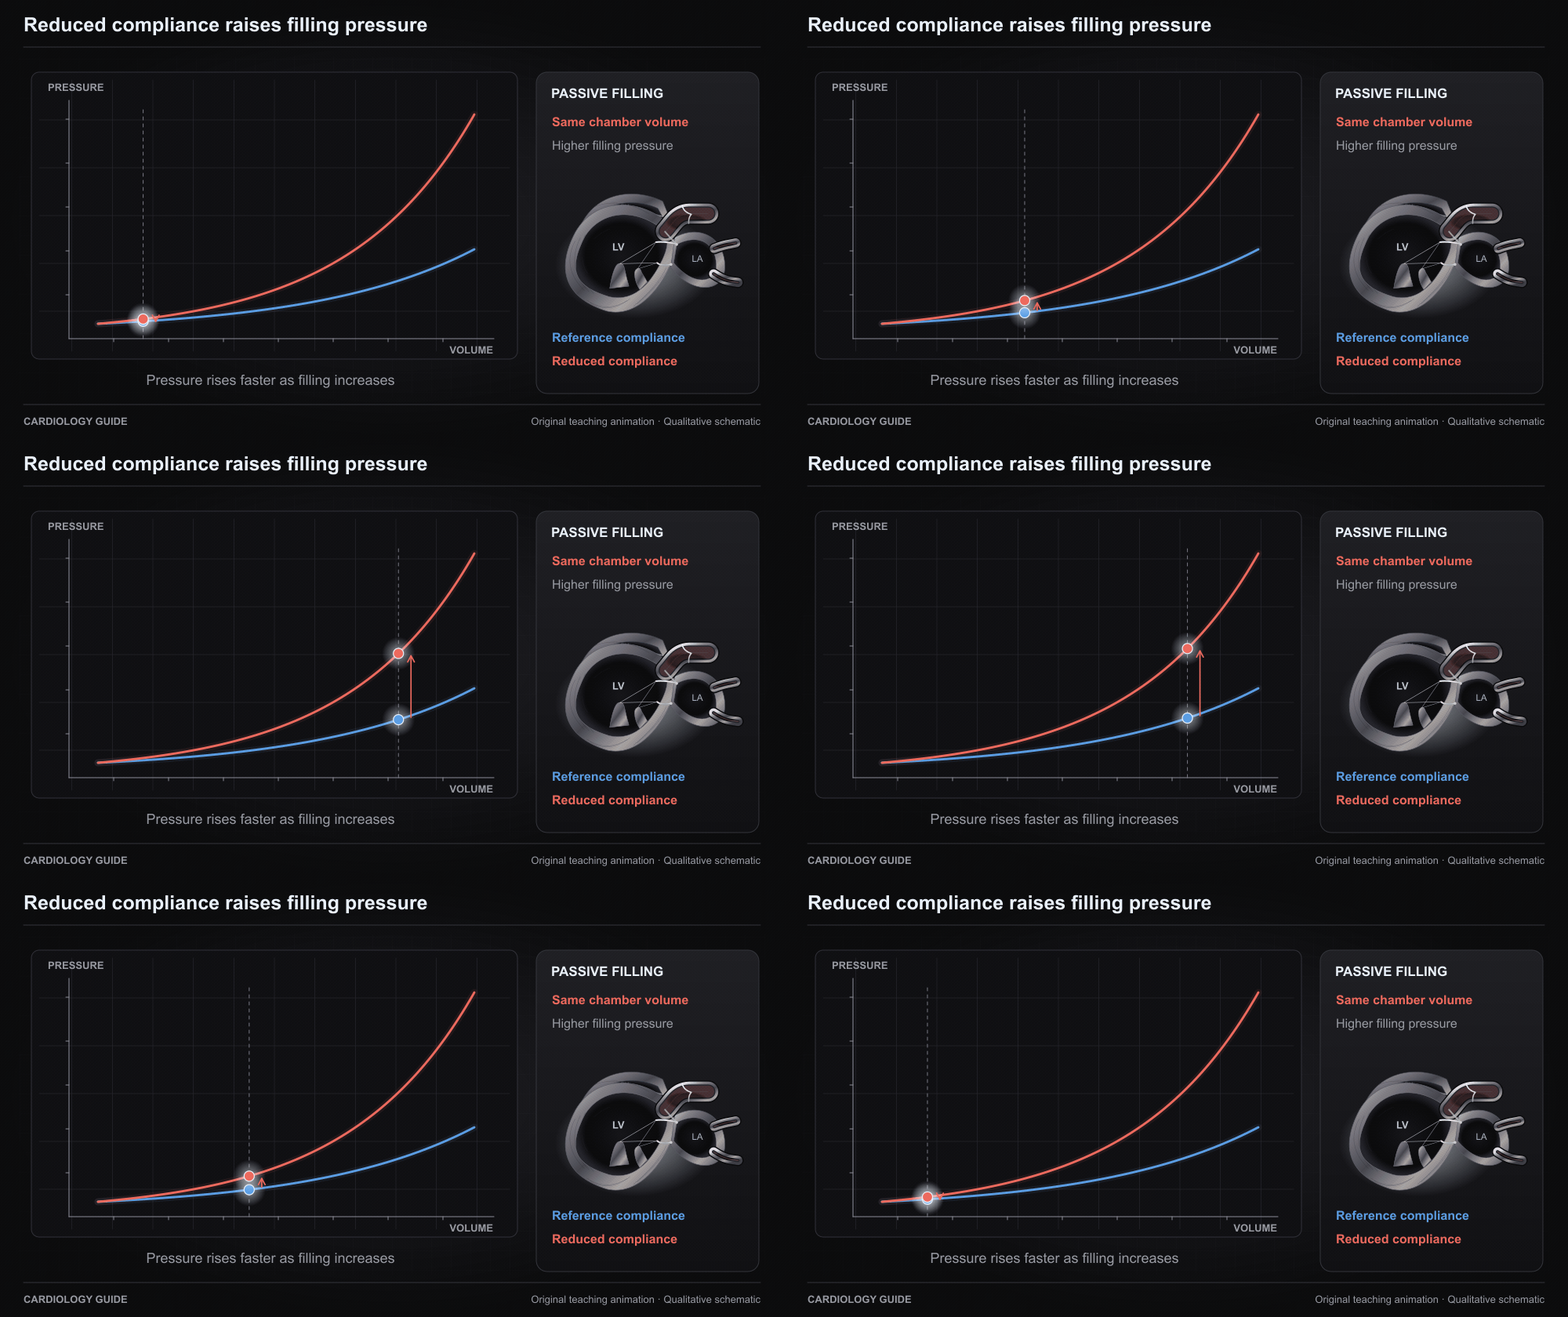
Reduced compliance raises filling pressure
The same filling volume lies at a higher pressure on a steeper passive diastolic pressure-volume relation. Chamber compliance and active relaxation are distinct concepts.
Original qualitative teaching schematic. Motion, particles and traces are illustrative. Timing and geometry are simplified.
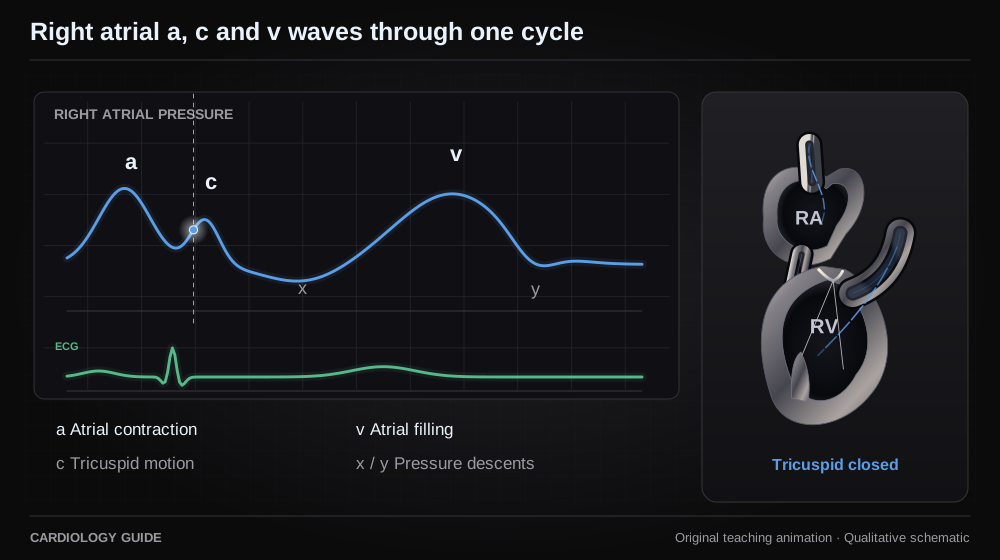
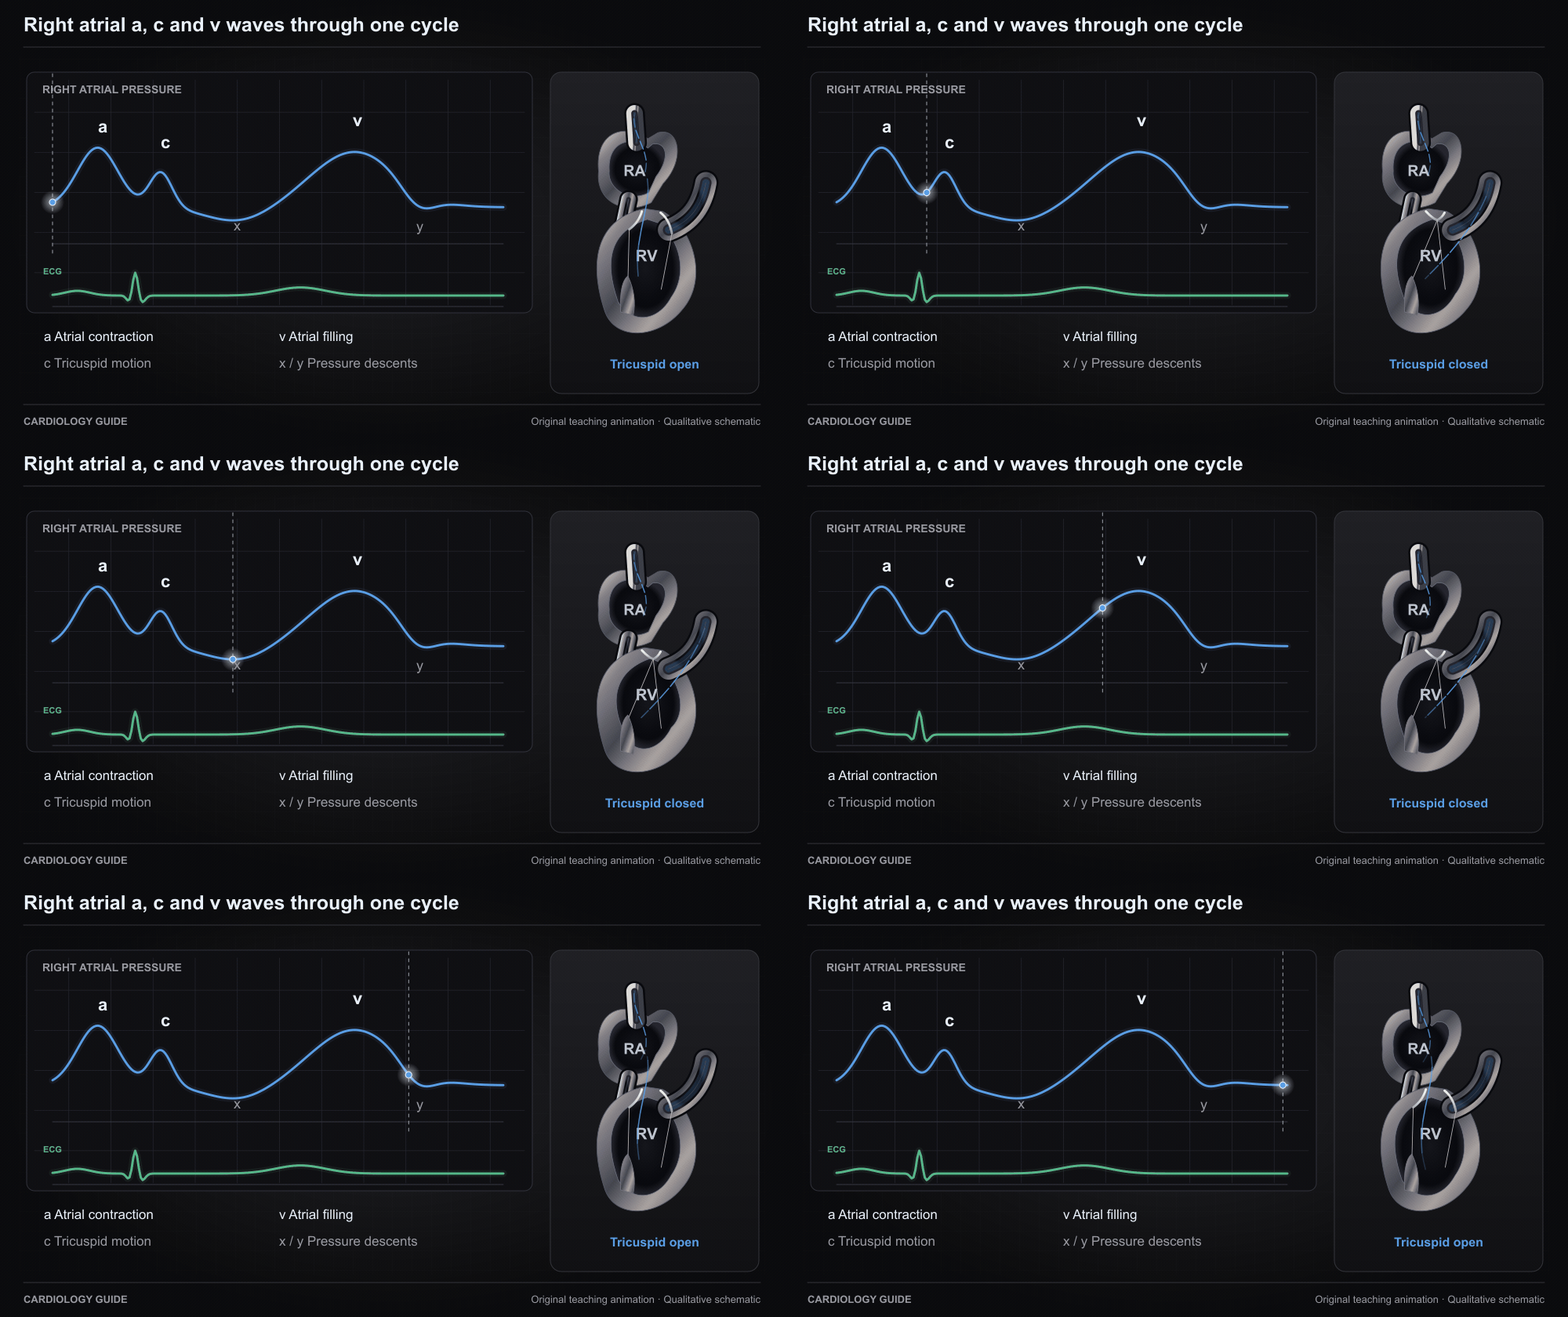
Right atrial a, c and v waves through one cycle
A synchronized right atrial waveform shows atrial contraction, early systolic tricuspid motion, atrial filling, and the x and y descents. The teaching tracing is uncalibrated.
Original qualitative teaching schematic. Motion, particles and traces are illustrative. Timing and geometry are simplified.
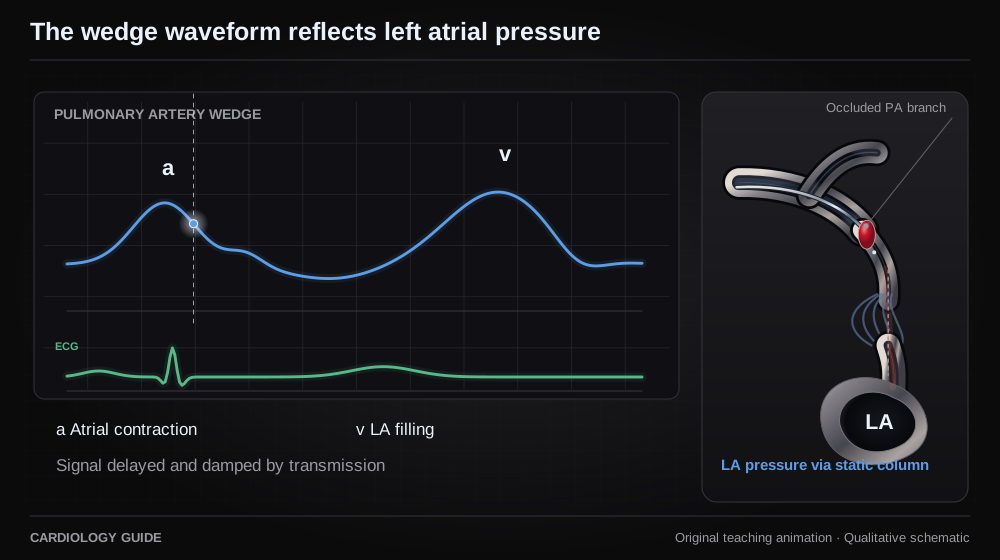
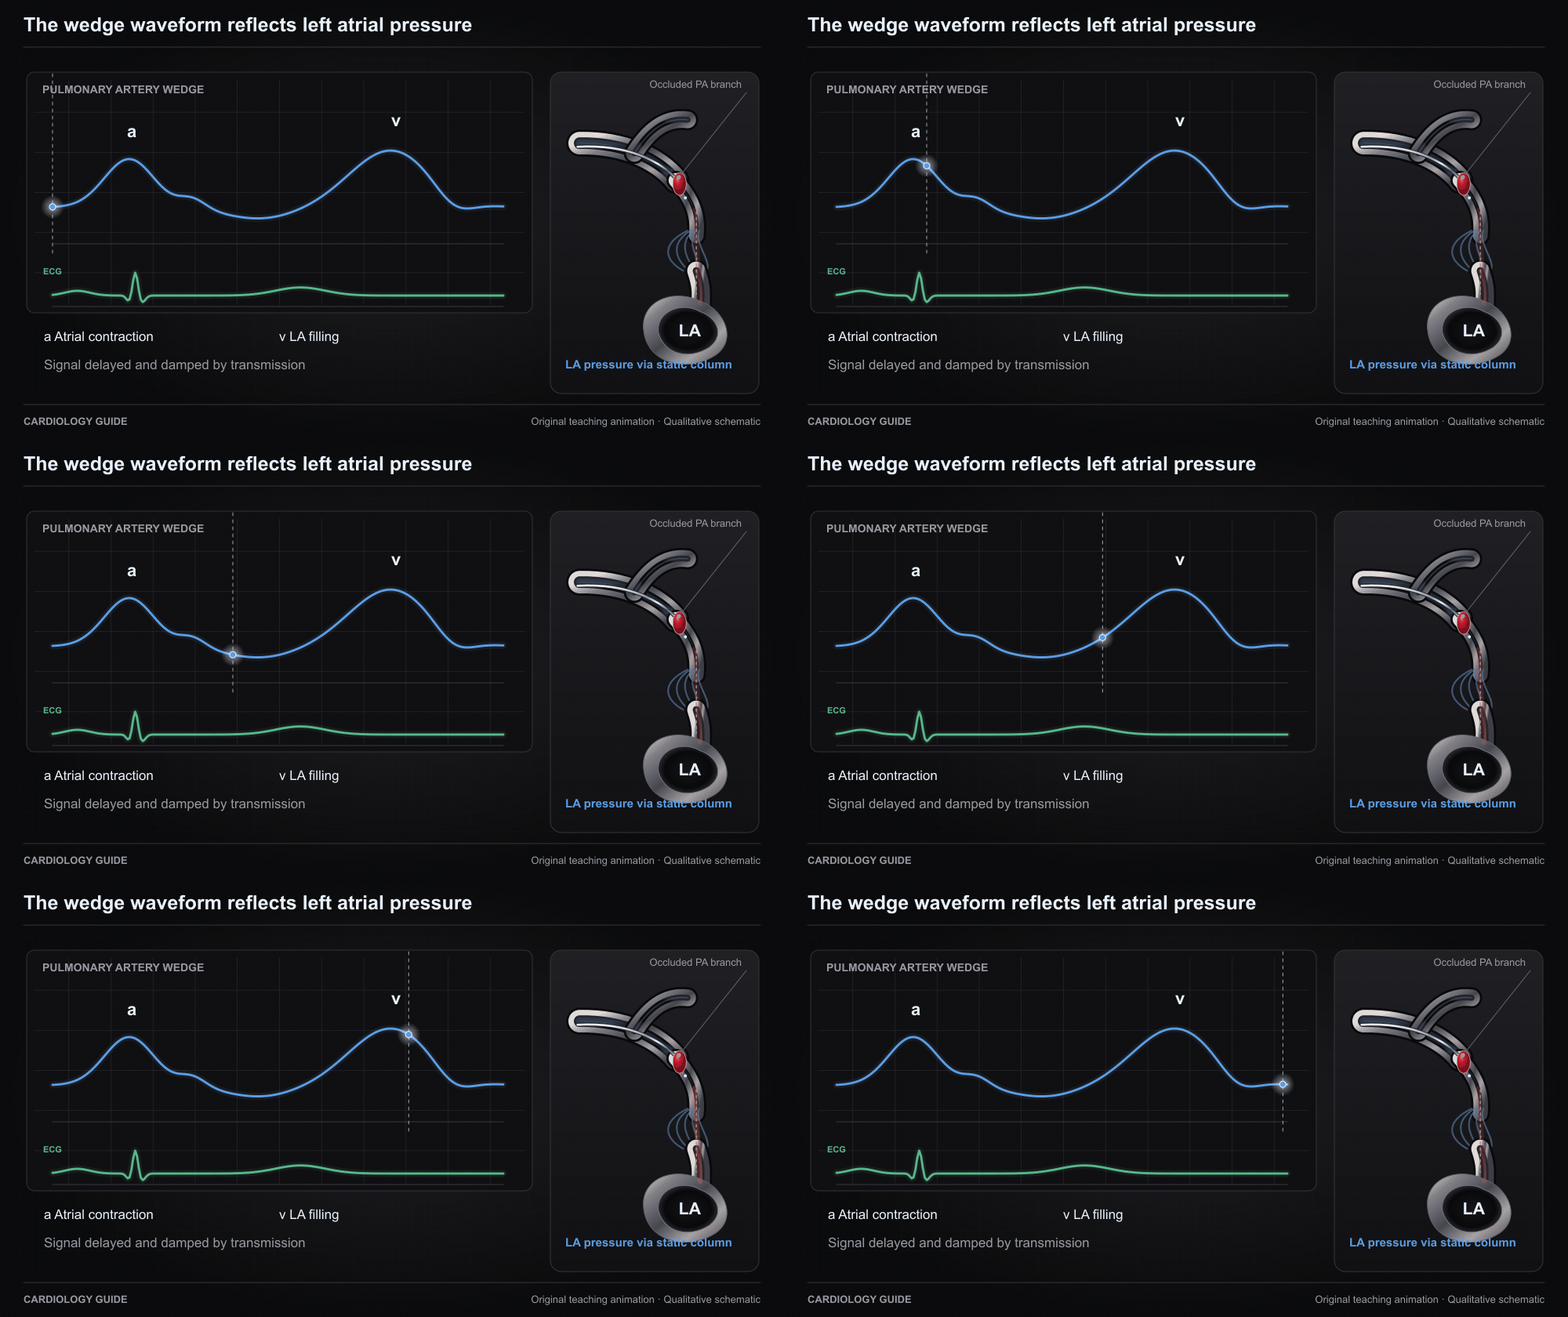
The wedge waveform reflects left atrial pressure
A damped, delayed left atrial pressure signal reaches the wedged pulmonary artery catheter through a static column. The a and v waves represent atrial contraction and filling and are not a pulmonary artery systolic waveform.
Original qualitative teaching schematic. Motion, particles and traces are illustrative. Timing and geometry are simplified.
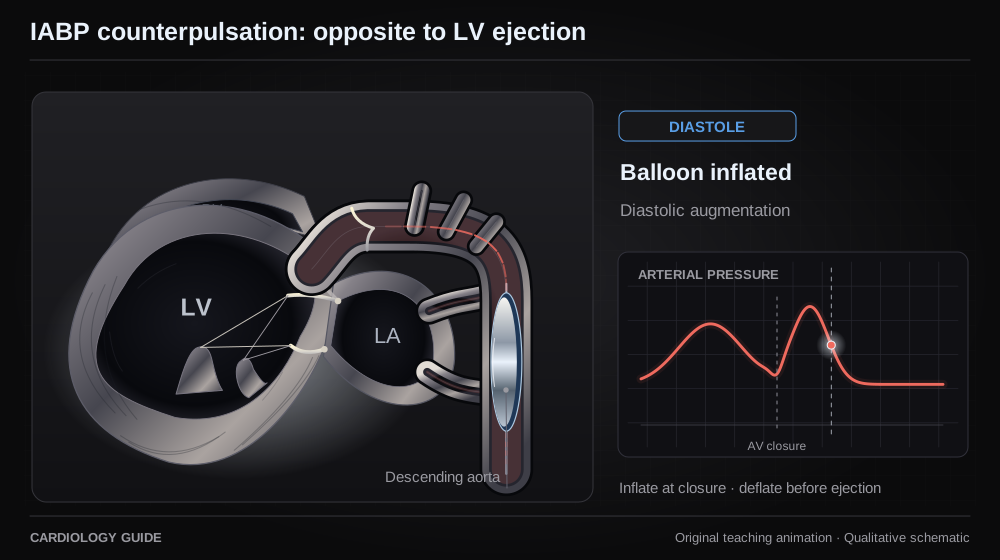
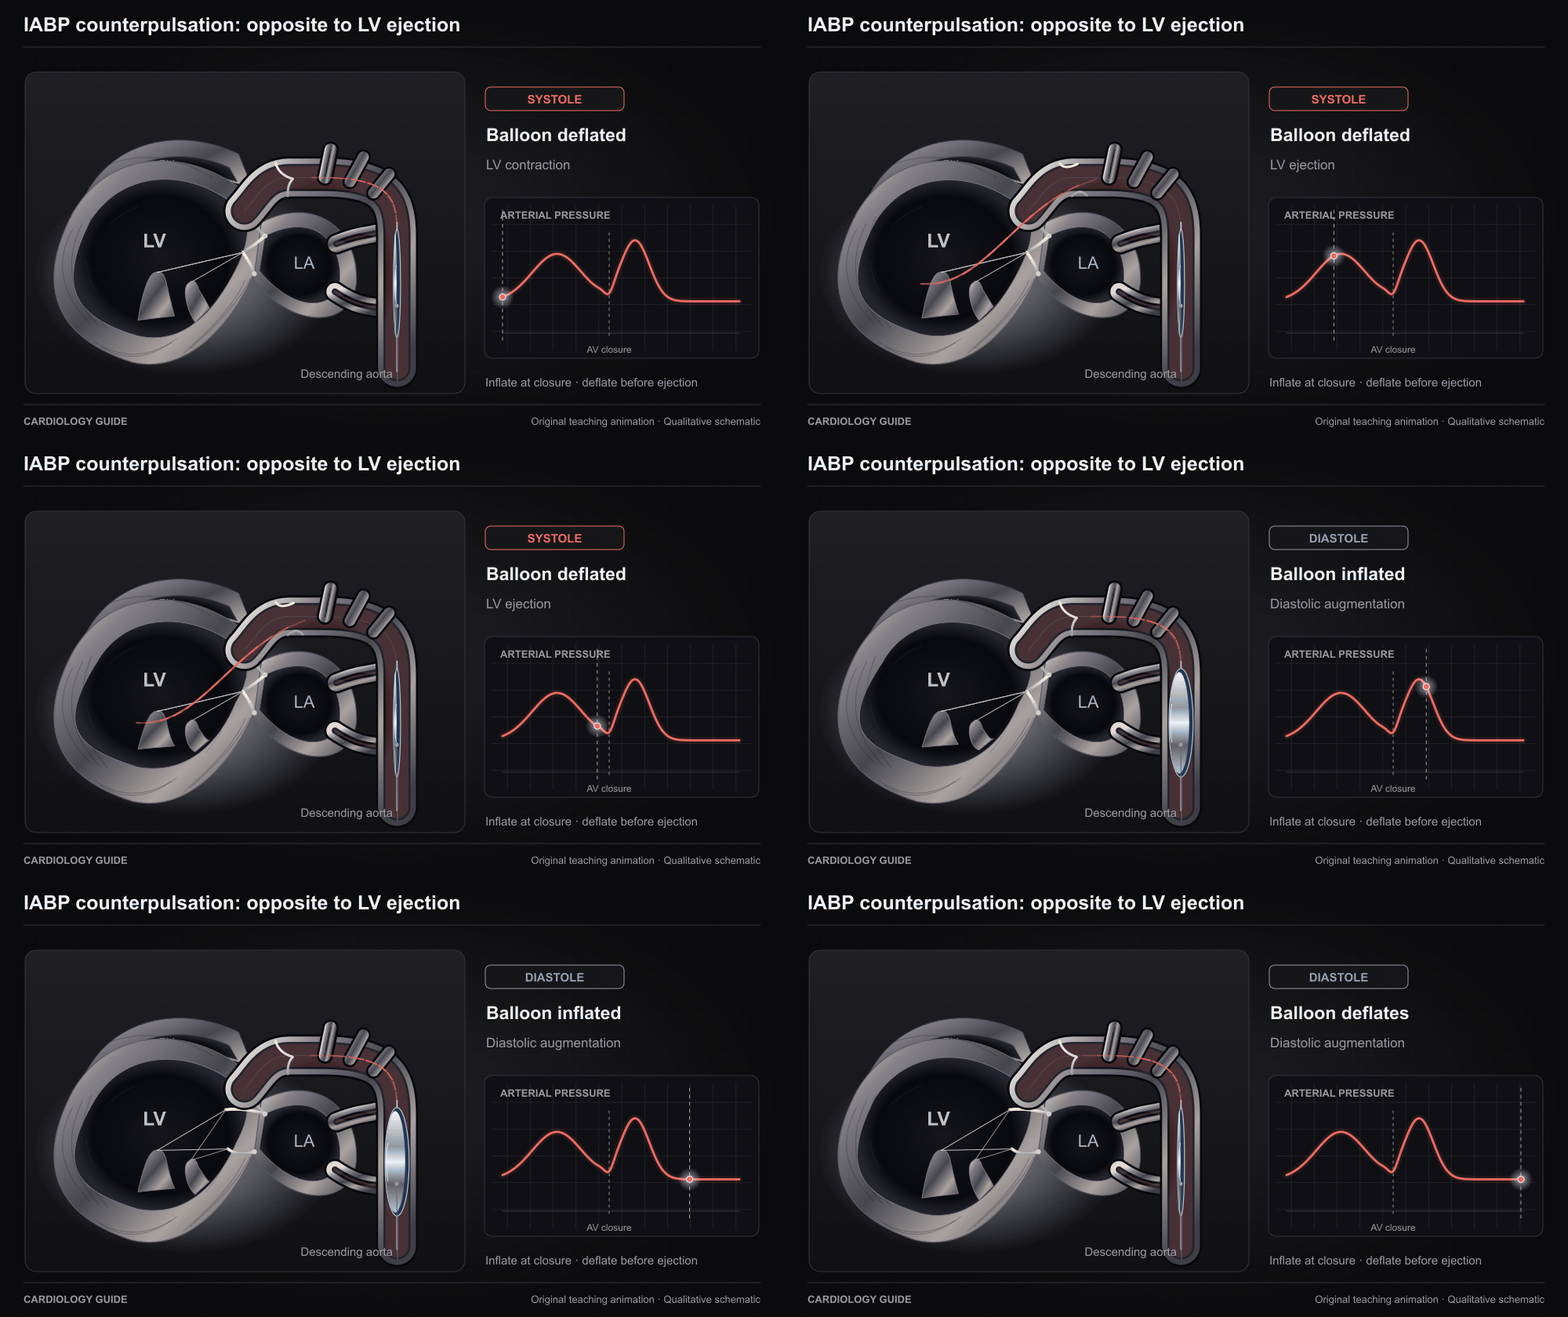
IABP counterpulsation: opposite to LV ejection
The balloon inflates at aortic valve closure in diastole and deflates before the next systolic ejection. Balloon motion, aortic valve state and the illustrative arterial tracing share a qualitative time base.
Original qualitative teaching schematic. Motion, particles and traces are illustrative. Timing and geometry are simplified.
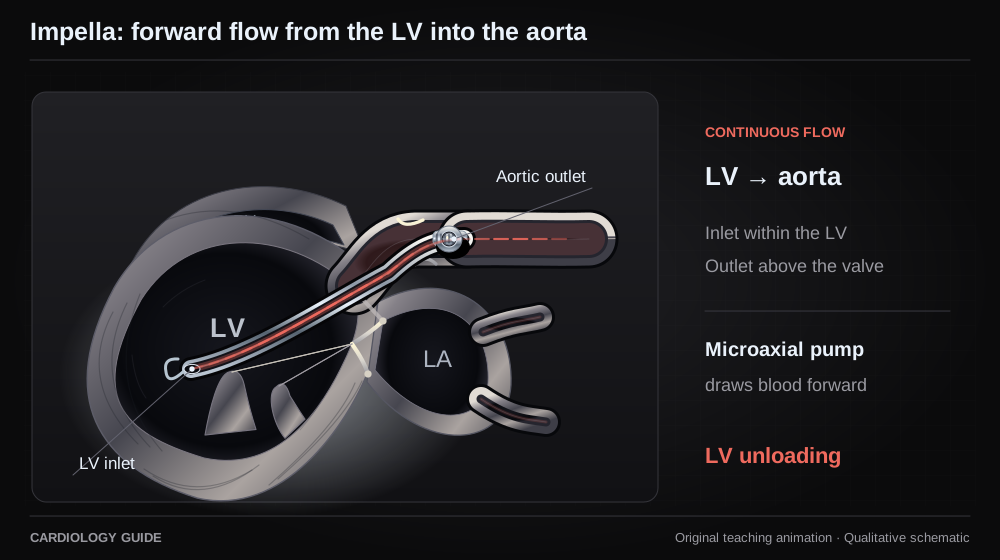
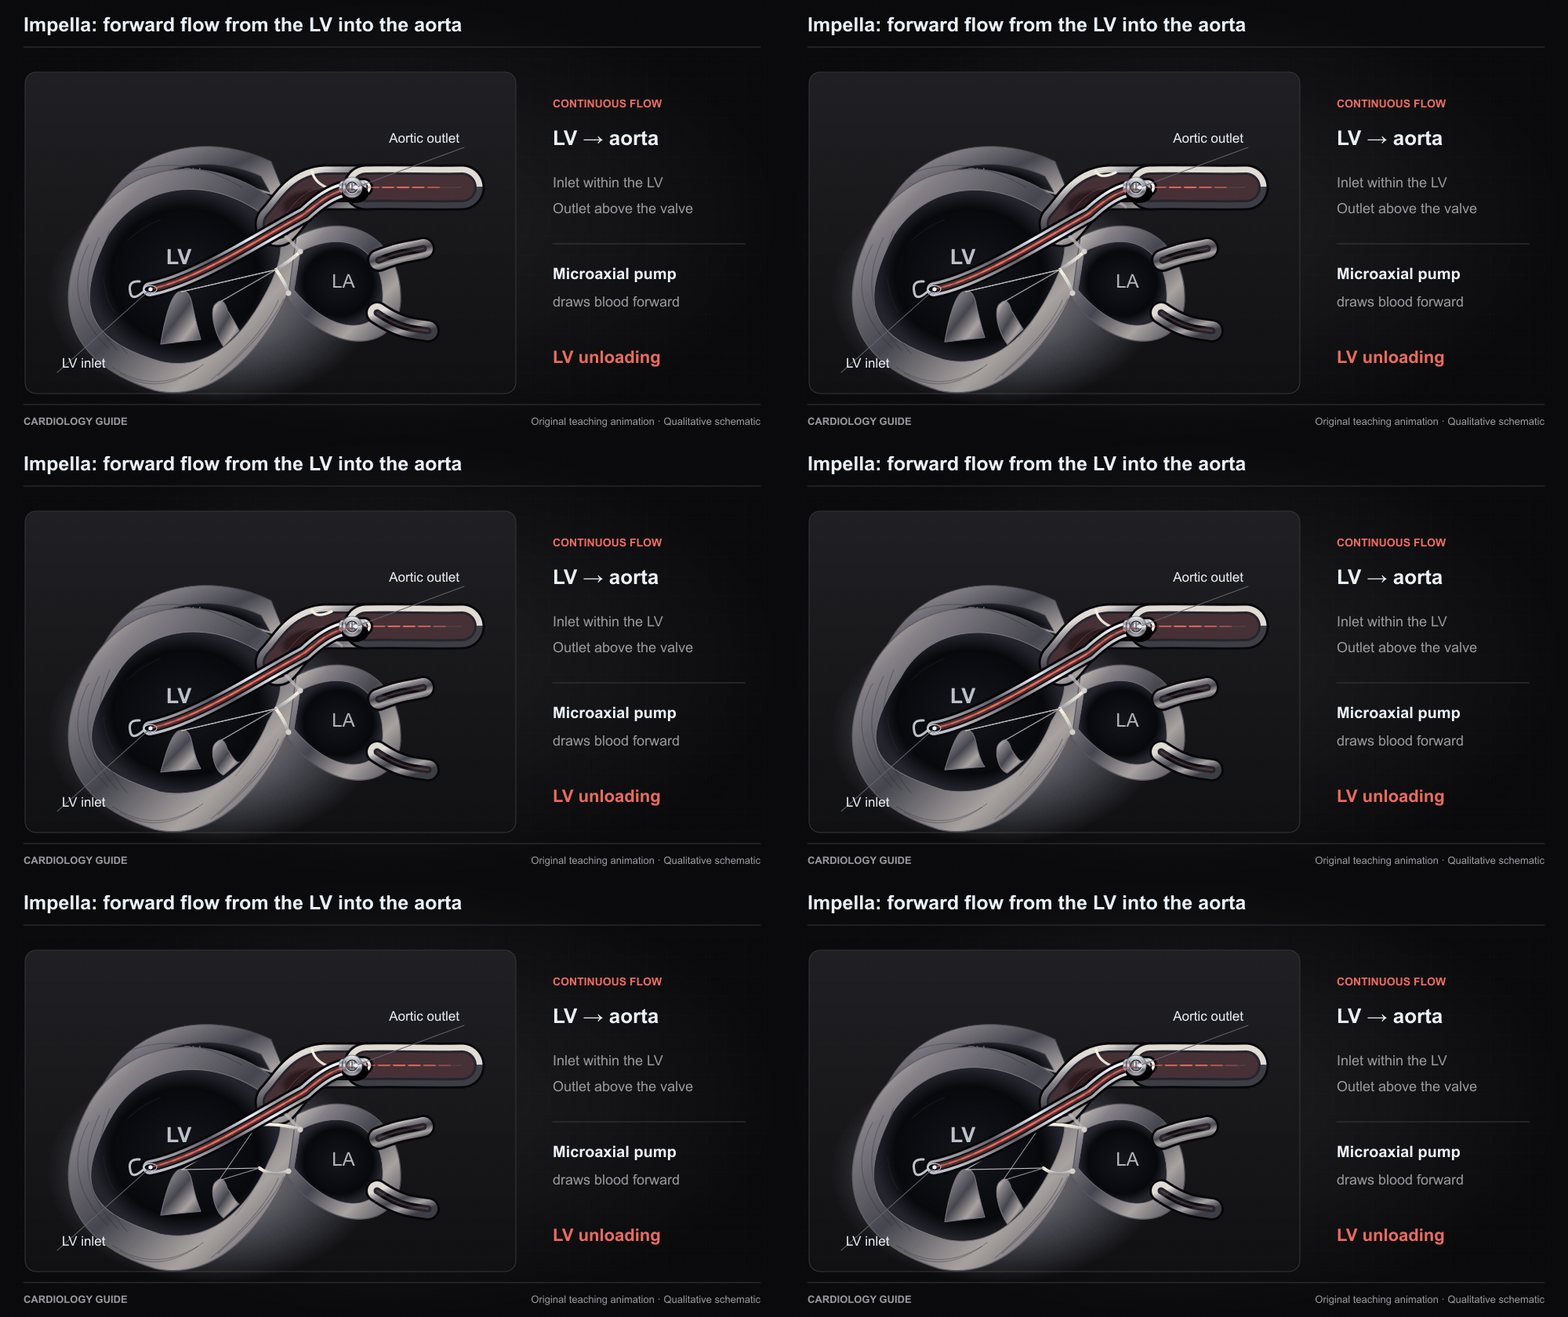
Impella: forward flow from the LV into the aorta
An original microaxial-pump schematic places the inlet inside the LV and outlet above the aortic valve. Particles move continuously forward through the cannula into the aorta, illustrating LV unloading.
Original qualitative teaching schematic. Motion, particles and traces are illustrative. Timing and geometry are simplified.
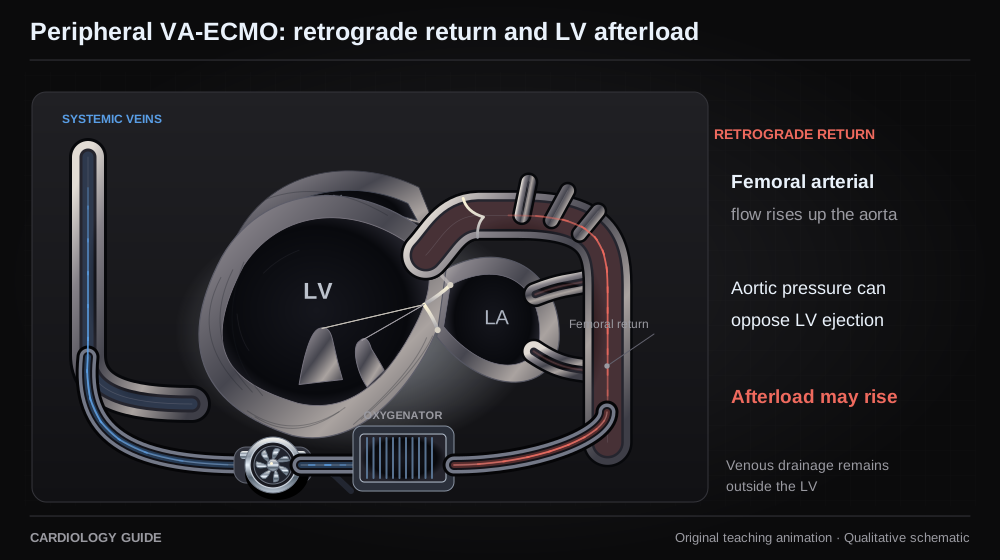
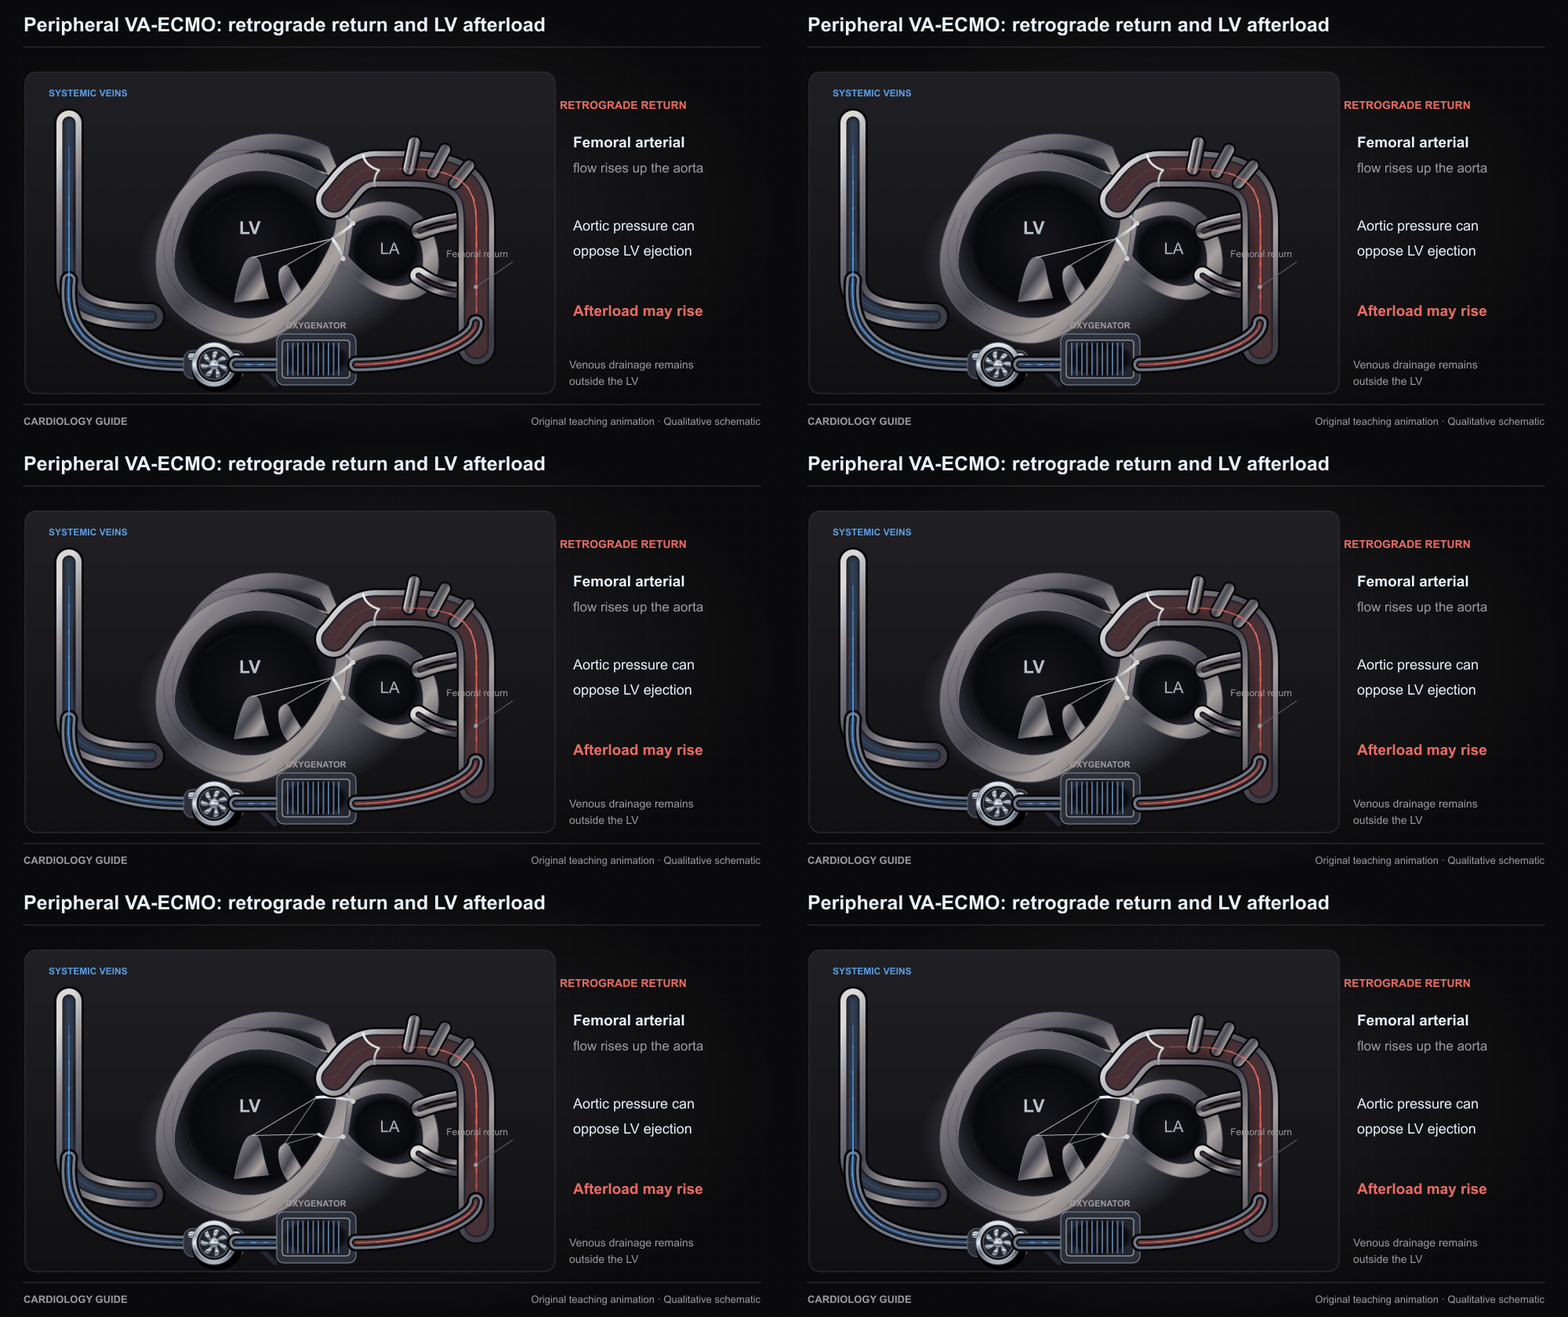
Peripheral VA-ECMO: retrograde return and LV afterload
Femoral VA-ECMO drains systemic venous blood and returns oxygenated blood retrograde through the descending aorta. Aortic pressure can oppose a poorly contractile LV, increasing afterload and impairing ejection.
Original qualitative teaching schematic. Motion, particles and traces are illustrative. Timing and geometry are simplified.
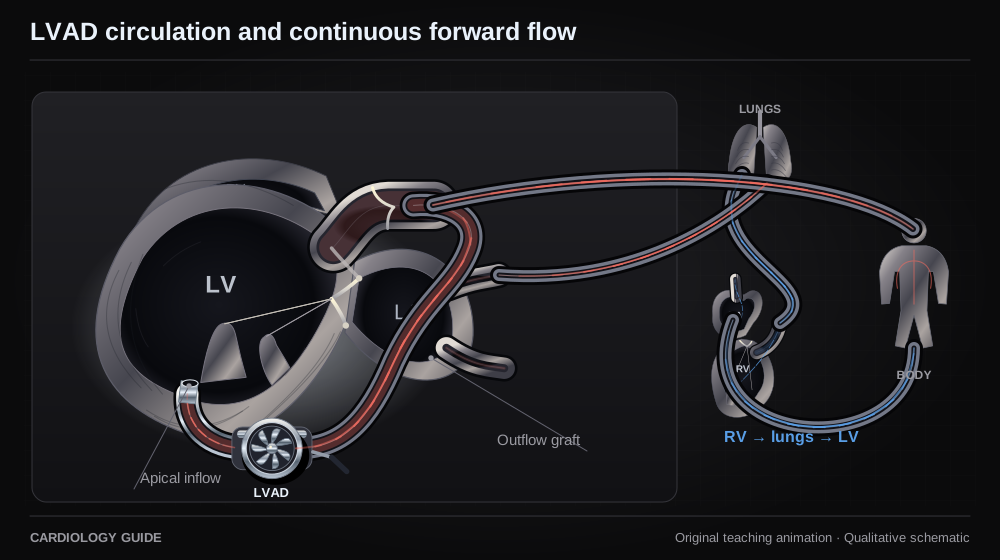
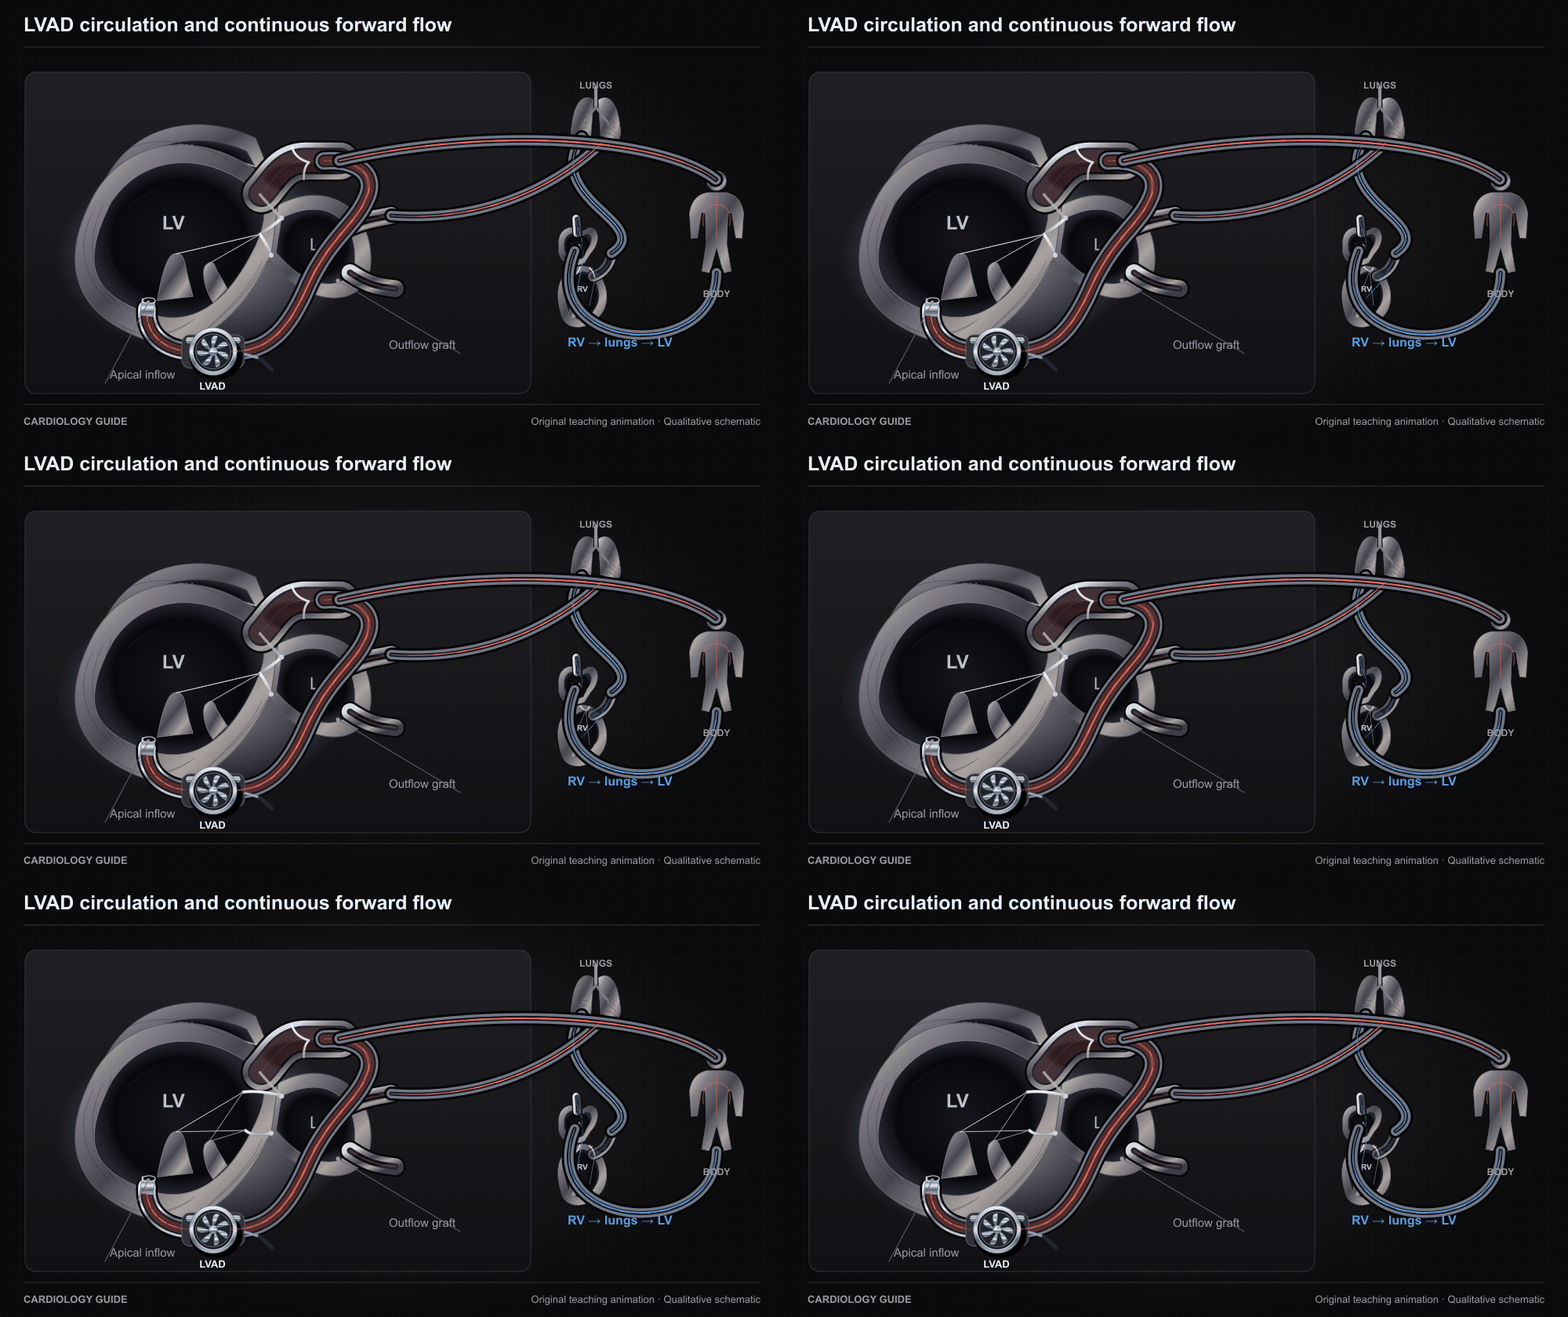
LVAD circulation and continuous forward flow
The RV and pulmonary circulation continue to supply the left heart. An apical inflow cannula sends LV blood through the assist pump and outflow graft to the aorta and systemic circulation.
Original qualitative teaching schematic. Motion, particles and traces are illustrative. Timing and geometry are simplified.
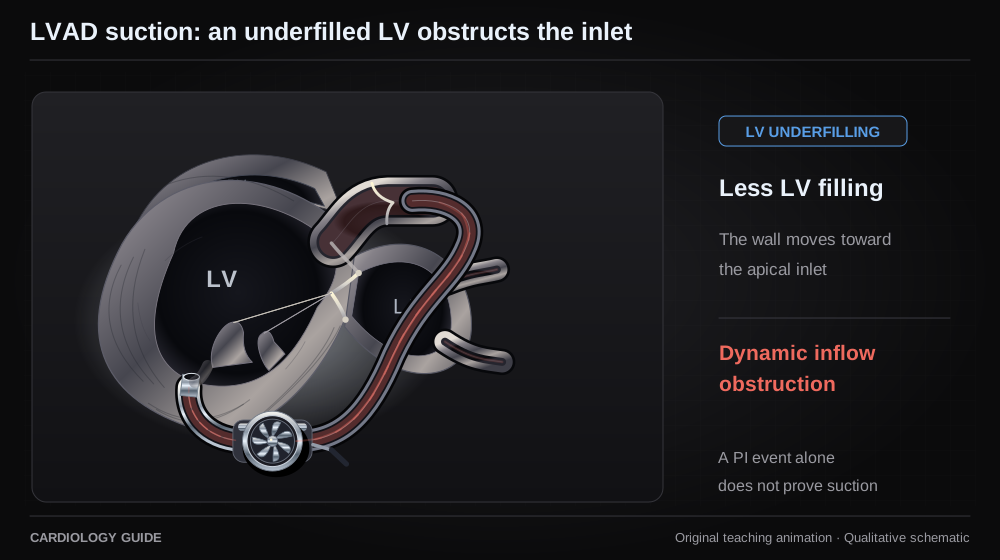
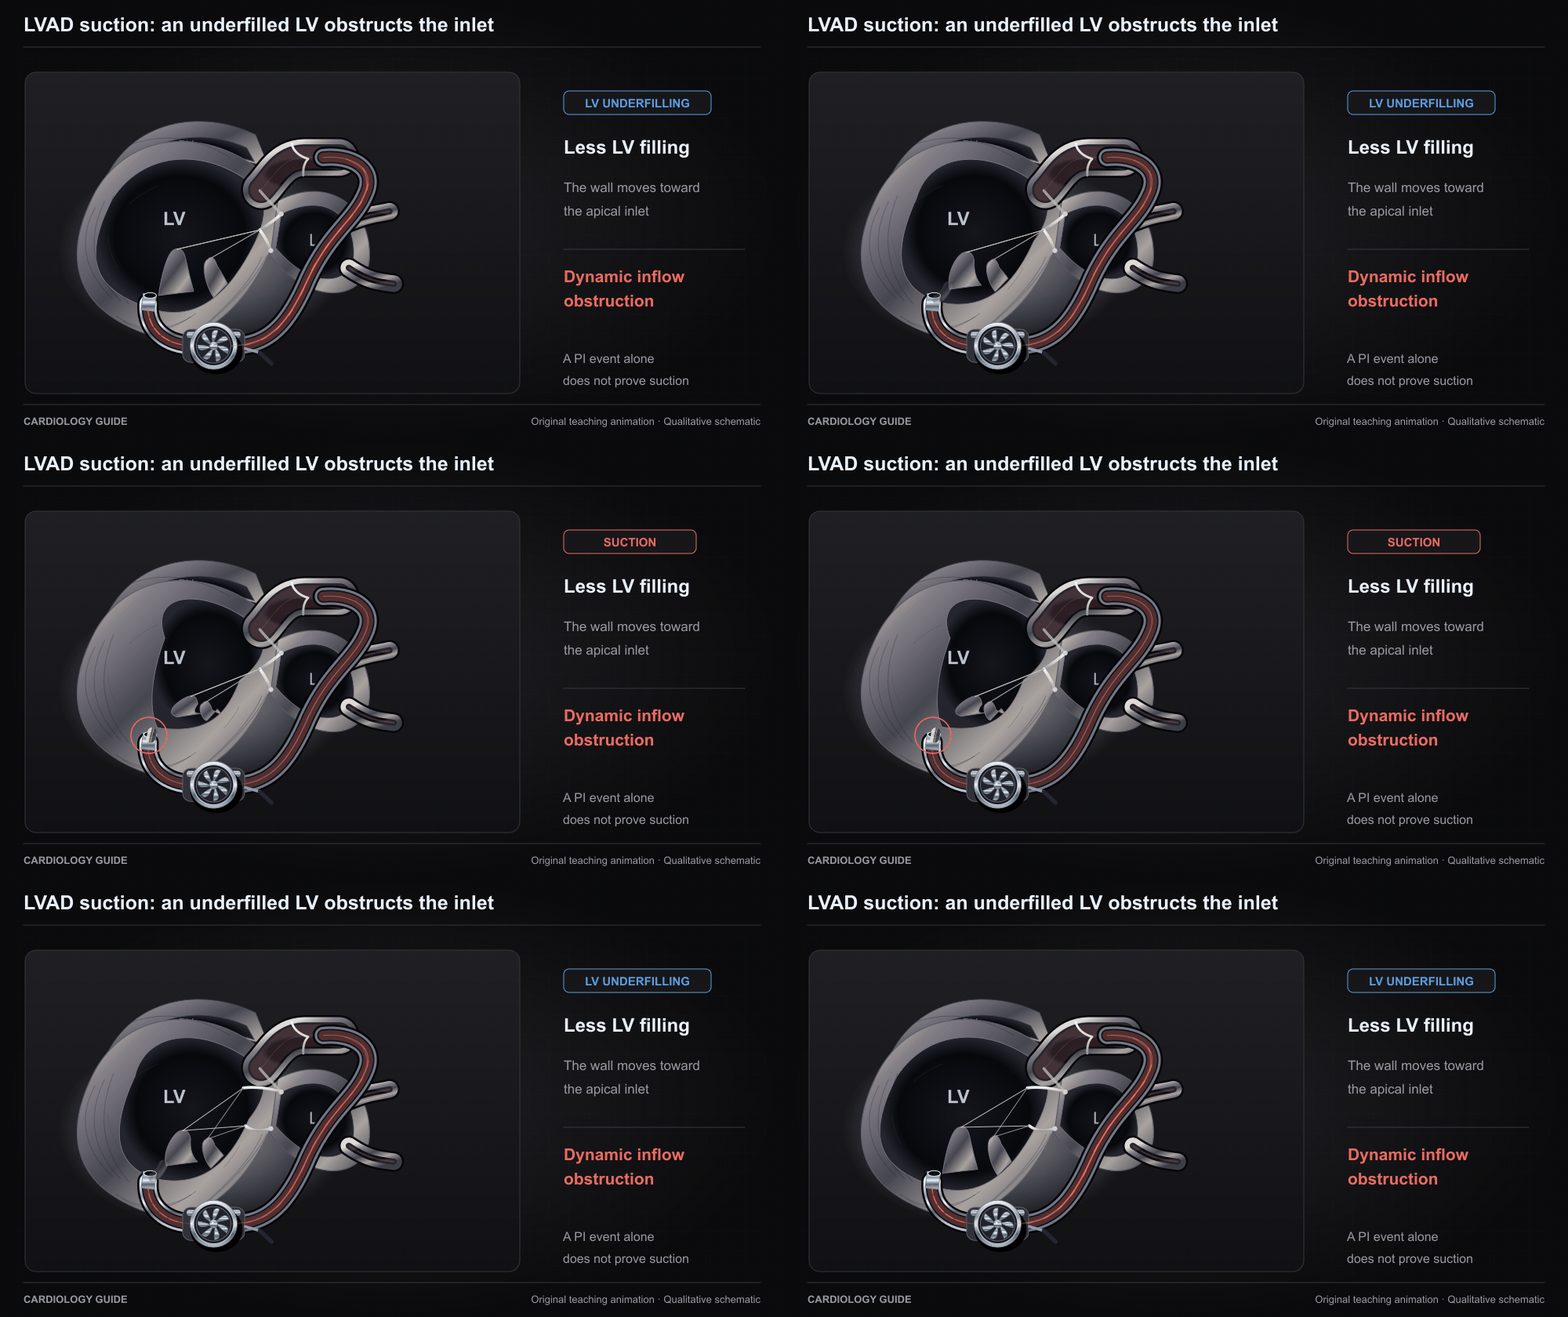
LVAD suction: an underfilled LV obstructs the inlet
As LV filling falls, a wall can approach the apical inflow cannula and dynamically obstruct flow. This qualitative example illustrates true suction. A controller PI event alone does not establish suction.
Original qualitative teaching schematic. Motion, particles and traces are illustrative. Timing and geometry are simplified.
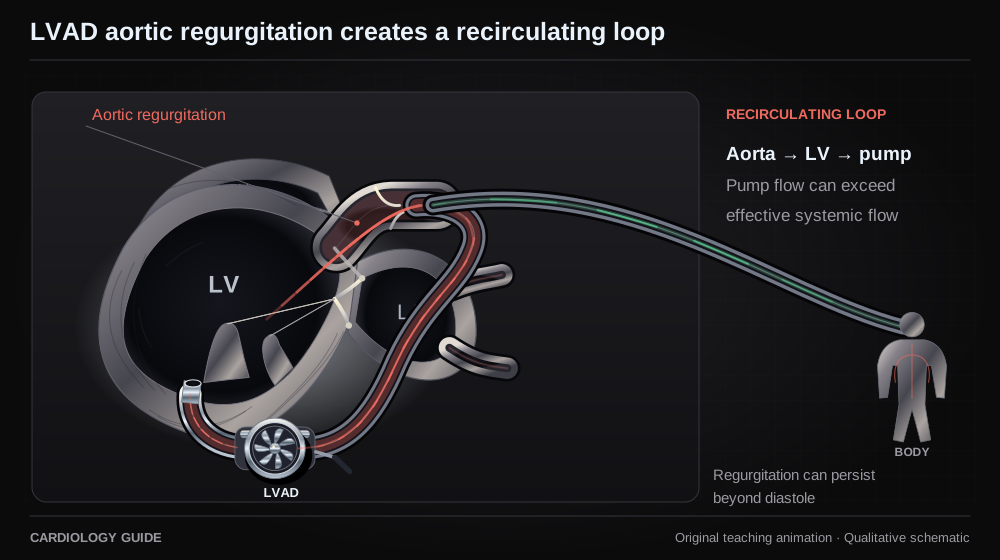
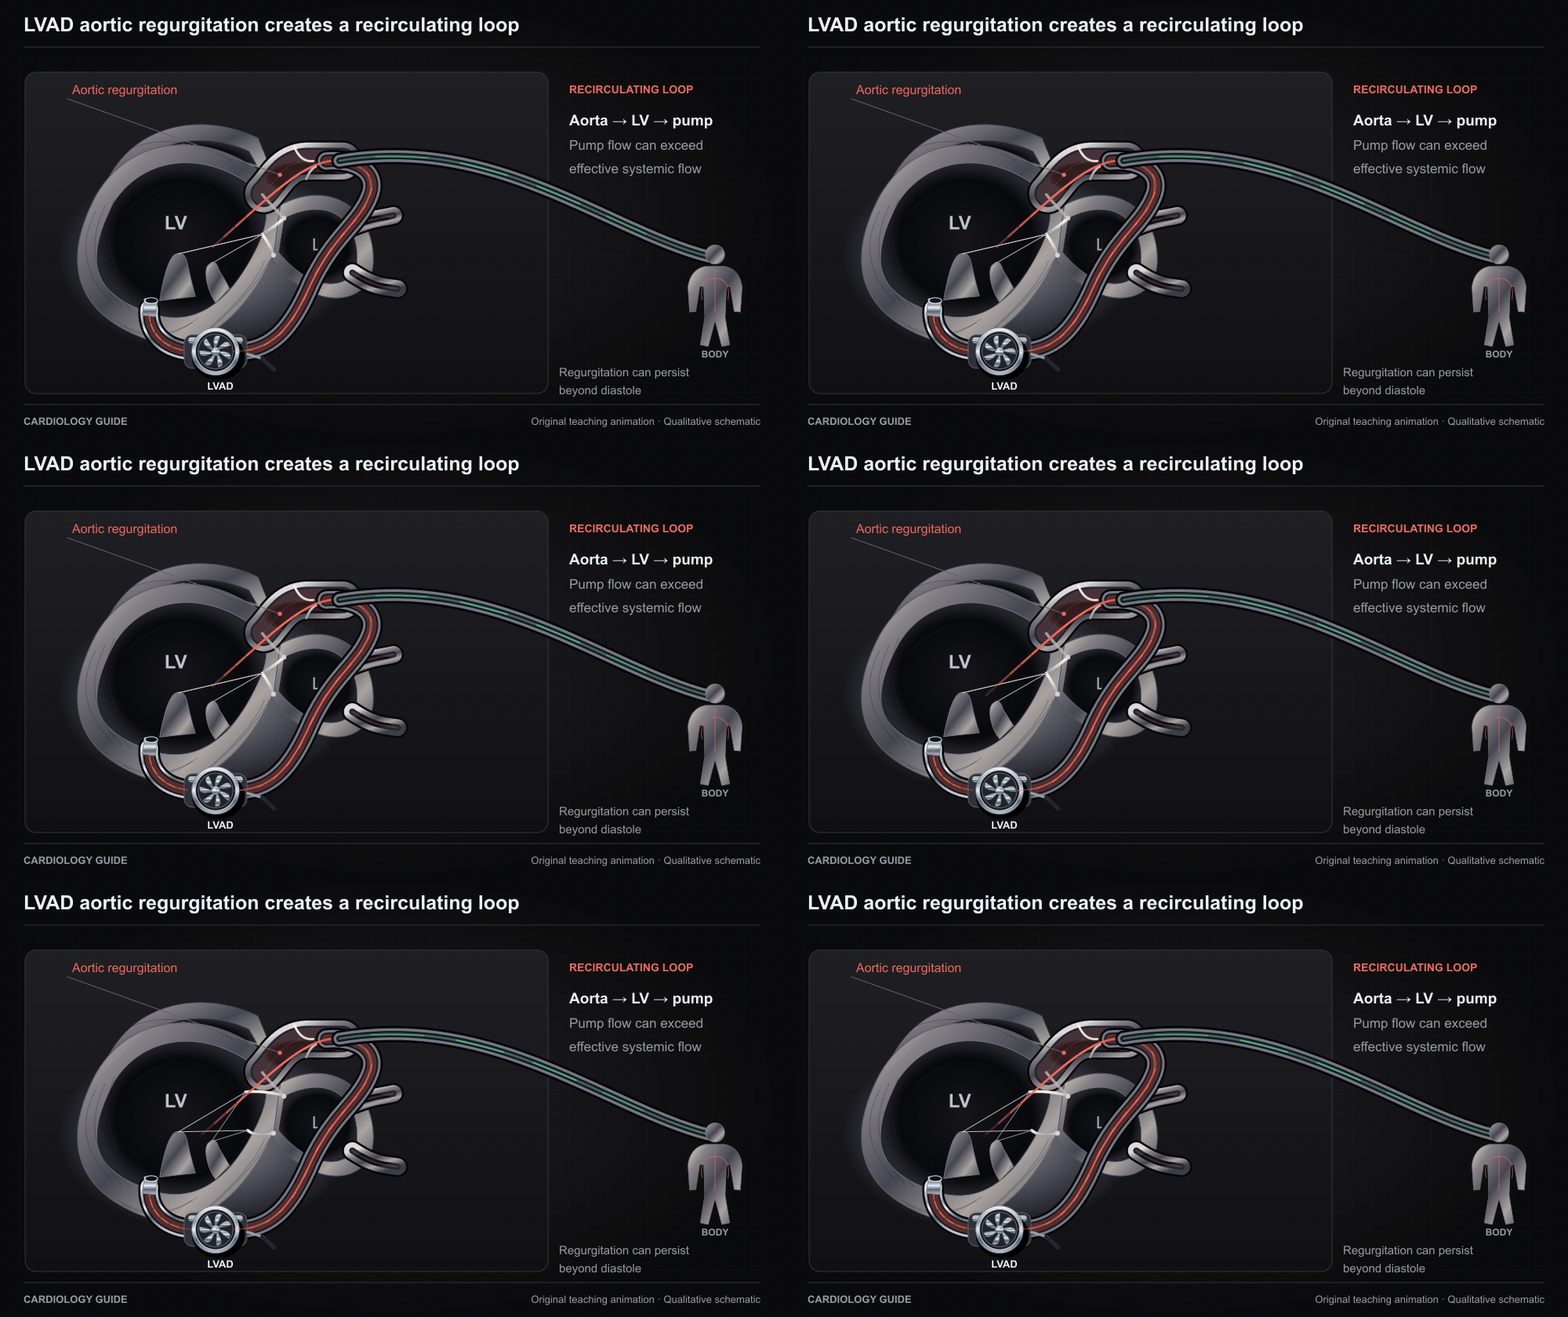
LVAD aortic regurgitation creates a recirculating loop
Part of LVAD output can return through an incompetent aortic valve into the LV and be pumped again. Pump flow and net systemic output can diverge. Regurgitation during LVAD support can extend beyond diastole.
Original qualitative teaching schematic. Motion, particles and traces are illustrative. Timing and geometry are simplified.
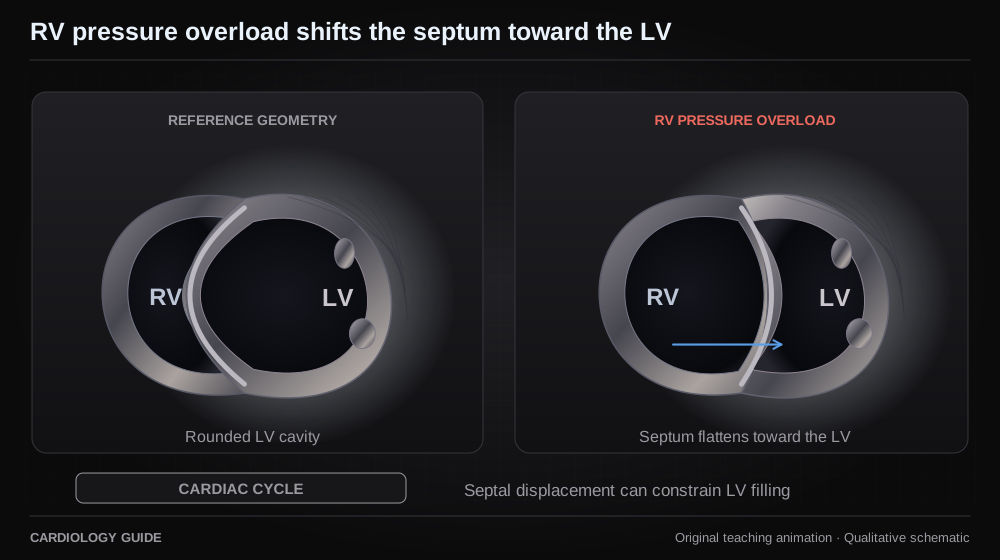
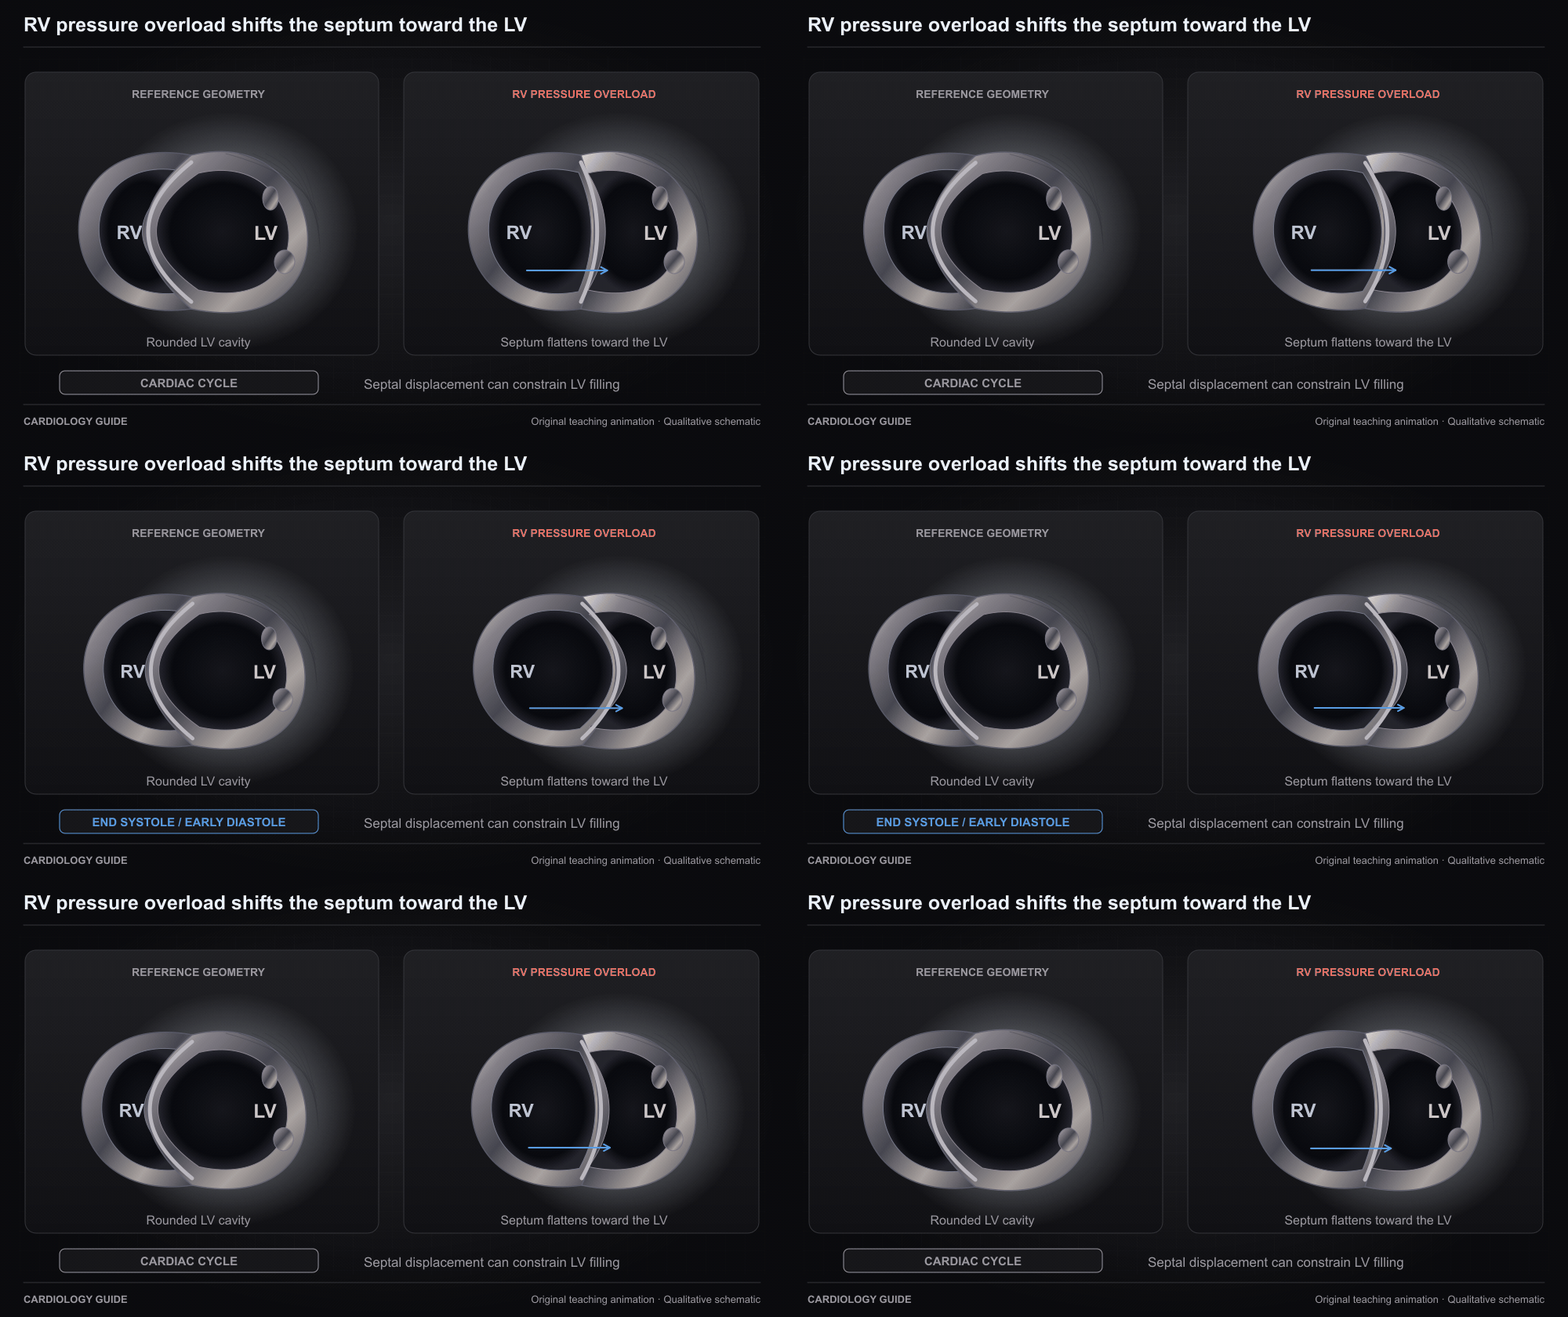
RV pressure overload shifts the septum toward the LV
A short-axis teaching comparison shows RV pressure overload flattening and displacing the interventricular septum toward the LV, most apparent near end systole and early diastole. This can constrain LV filling.
Original qualitative teaching schematic. Motion, particles and traces are illustrative. Timing and geometry are simplified.
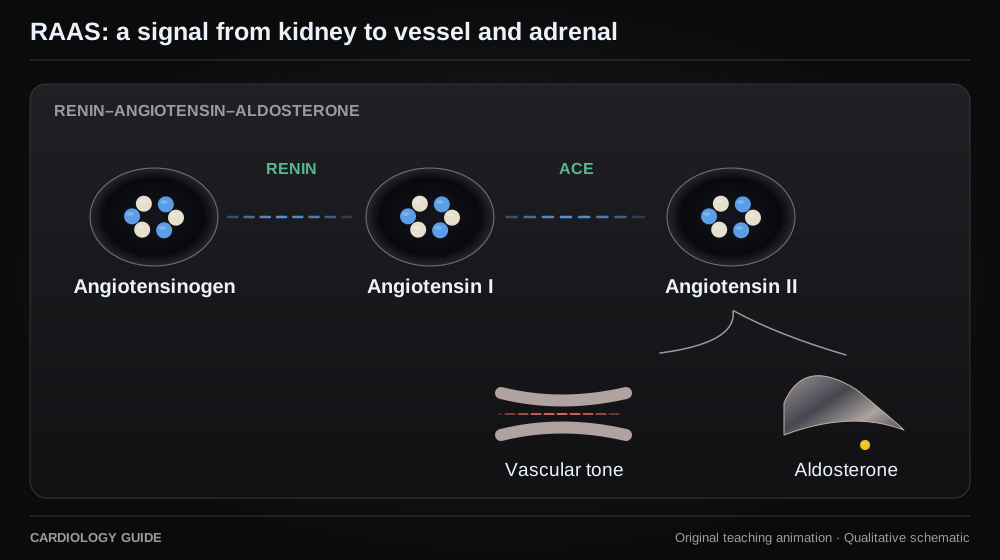
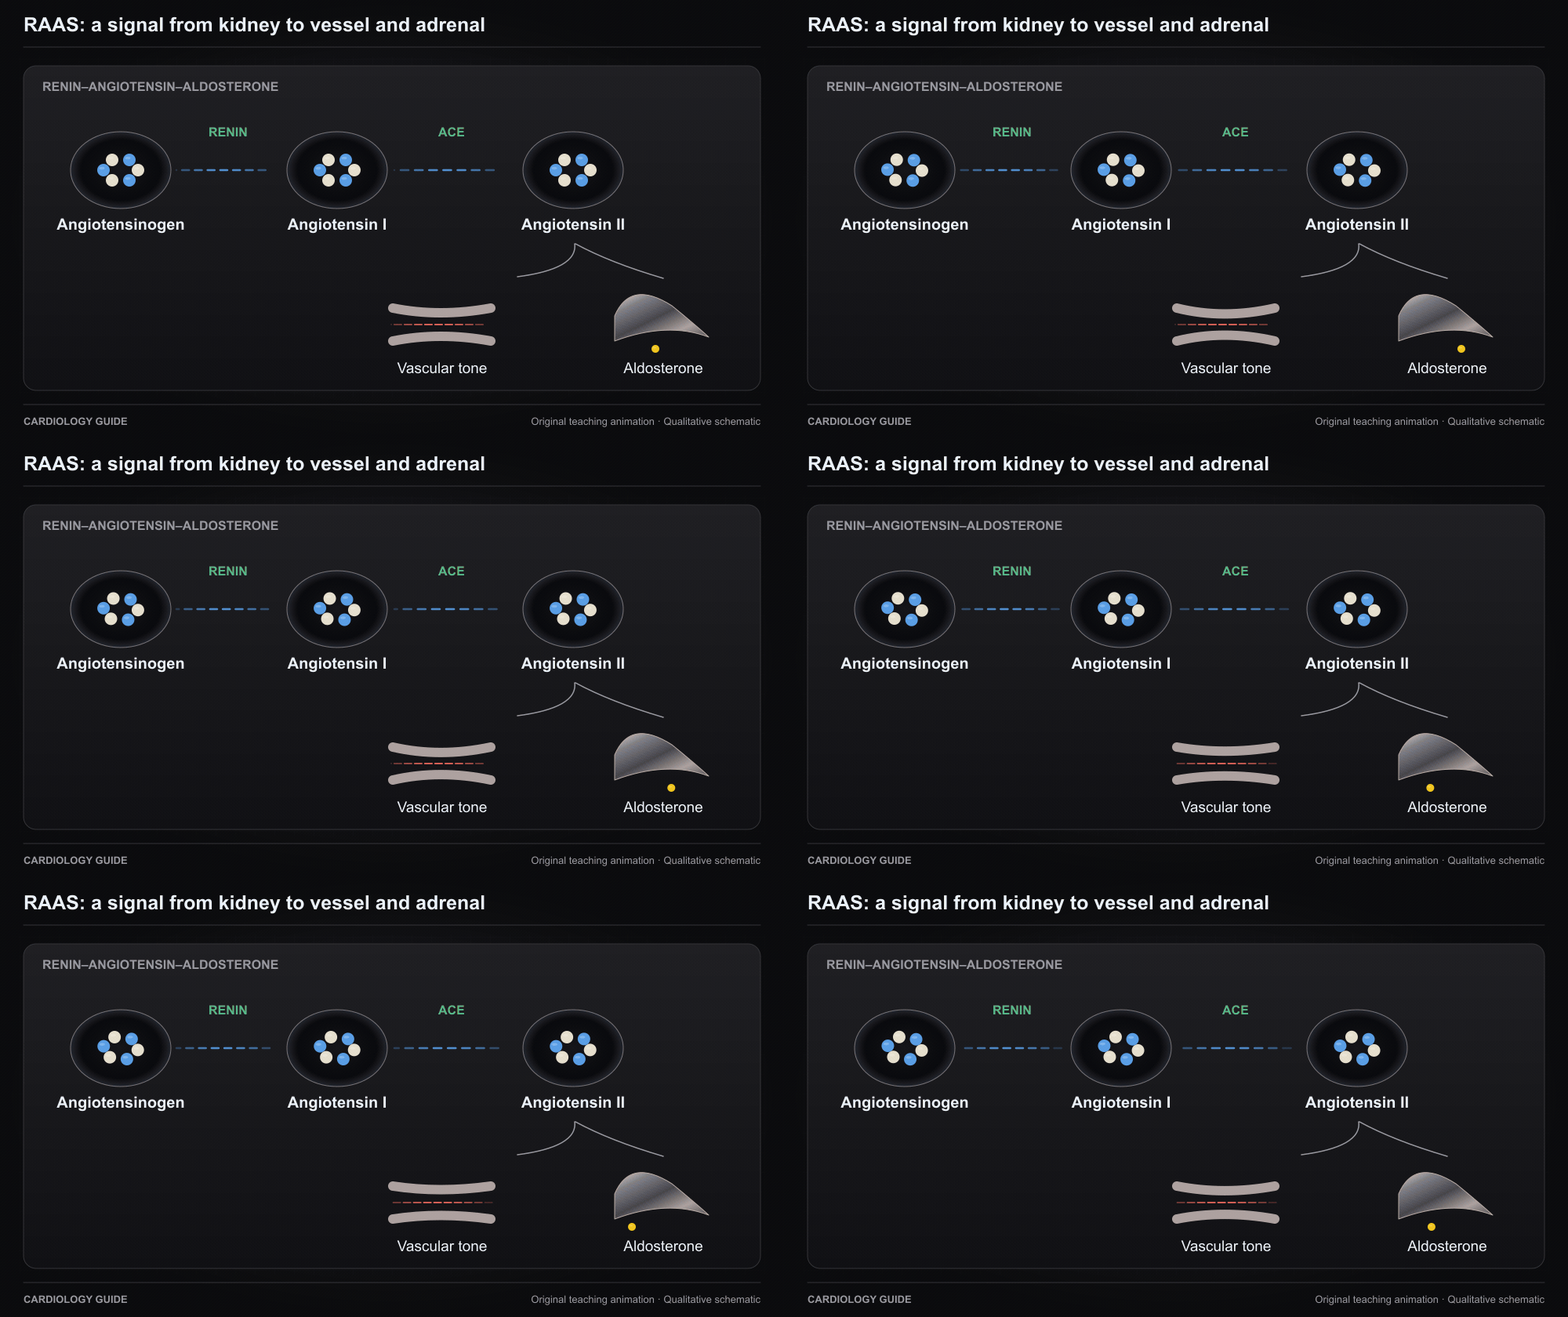
RAAS: a signal from kidney to vessel and adrenal
Renin begins a cascade producing angiotensin II. Angiotensin II activates vascular and adrenal pathways. This is signaling, not the physical path of one molecule.
Original qualitative teaching schematic. Motion, particles and traces are illustrative. Timing and geometry are simplified.
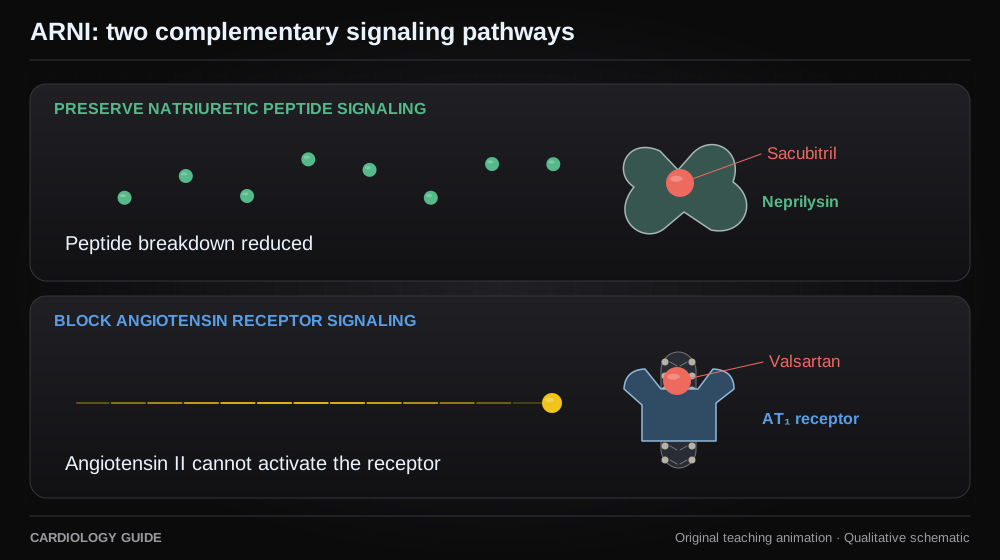
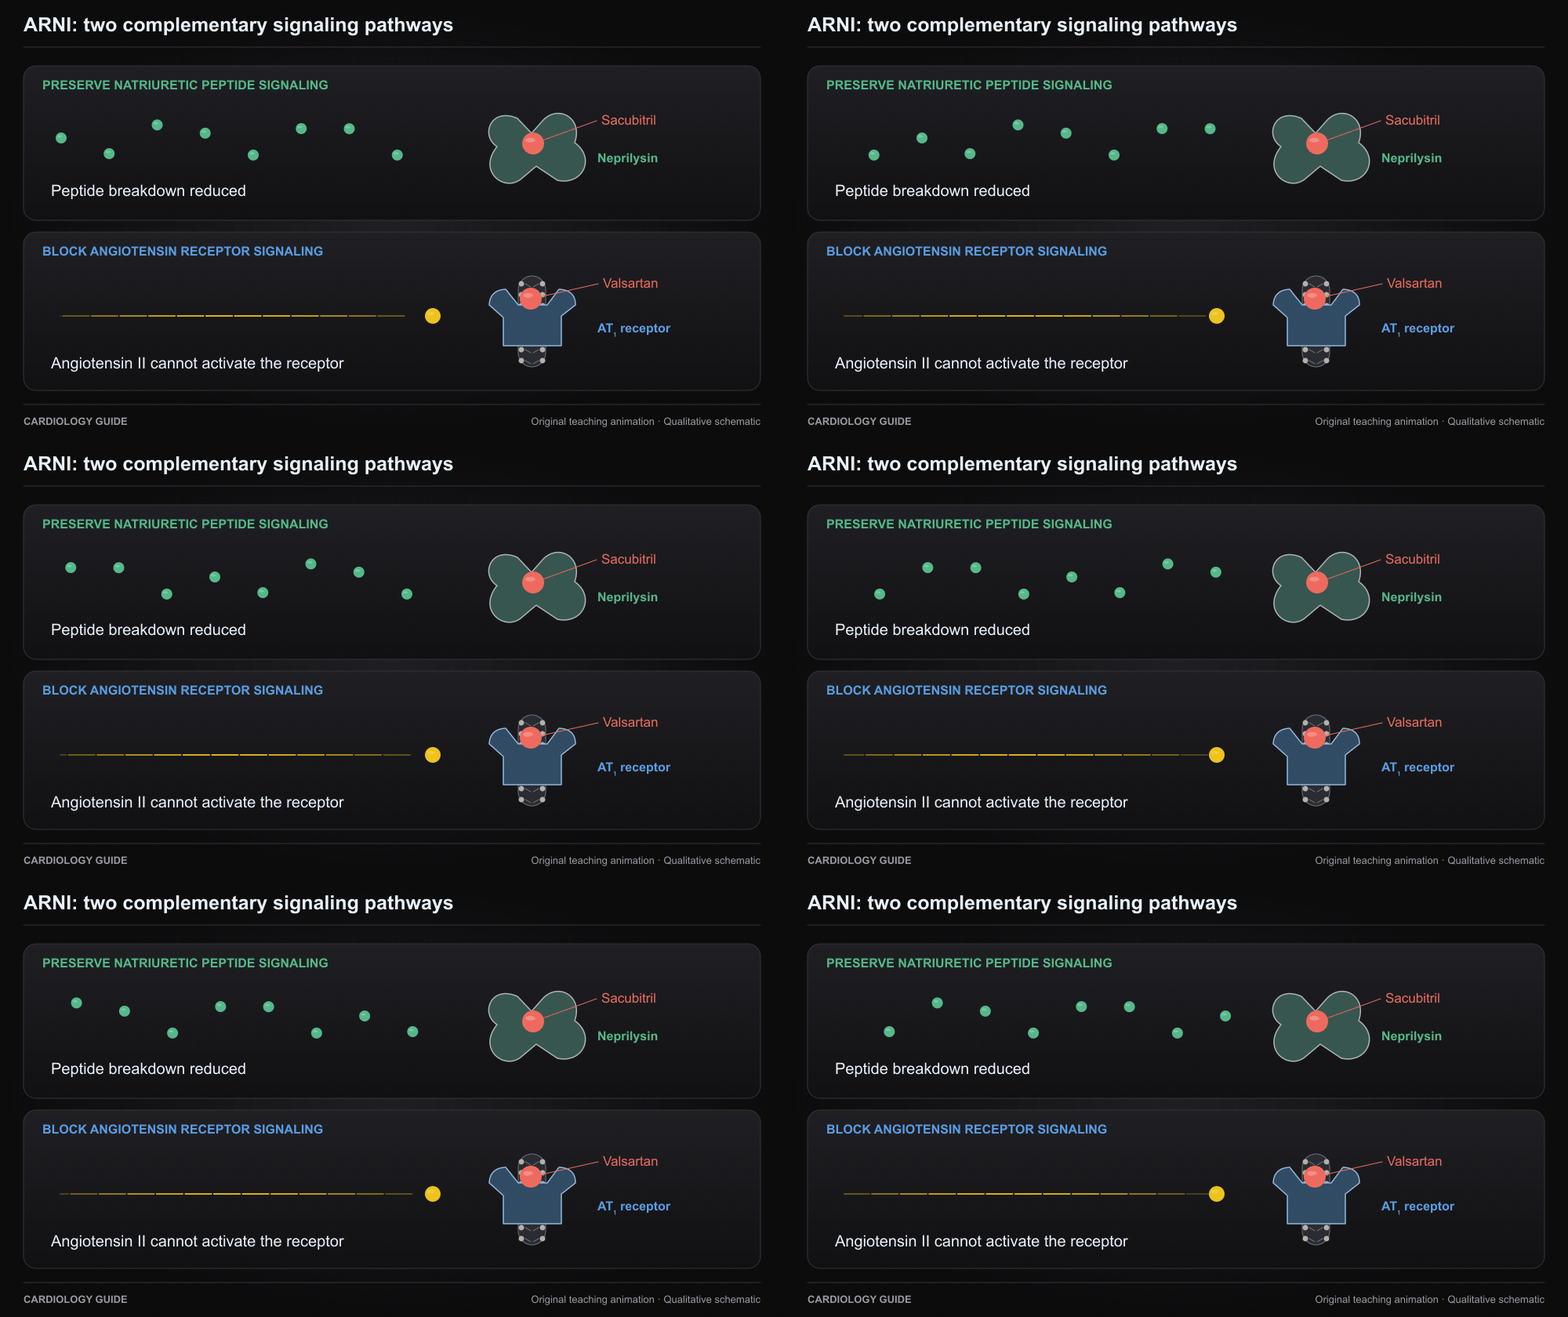
ARNI: two complementary signaling pathways
Sacubitril inhibits neprilysin through its active metabolite. Valsartan blocks the AT1 receptor. The loop separates peptide preservation from angiotensin receptor blockade.
Original qualitative teaching schematic. Motion, particles and traces are illustrative. Timing and geometry are simplified.
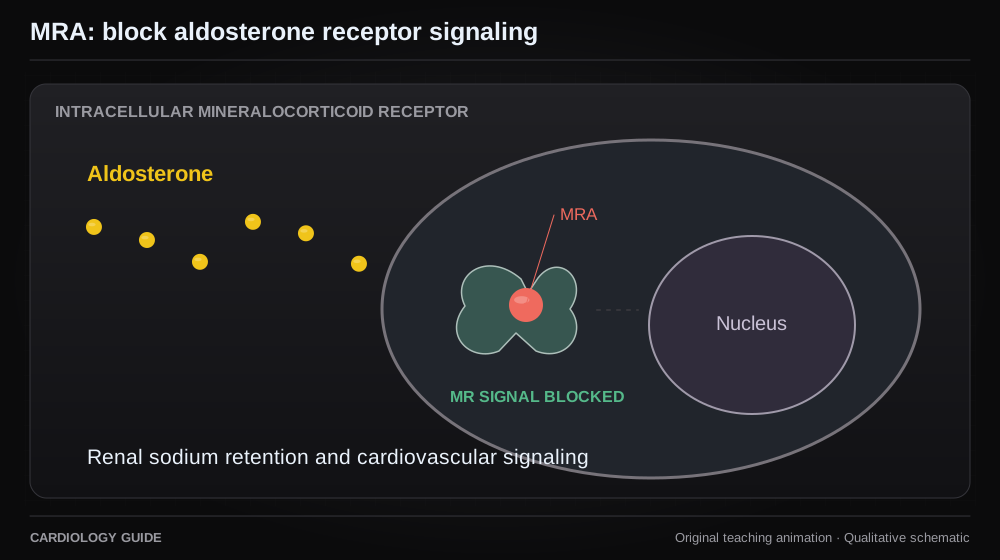
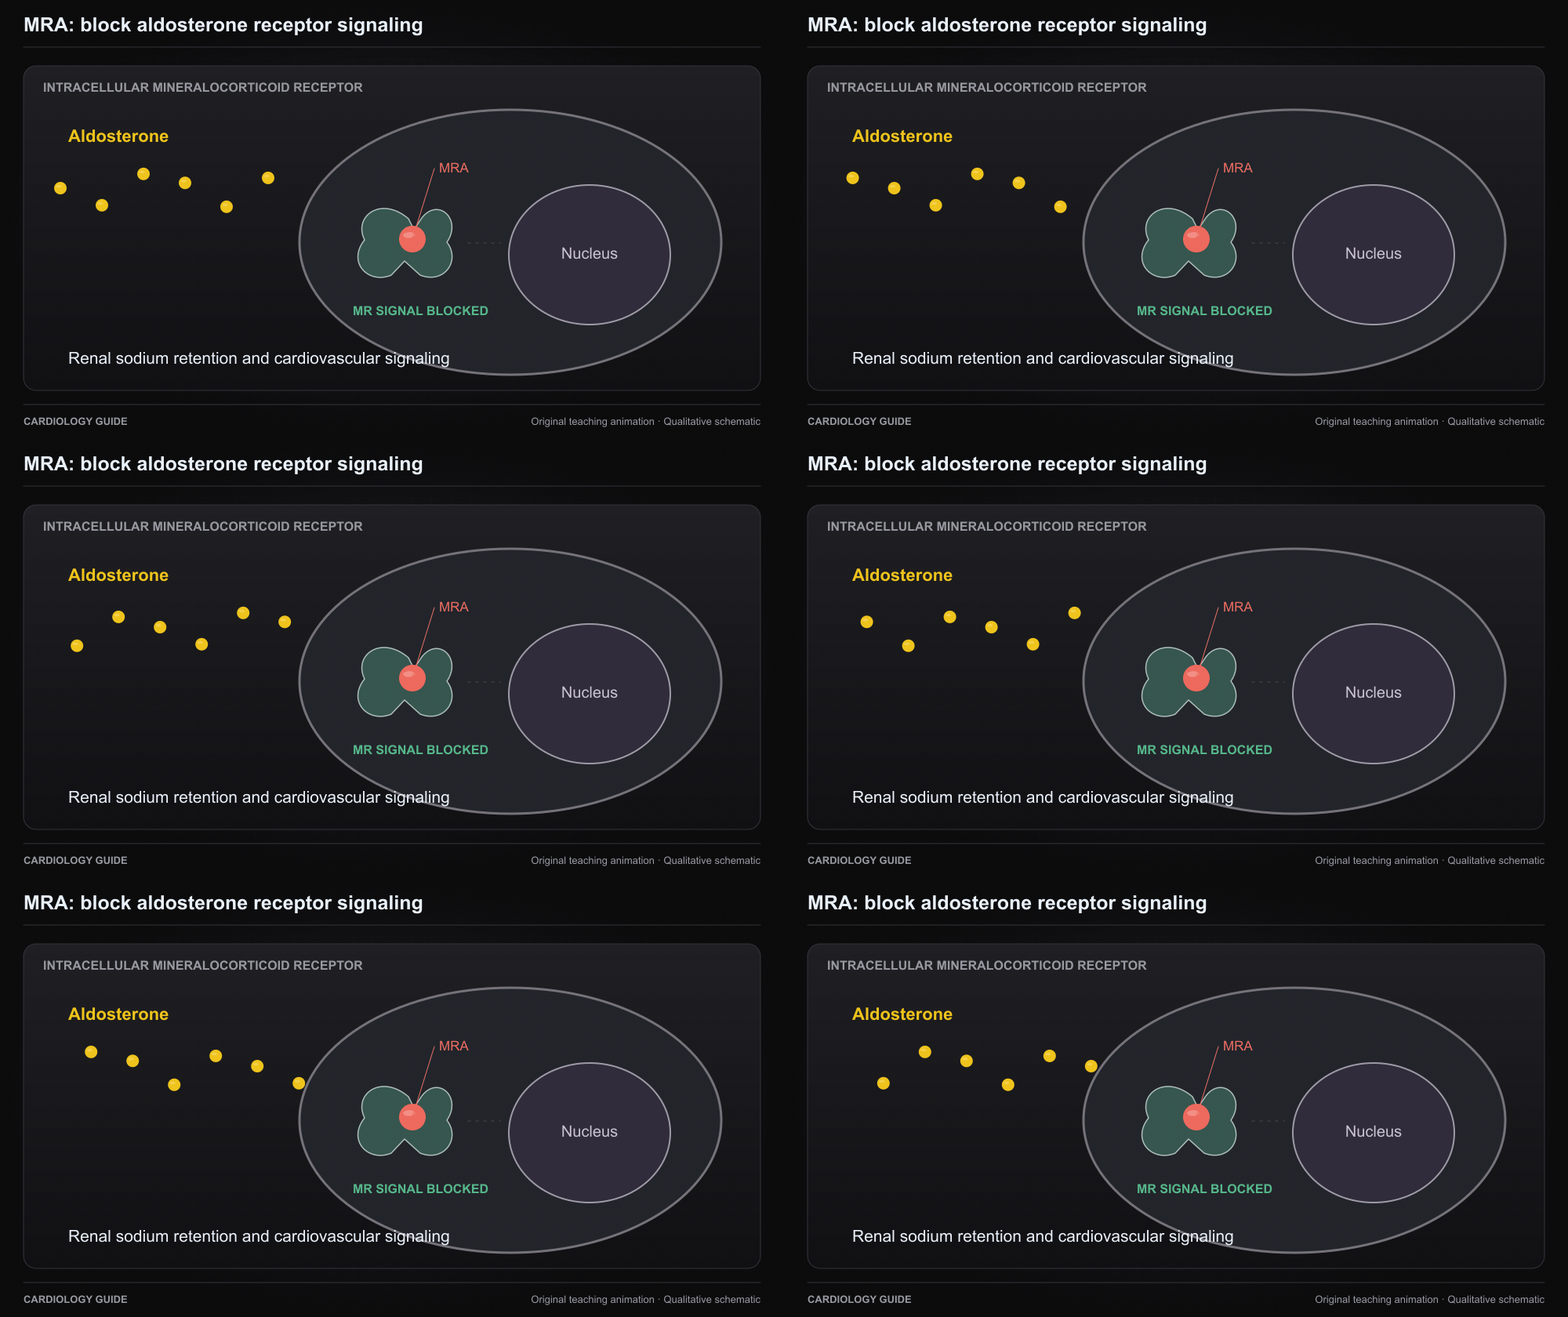
MRA: block aldosterone receptor signaling
Mineralocorticoid receptor antagonists block aldosterone receptor signaling. The kidney and cardiovascular effects are represented as pathways, not measured effects.
Original qualitative teaching schematic. Motion, particles and traces are illustrative. Timing and geometry are simplified.
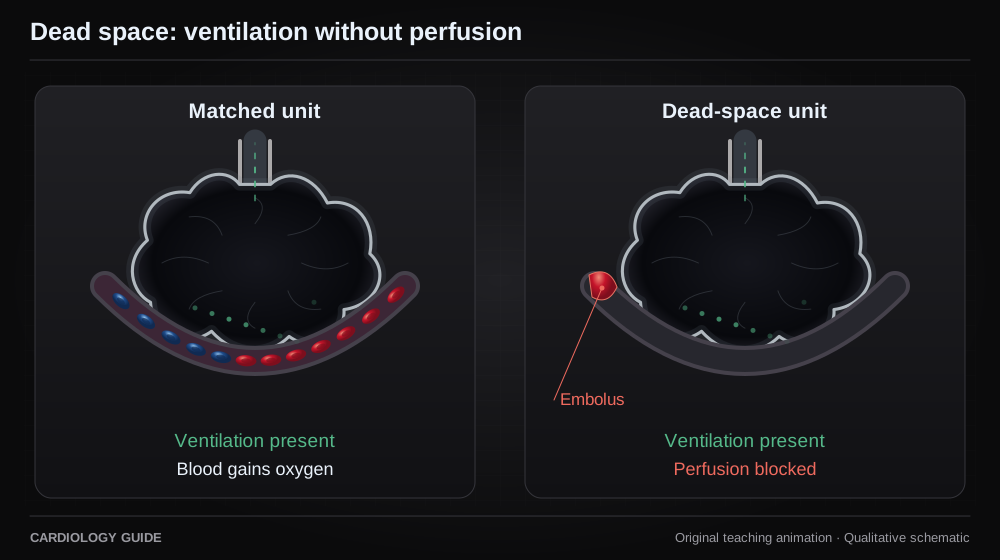
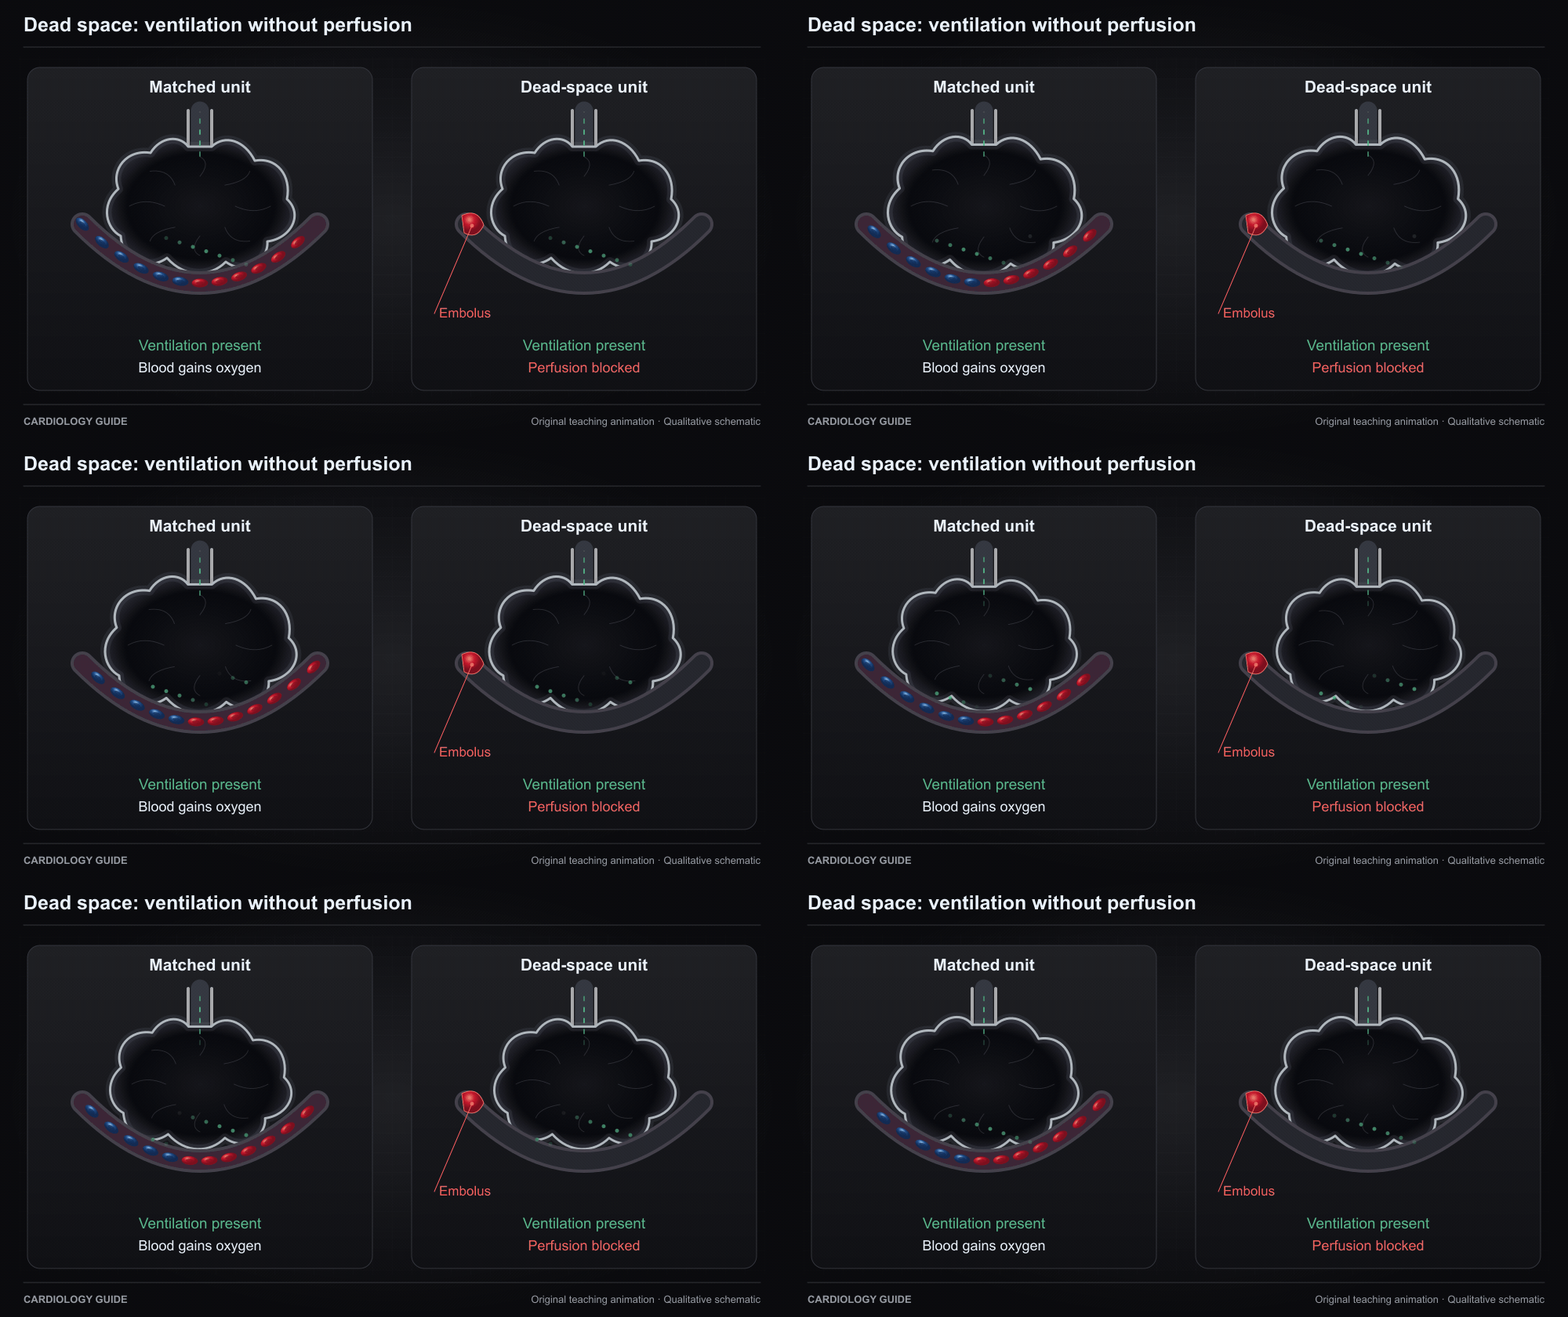
Dead space: ventilation without perfusion
A ventilated alveolus loses effective capillary perfusion downstream from obstruction. Real pulmonary embolism also redistributes flow and creates other V/Q abnormalities.
Original qualitative teaching schematic. Motion, particles and traces are illustrative. Timing and geometry are simplified.
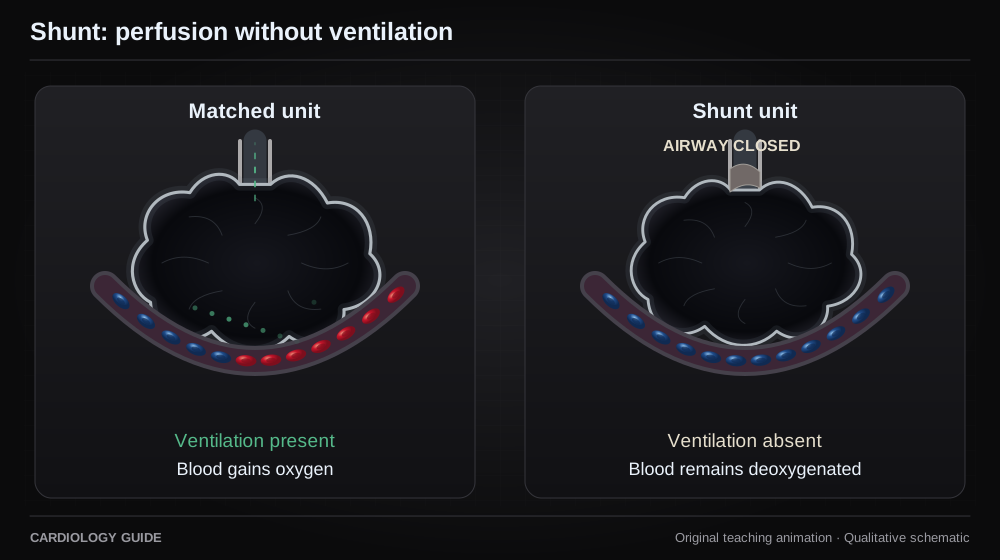
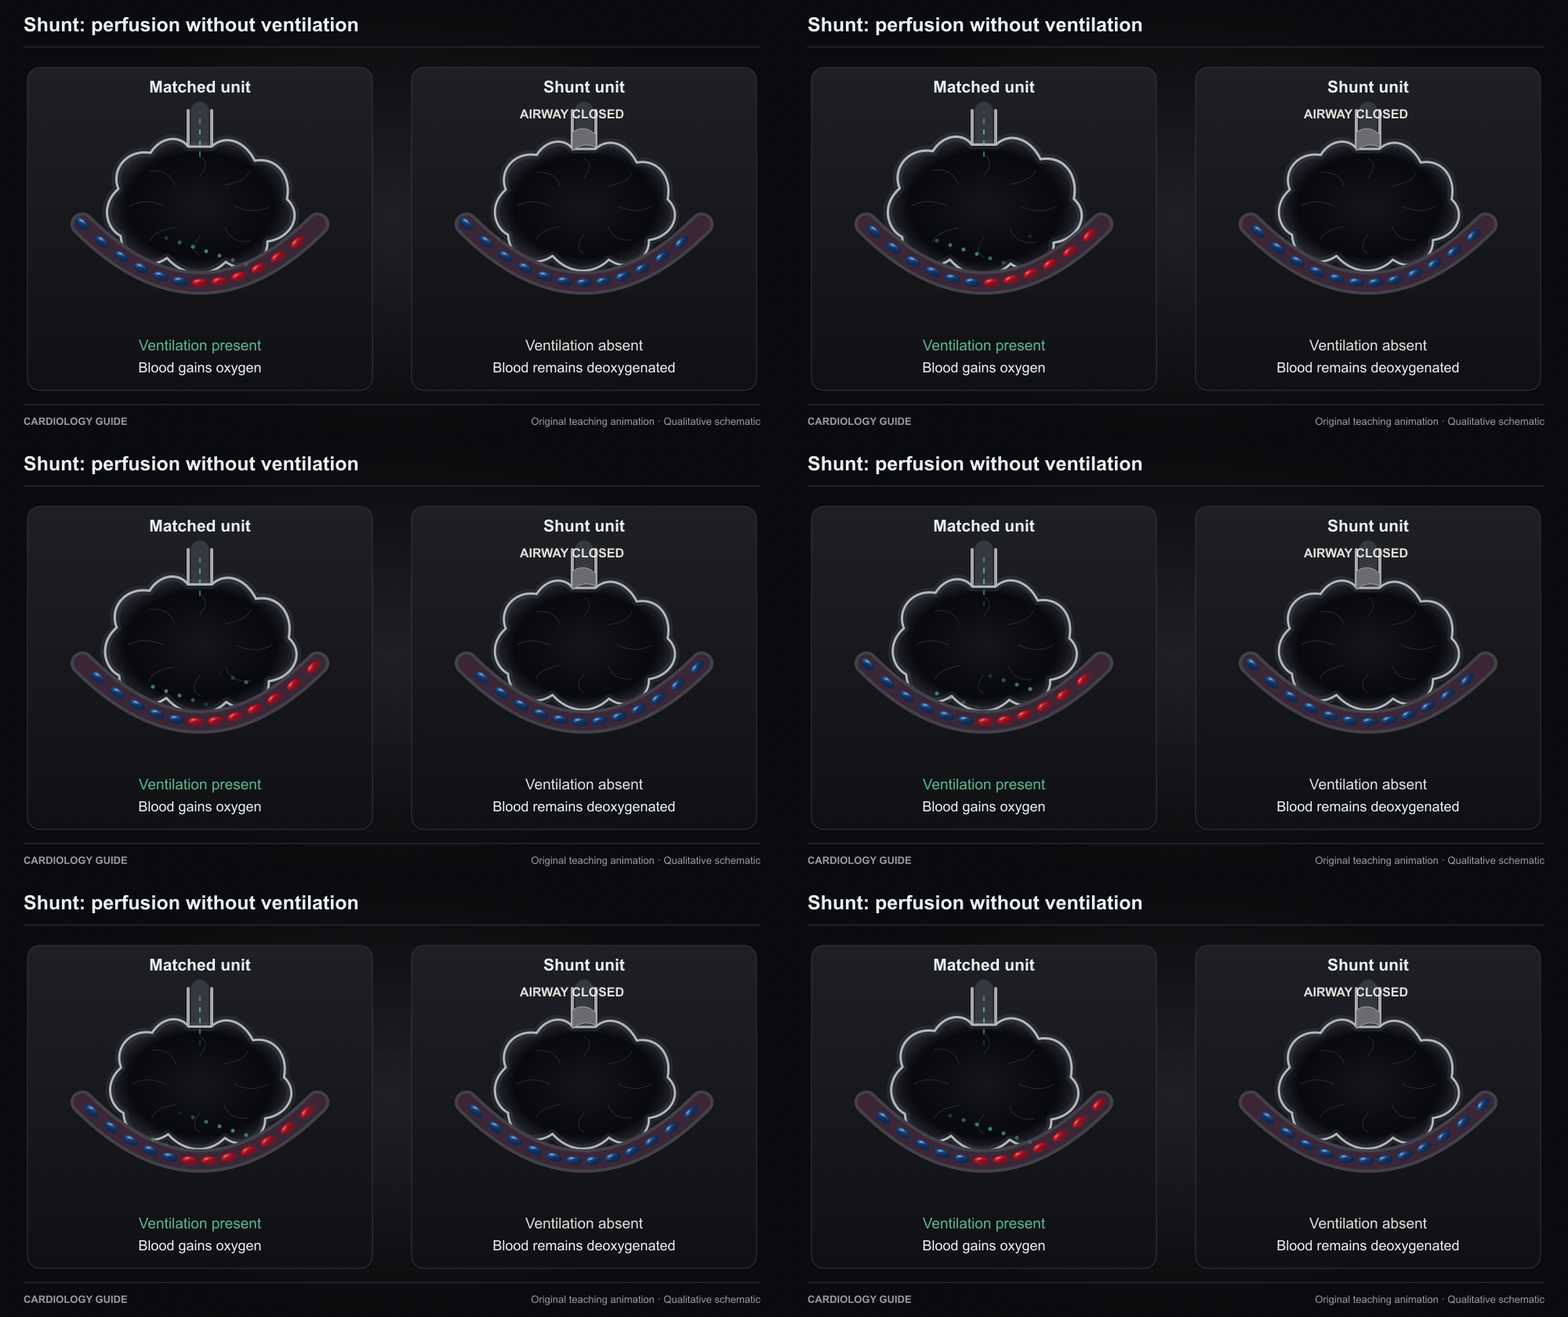
Shunt: perfusion without ventilation
Blood crosses an unventilated lung unit without gaining oxygen there. The diagram isolates a shunt mechanism and does not show the entire cause of hypoxemia.
Original qualitative teaching schematic. Motion, particles and traces are illustrative. Timing and geometry are simplified.
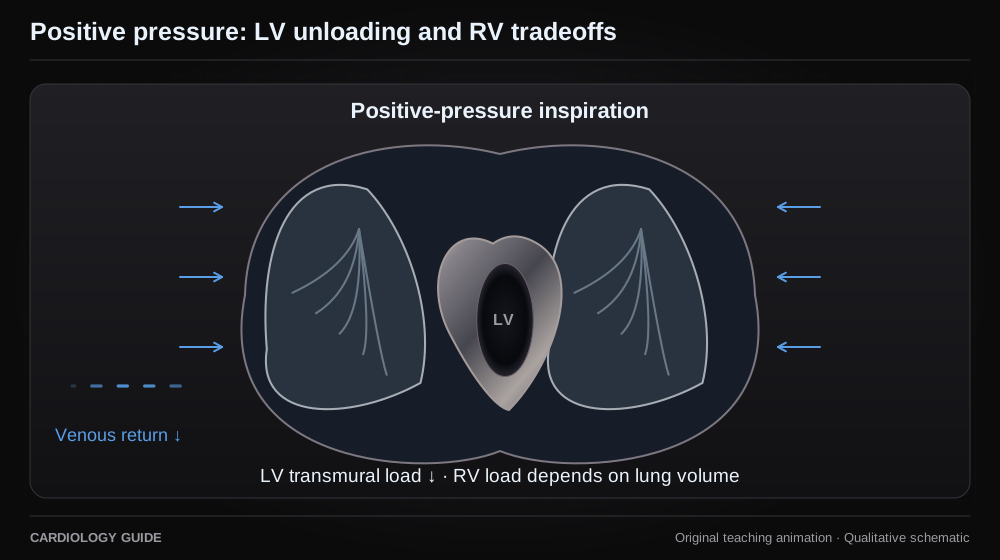
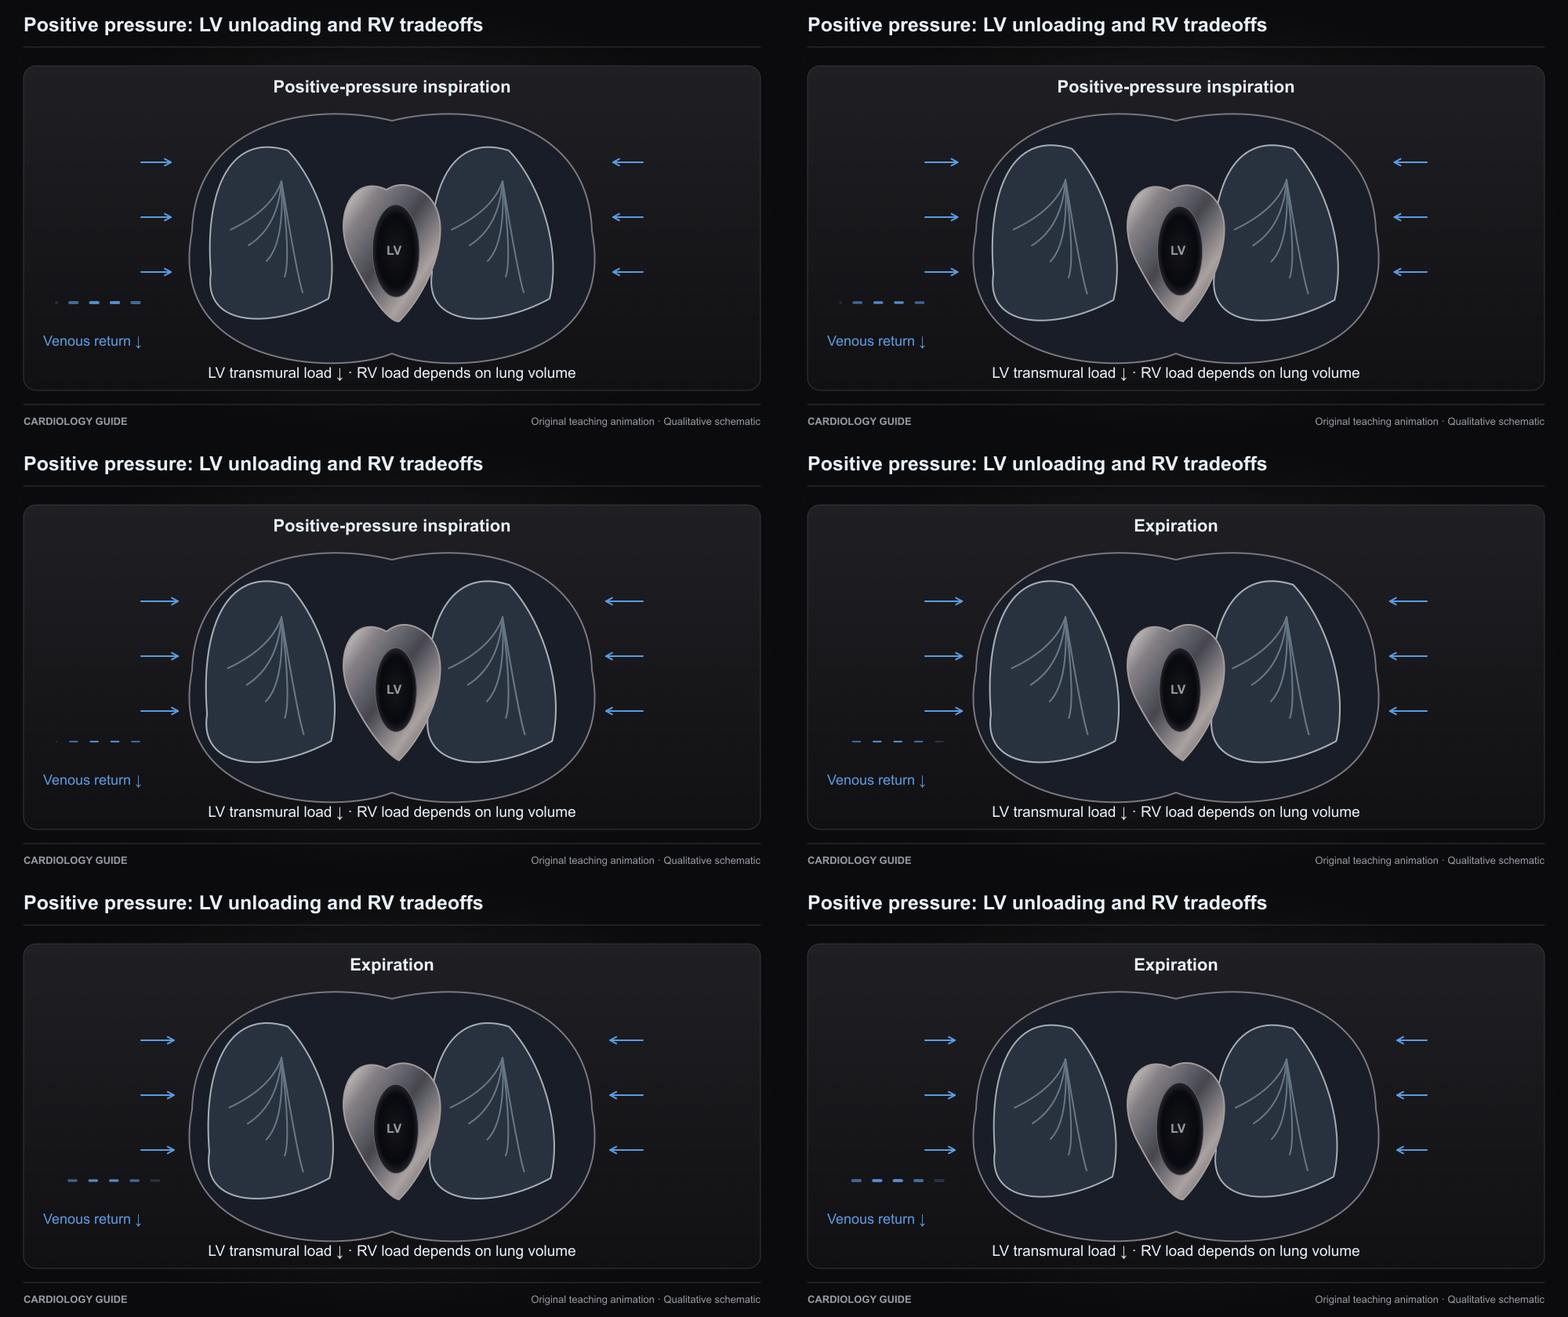
Positive pressure: LV unloading and RV tradeoffs
Rising intrathoracic pressure can reduce LV transmural afterload and the venous-return gradient. Lung overdistension can raise RV afterload. These effects are context dependent.
Original qualitative teaching schematic. Motion, particles and traces are illustrative. Timing and geometry are simplified.
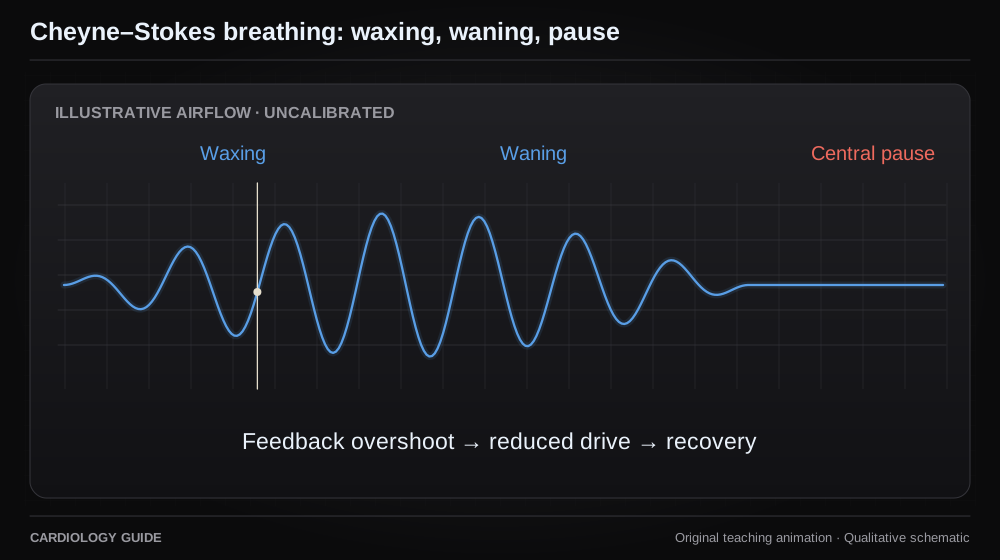
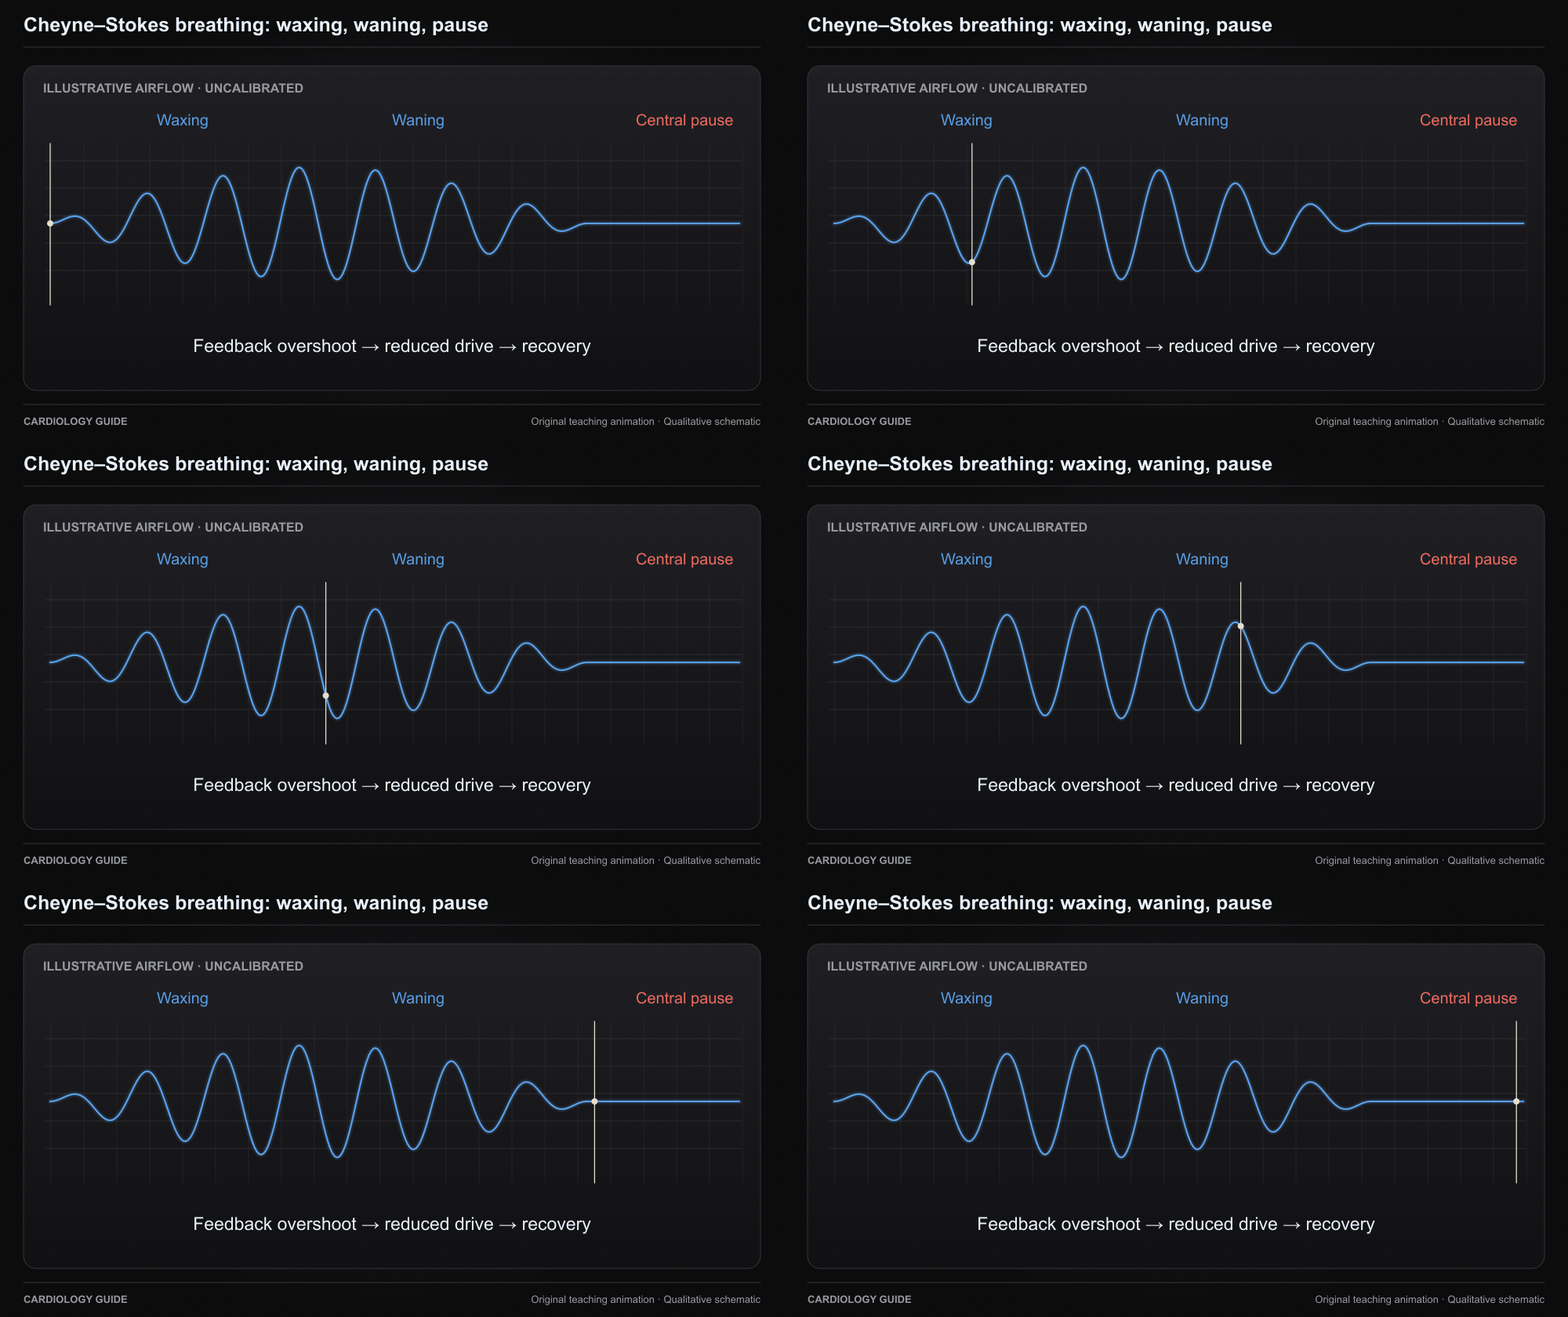
Cheyne–Stokes breathing: waxing, waning, pause
The airflow envelope waxes and wanes around central pauses. Delayed feedback and ventilatory instability contribute in heart failure. The cursor has no calibrated time scale.
Original qualitative teaching schematic. Motion, particles and traces are illustrative. Timing and geometry are simplified.
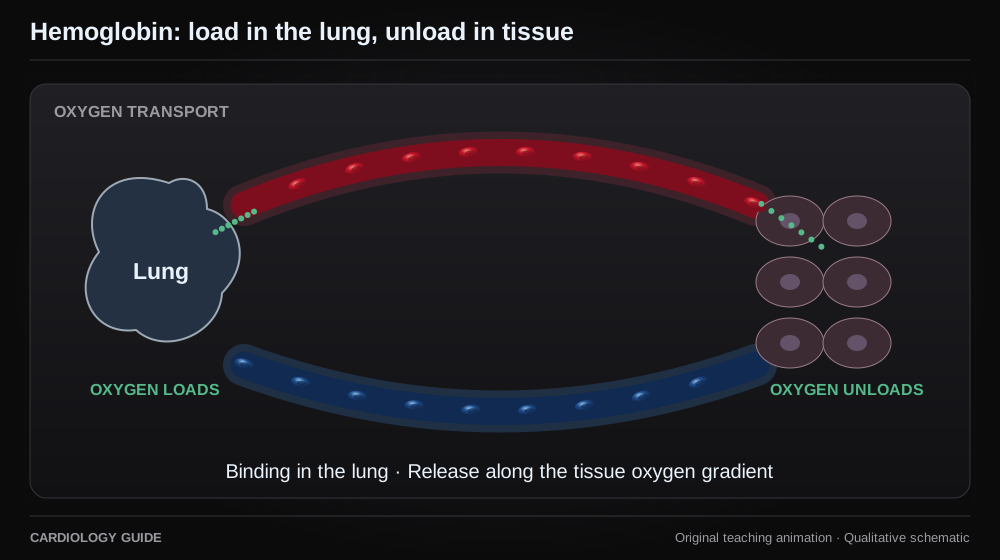
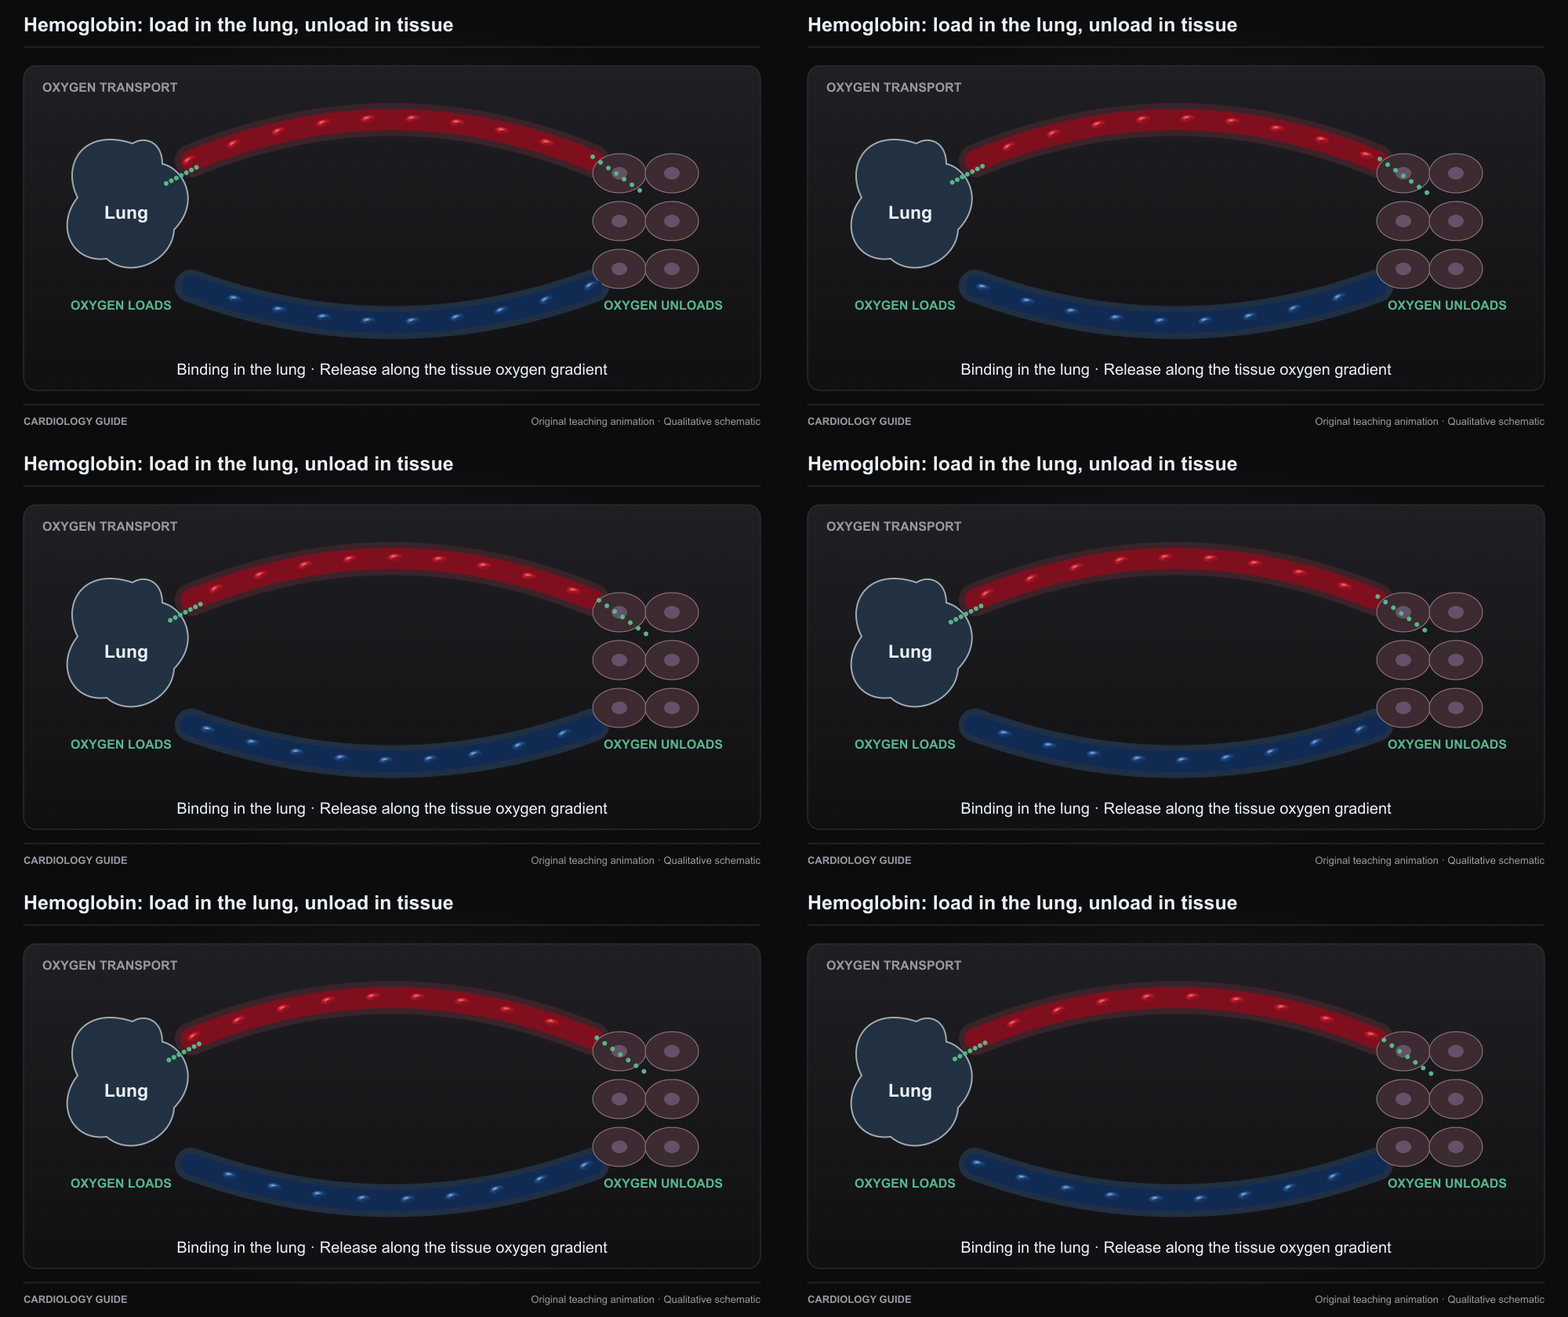
Hemoglobin: load in the lung, unload in tissue
Hemoglobin binds oxygen in the lung and releases it along the tissue oxygen gradient. The dots are qualitative and do not depict a measured oxygen content or saturation.